ISSN 0104-6632 Printed in Brazil
www.abeq.org.br/bjche
Vol. 31, No. 02, pp. 457 - 468, April - June, 2014 dx.doi.org/10.1590/0104-6632.20140312s00002304
Brazilian Journal
of Chemical
Engineering
A SUPERVISION AND CONTROL TOOL BASED
ON ARTIFICIAL INTELLIGENCE FOR HIGH CELL
DENSITY CULTIVATIONS
A. C. L. Horta
1,2*, A. J. Silva
2, C. R. Sargo
2, A. M. Velez
2, M. C. Gonzaga
2,
R. C. Giordano
2, V. M. Gonçalves
3and T. C. Zangirolami
21Universidade Federal de Goiás, Instituto de Química, Phone: + (55) (62) 3521-1097, Ext: 209,
Fax: + (55) (62) 3521-1167, P.O. Box 131, Zip Code: 74001-970, Goiânia - GO, Brazil. E-mail: [email protected]
2
Universidade Federal de São Carlos, Departamento de Engenharia Química, São Carlos - SP, Brazil. E-mail: [email protected]
3Instituto Butantan, Centro de Biotecnologia, São Paulo - SP, Brazil.
E-mail: [email protected]
(Submitted: September 26, 2012 ; Revised: April 4, 2013 ; Accepted: June 24, 2013)
Abstract - High cell density cultivations of recombinant E. coli have been increasingly used for the production of heterologous proteins. However, it is a challenge to maintain these cultivations within the desired condi-tions, given that some variables such as dissolved oxygen concentration (DOC) and feed flow rate are difficult to control. This paper describes the software SUPERSYS_HCDC, a tool developed to supervise fed-batch cultures of rE. coli with biomass concentrations up to 150 gDCW/L and cell productivities up to 9 gDCW.L
-1
.h-1. The tool includes automatic control of the DOC by integrated action of the stirrer speed as well as of the air and oxygen flow rates; automatic start-up of the feed flow of fresh medium (system based on a neural network committee); and automatic slowdown of feeding when oxygen consumption exceeds the maximum capacity of the oxygen supply.
Keywords: High cell density cultivations; Monitoring and control system; Recombinant E. coli; Fed-batch; Artificial intelligence.
INTRODUCTION
Fed-batch cultivations ofrecombinant Escherichia coli (rE. coli)are used in the production of numerous products of the pharmaceutical industry like insulin, growth hormones, vaccines and interferons (Liljeqvist and Stahl, 1999; Eiteman and Altman, 2006; Tripathi
et al., 2009). Regardless of the product of interest, the cultures are carried out with the initial goal of achieving high cell density and then proceed to the induction of the synthesis of the desired protein.
The operation mode most widely employed in high cell density cultivations (HCDC) of rE. coli is fed-batch culture with exponentially increasing feed
adjusted to the demand at every stage of cultivation, which can vary considerably after the induction of protein synthesis due to metabolic stress associated to the expression of heterologous genes involved in the production of recombinant proteins (Dabros et al., 2010).
Besides preventing substrate accumulation, F should restrict the growth rate in order to avoid the formation of metabolic by-products (Lee, 1996; Kilikian et al., 2000). The formation of acetate, the main by-product of E. coli metabolism, is triggered either by the so-called overflow metabolism or by oxygen depletion. The mechanism known as overflow occurs mainly in cultures with glucose as carbon source, when growth is maintained above the critical specific growth rate (μC) and a rapid assimilation of
the carbon source takes place (Rocha, 2003). In order to avoid overflow metabolism, the specific growth rate is limited below a critical value limiting the replenishment of the carbon source (Rocha, 2003; Demain and Vaishnav, 2009). This procedure ensures no accumulation of substrate or acetate. In turn, however, it decreases the productivity of the process by limiting the growth rate.
Other problems can occur frequently in HCDC conducted under conditions of exponential growth, such as temperature build-up, dissolved oxygen ten-sion below the desirable levels, early (or late) start-up of the feed pump, foam formation, and overpres-sure, among others.
Due to all the above mentioned reasons, an advanced monitoring and control tool is required to achieve the desired bioreactor performance during HCD cultivations. Some commercial prod-ucts (AFS-BioCommand Bioprocessing Software® from New Brunswick Scientific; DASGIP Control 4.0® from Dasgip AG; BioeXpert® from Applikon Biotechnology; Iris® from Infors HT) perform basic tasks, such as data acquisition as well as control of pH, flow rates (air, nitrogen, oxygen, feed supply, base or acid solution) and dissolved oxygen concen-tration. They also include special features, like remote access and open-configuration by the users. However, they are expensive and bioreactor-specific embedded softwares. The objective of this study was to develop, test and validate an artificial intelligence based tool called SUPERSYS_HCDC, a free and open access supervisory system for monitoring and control of rE. coli HCDC. In previously published works, specific functionalities of SUPERSYS_HCDC, namely automatic start-up of the feeding pump (Horta et al., 2011a) and a model-based adaptive control of the feeding flow rate using on-line permittivity data pro-vided by a biomass sensor (Horta et al., 2012), were
addressed. Here, a complete overview of the supervi-sory system set-up is presented and specially se-lected results that exemplify its potential are high-lighted. In addition, the novel approach developed to control the dissolved oxygen concentration, which combines the usual manipulated variables (stirring speed, gas flow rate and oxygen enrichment) with automatic restriction of feeding flow rate, is detailed.
MATERIALS AND METHODS
Microorganisms
Five recombinant E. coli BL21(DE3) strains, modified with the following plasmids, were culti-vated under the supervision of SUPERSYS_HCDC: a) pET37b+/PspA3 and PspA4Pro, kindly provided by Dr. Eliane Miyaji (Centro de Biotecnologia, Insti-tuto Butantan, São Paulo, Brazil), and pET37b+/ PspA245, provided by Dr. Luciana Leite (Centro de Biotecnologia, Instituto Butantan, São Paulo, Brazil), all three clones expressing a fragment of the surface protein A of Streptococcus pneumoniae (Barazzone
et al., 2011; Carvalho et al., 2012); b) pET28a/SpaA, producing a recombinant fragment of the SpaA protein from Erysipelothrix rhusiopathiae (Silva et al., 2012); c) pT101/D-TOPO, kindly donated by Laboratório de Biocatálisis, ICP-CSIC-Madri, Spain, with pac gene codifying for penicillin G acylase (PGA) production (Montes et al., 2007).
Medium
All the cultivations were carried out in fed-batch mode. A modified HDF medium composition (Seeger
et al., 1995; Sargo, 2011), a chemically defined me-dium containing glycerol as carbon source, was used in 17 cultures of rE. coli strains pET37b+/PspA3, PspA245, PspA4Pro and pT101/D-TOPO. Five cultures of rE. coli strains pT101/D-TOPO and pET28a/SpaA were performed using modified com-plex media (Silva, 2011), based on LB or ZYM-50552 auto-induction media compositions (Studier, 2005), containing glucose, glycerol or a mixture of both as main carbon sources and yeast extract and tryptone as nutrients.
Bioreactor Operation and Instrumentation
The pH was controlled (on/off) at 6.7 (pHmeter GLI PRO) by addition of NH4OH (30%) in the batch
phase and at 6.9 in the feeding phase. The upward shift in the pH was to ensure an adequate nitrogen supply for the growing cell population and avoid the possibility that growth and heterologous protein pro-duction would become limited by nitrogen shortage (Seeger et al., 1995; Korz et al., 1995; Lee, 1996; Babaeipour et al., 2007; Carvalho et al., 2012; Tripathi et al., 2009). Temperature was set at 25, 30, 35 or 37 °C (depending on the strain being culti-vated). The dissolved oxygen concentration (DOC) was monitored using a dissolved oxygen sensor (Mettler Toledo Inpro 6800 probe, connected to a CE O2 4050 transmitter), and maintained at 30% by a
hybrid controller (PID + Heuristic), which auto-matically changed both agitation speed (between 200 and 900 rpm) and the composition of the gas stream supplied to the bioreactor (by mixing pure oxygen with air). The total gas flow rate was maintained at 4 - 6 L/min by two mass flow controllers (GFC
AALBORG). The broth permittivity and conductiv-ity were monitored by a Biomass Sensor (FOGALE® Nanotech), with data acquisition via compact field point (cFP). The exhaust gas composition was assessed by a Sick/Maihak S.710 CO2 and O2
analyzer. On-line data acquisition, as well as moni-toring/control of all instruments via a cFP-2020 (National Instruments), was performed by the soft-ware SuperSys_HCDCR developed in LabView®. Supplementary feed flow rate was controlled by SuperSys_HCDCR to match the growth requirements through on-line estimation of the specific growth rate based on permittivity data (Horta et al., 2011c). All listed instruments presented data acquisition in real time, with acquisition intervals selected by the user, which was every 10s for the experiments described here.
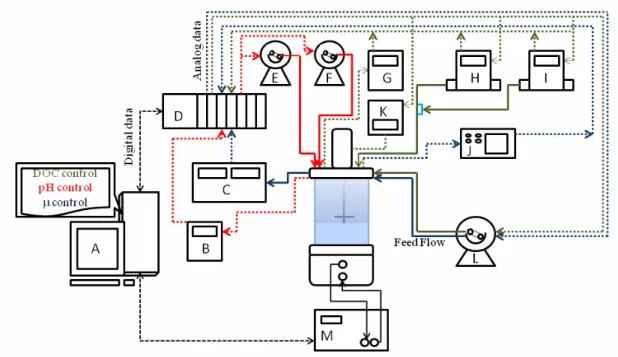
Main control loops and their respective signal and mass fluxes are also indicated in Figure 1. A more detailed description of the control loops is given in the following.
For all experiments, the exponential feeding flow rate was calculated using Equation (1) (Nielsen et al., 2002) and was automatically controlled by the supervisory system.
(
)
X0 0 SET
XS S0 SR
μ C V μ t
F m e
Y C C
⎛ ⎞
=⎜ + ⎟
−
⎝ ⎠ (1)
In Equation (1), F (Lh-1) is the feed flow rate, µSET (h-1) is the desired specific growth, YXS (gDCW
gglycerol-1) is the biomass yield coefficient based on
glycerol, m (gDCW gglycerol-1 h-1) is the maintenance
coefficient, CX0 [gDCW L -1
] and V0 (L) correspond
to the cellular concentration and volume, respec-tively, at the beginning of the fed-batch phase, CS0
(gglycerol L-1) is the carbon source concentration in the
supplementary medium and CSR (gglycerol L-1)
repre-sents the residual glycerol concentration.
Equation (1) controls the feed flow rate of fresh substrate and contain 6 variables (μ, μset, Yxs, m, Cx0,
V0) and 2 constants (Cs0, Csr), which are specified by
the user. The strategy for controlling the exponential feed flow rate changed according to the cultivation (Silva, 2011; Sargo, 2011). It evolved from the classical control strategy, where μSET, Yxs and m are
taken as constants, to a more sophisticated approach, where μ and μset were continuously retuned at each
10 min interval using the values of μ obtained on-line from the permittivity measurements provided by the capacitance biomass sensor (Horta et al., 2012). Concerning Yxs and m, usually they are taken as constant parameters. But, in fact, they can vary significantly throughout the cultivation, reflecting the metabolic changes in different culture phases. SUPERSYS_HCDCR contains an option that enables the estimation of these parameters for each sample, using a fitting algorithm such as Levenberg-Marquardt to adjust the parametric model (Monod) to the at-line measured data, like optical density and substrate concentration (Horta et al., 2011b; Horta et al., 2012).
Analytical Procedures
Cell growth was followed by the culture broth optical density reading (OD, λ = 600 nm), dry cell weight measurements (gDCW.L-1), counting CFU.mL-1
and on-line estimation by measuring broth permit-tivity (pF.cm-1).
Metabolite concentrations were assessed by HPLC (Waters Corp. system), using an Aminex HPX-87H column (Bio-Rad) and 5 mM sulfuric acid solution as mobile phase (flow rate of 0.6 mL min-1),
at 60 °C. Organic acids were detected at 210 nm (Waters 486 UV detector), while glycerol, glucose, lactose and galactose were measured with a refrac-tive index detector (Waters 410).
Supervisory and Control Tool
The SUPERSYS_HCDC software comprises modules that perform basic functions as well as real time inference of important variables. Carbon diox-ide evolution rate (CER), oxygen uptake rate (OUR) and respiratory quotient (RQ) are calculated taking into account the on-line molar fractions of CO2
(YCO2) and O2 (YO2) in the exhaust gas and the air
(Qair) and oxygen (QO2) inlet flow rates (Equations
(2), (3) and (4)).
2
2 2
air CO
CO O
P 0.79
CER Q Y
RT 1 Y Y
⎛ ⎞
= ⎜⎜ ⎟⎟
− −
⎝ ⎠ (2)
2 2
2 2
O O
O CO
OUR
P 0.79
0.21Qair Q Y Qair
RT 1 Y Y
=
⎛ ⎞
+ −
⎜ ⎟
⎜ − − ⎟
⎝ ⎠
(3)
2 2 nCO RQ
nO
= (4)
In Equations (2) to (4), R is the ideal gas con-stant, P the atmospheric pressure and T the tempera-ture, both at standard temperature and pressure (STP).
On-line cell concentration (Cx_perm) data were generated after treating the permittivity signal with a smoothed moving average (SMA) filter. Cx_perm was further used for inference of the growth rate (rx)
and specific growth rate (μ), as described in Horta
et al. (2012). Bioreactor volume (Vn, in L) was also continuously updated as a function of sample with-drawal (Vsample) and feeding medium supplied as
described by Equation (5).
(
)
(
)
1 2
2 bat
sample
2 bat
C V(n) V(n-1)
C
exp C (t(n) t )
V exp C (t(n 1) t )
⎛ ⎞
= + ⎜ ⎟
⎝ ⎠
−
⎡ ⎤ −
⎢− − − ⎥
⎣ ⎦
(5)
where V(n-1) is the volume of the previous step and the term (C1/C2)[exp(C2(t(n)-tbat))-exp(C2(t(n-1)-tbat))]
The on-line estimated μ values enabled the implementation of an automatic control of the feed-ing flow rate (F) defined by Equation (1) through the dynamical updating of the specific growth rate. For this purpose, every 10 minutes μSET was replaced by
μDYN, which was obtained after processing a vector
containing 50 instances with the SMA filter (Horta
et al., 2012).
To cope with the changes in cell metabolism taking place after induction, which strongly impact the specific growth rate as well as the maintenance and biomass yield coefficients, a module for auto-matic fitting of Yxs and m to Equation (1) was set-up and integrated to the control program. The parame-tric fitting system is based on the global (Simulated Annealing, Particle Swarm, Differential Evolution) and local search (Levenberg-Marquadt) algorithms to estimate, inside a confidence region, the optimal values for Yxs and m (Horta et al., 2012).
Besides the automatic updating of key parameters in Equation (1), the feed flow rate control also incor-porated a modulation of the growth rate to maintain DOC at the desired set-point. Thus, F control only followed Equation (1) if the DOC was ~ 30 % of saturation. When OUR exceeded the maximum bio-reactor oxygen transfer rate (OTR), at the maximum stirring speed and maximum oxygen flow rate, the F control combined Equation (1) to the logic described in Figure 2, preventing oxygen depletion and the for-mation of undesirable metabolic by-products, such as acetic acid.
Procedure: DOC - Feeding restrictions
Start
if DOC<DOCmin Then X=K
else X=1
C1=(X*Mi/Yxs +m)*CX0*V0/(CS0-CSR)
C2= exp(X*MiDYN*t)
F=C1*exp(C2*t)
End
Figure 2: Pseudo-code for combined control of feed flow rate. DOCmin is the lower limit for dissolved
oxygen concentration; K is the modulation factor chosen by the user in the range: 0 ≤ K < 1.
To complete the automation of feed supply, a special module for automatic start-up of the feed pump was developed and implemented. The identifi-cation of the end of the batch phase was performed by a neural network based softsensor, which produced a command signal to start the feed pump (Horta et al., 2011a). The neural network (nn) was trained offline, using data from real experiments.
The nn committee structure guaranteed that a new nn generated from a new experiment could be added to the committee without loss of knowledge from the previous experiments.
To match the typically high OUR of E. coli HCDC, the DOC control was accomplished by developing a hybrid system, which combined the classical PID (proportional, integral and derivative) controller directly acting on the stirrer speed to a heuristic algorithm modulating the flow rates of air and oxygen. The PID controller is described in Figure 3, where “Agit” refers to the stirrer speed (rpm), “Kc” to the proportional constant, “Td” the derivative constant, “Ti” to the integral constant, “SetP” to the DOC set-point and “t” to time (s).
(
)
(
)
(
)
(
)
(
)
(
)
⎪⎪ ⎪ ⎪ ⎪ ⎭ ⎪ ⎪ ⎪ ⎪ ⎪ ⎬ ⎫ ⎪ ⎪ ⎪ ⎪ ⎪ ⎩ ⎪ ⎪ ⎪ ⎪ ⎪ ⎨ ⎧ ⎟ ⎟ ⎟ ⎠ ⎞ ⎜ ⎜ ⎜ ⎝ ⎛ − − + + − − ⋅ − + − ⋅ + + − ⋅ + + ⎥ ⎦ ⎤ ⎢ ⎣ ⎡ − − − + − ⋅ + + − = 2) DOC(t SetP 1) DOC(t SetP 2 DOC(t) SetP Δt Td DOC(t) SetP Ti Δt 1) DOCt SetP DOC(t) SetP Kc 1) Agit(t Agit(t)Figure 3: Pseudo-code for the dissolved oxygen concentration control module (Seborg et al., 2004).
The control of air (QAIR) and oxygen (QO2) flow
rates is performed by an independent algorithm based on the heuristic logics presented at Figure 4.
Procedure: oxygen enrichment control
Start
If Agit<0.7*AgitSL and QO2-1>0
QAIR=QAIR+Δ
QO2=QO2-1-Δ
If Agit≥0.99*AgitSL and DOC<DOCIL
If QAIR≥(QMAX-QO2-1)
QAIR=QAIR-Δ
QO2=QO2+Δ
If not QAIR=Δ+QAIR
QO2=QO2-1
End
Figure 4: Pseudo-code for the control of air and oxygen flow rates. AgitSL is the upper limit for
agitation; DOCIL, the lower limit for DOC; QMAX, the
Another important feature developed and imple-mented in SUPERSYS_HCDC is a set of specific alarms for fault detection and warning and its pseudo-code is given in Figure 5. The alarm system warns the operator via the computer loudspeakers, as well as by sending text messages via SMS.
RESULTS AND DISCUSSION
SUPERSYS_HCDC was upgraded, tested and validated by using it as the supervisory and control system in 22 fed-batch cultures of recombinant
E. coli, 19 of them being high cell density cultures (final biomass concentration over 50 gDCW/L). The
results showing the performance of the developed supervisory system concerning the dynamic control of the supplementary medium flow rate and the automatic start-up of the feed pump have already been detailed (Horta et al., 2011a,b, 2012). The results concerning the on-line estimation of CER, OUR and RQ, as well as the DOC control, are highlighted in the followings.
On-Line Estimation of CER, OUR, RQ and μ
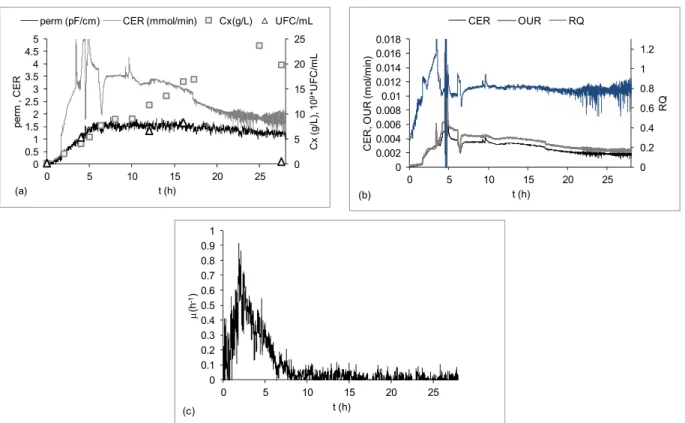
Figure 6 shows the results of an example of an auto-induction experiment in which cells were ex-posed to the inducer (lactose) from the beginning, but protein expression was actually intensified 4h after the onset of cultivation when the glucose pre-sent in the batch medium was totally consumed. Figure 6 (a) shows that the on-line signs (perm and CER) and the off-line (Cx) showed similar increas-ing profiles within ~ 4 h of culture. Figure 6(b) ex-hibits the results of CER, OUR and RQ on-line calculation from the gas analyzer measurements of
CO2 and O2 mole fractions in the exhaust gas
leaving the bioreactor (Equations (2), (3) and (4)). These data can be compared to the trends in permit-tivity signal, biomass concentration experimental points and μ inferred from the biomass sensor, which are displayed in Figures 6 (a), (b), (c).
After induction intensification, while the meas-ures of Cx (Fig. 6(a)) indicated that growth con-tinued at a slow specific growth rate (decreasing from ~ 0.1 to 0.05h-1), CER, OUR, RQ and permit-tivity on-line data (Fig. 6(b)) suggested severe growth stagnation and even a decline in metabolism, fol-lowing closely the UFC/mL counts. This mismatch happens because optical density readings or dry cell weight measurements do not distinguish viable from non-viable cells. Conversely, permittivity data re-flect the polarization of the cell membrane when submitted to low radio frequencies (0.1-20 MHz). Hence, the dielectric permittivity is directly propor-tional to the viable biomass concentration, since dead cells do not present polarization in their mem-branes (Matanguihan et al., 1994; Markx and Davey, 1999; Tibayrenc et al., 2011). Similarly, CO2
production as well as O2 uptake is also strongly
influenced by the physiological state of the cells. Thus, CER, OUR and permittivity data described the metabolic burden imposed by the impacts of prolonged induction on cell viability, leading to the growth cessation after 10 h of cultivation (Figures 6(a), (b)). These changes in growth profile were correctly reproduced by the specific growth rate estimated from permittivity data (Figure 6(c)). The same approach, i.e., the use of on-line permittivity data for real time inference of growth rate for different organisms, has been reported elsewhere (Davey et al., 1996; Henry et al., 2007; Dabros et al., 2010).
Procedure: alarms
Start
If pH>1.05*pHsetPoint then Message= fault at acid pump;
If pH<0.95*pHsetPoint then Message= fault at base pump;
If T>1.05*TsetPoint then Message= decrease the bath temperature;
If T<0.95*TsetPoint then Message= raise the bath temperature;
If OD<0.5*ODsetPoint then Message= increase the total gas flow rate or the stirrer speed;
If QO2<0.95*QO2setPoint then Message= raise the pressure of oxygen supply line;
If Air<0.95*QAirsetPoint then Message= raise the pressure of air supply line;
If P>PSL then Message= Excessive overpressure in the reactor;
End
0 5 10 15 20 25
0 0.5 1 1.5 2 2.5 3 3.5 4 4.5 5
0 5 10 15 20 25
C
x
(g
/L
),
1
0
9*UF
C
/m
L
pe
rm
,
C
E
R
t (h)
perm (pF/cm) CER (mmol/min) Cx(g/L) UFC/mL
(a)
0 0.2 0.4 0.6 0.8 1 1.2
0 0.002 0.004 0.006 0.008 0.01 0.012 0.014 0.016 0.018
0 5 10 15 20 25
RQ
CE
R
, O
U
R (
m
o
l/
m
in
)
t (h)
CER OUR RQ
(b)
0 0.1 0.2 0.3 0.4 0.5 0.6 0.7 0.8 0.9 1
0 5 10 15 20 25
μ
(h
-1)
t (h) (c)
Figure 6: Fed-batch cultivation of E. coli BL21(D3) expressing a fragment of SpaA antigenic protein. Culture carried out with auto-induction complex medium, containing glucose, glycerol and lactose as carbon sources, at 37 °C (Silva, 2011). (a) permittivity (perm – pF/cm), carbon evolution rate (CER – mmol/min), cell concentration (Cx – gDCW/L) and viability (109*UFC/mL); (b) CER (mol/min), oxygen uptake rate
(OUR – mol/min) and respiratory quotient (RQ); (c) specific growth rate (μ – h-1
).
These results highlight the importance of per-mittivity, CER and OUR data for physiological state identification, as well as for setting up suit-able control strategies of feed supply. This is particularly true for cultivations of genetically modi-fied organisms, because the production of the re-combinant protein impairs cell viability, leading to reduced growth and substrate uptake rates. In addition, it has been shown that biomass yield and maintenance coefficients underwent expressive changes throughout the induction phase to correctly describe the metabolic shift associated with protein synthesis (Horta et al., 2012). Thus, to properly tackle such a complex problem, an integrated supervision environment, as provided by SUPERSYS_HCDC® or alike, is required.
Hybrid Controller of DOC
E. coli cultures are characterized by their high oxygen demand. Kuprijanov et al. (2009) emphasized the importance of fine controlling the DOC and proposed a very efficient feedforward/feedback
con-troller based on a gain schedule approach. This controller was set-up with the air flow rate and stirring speed as manipulated variables and vali-dated in fermentations of rE. coli releasing a green fluorescent protein.
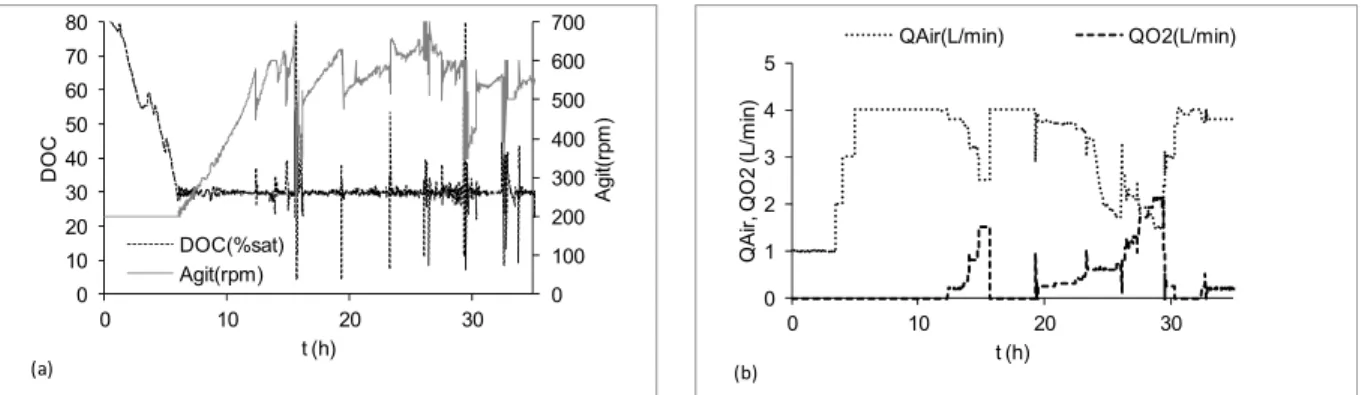
2.3 L/min. Just before 30 h of culture, a new event (substrate shortage followed by the inducer pulse – data not shown) led to a reduction of growth and oxygen uptake rates. Again, the hybrid controller showed an efficient response, automatically cutting down the oxygen supply and returning the air flow rate to 4 L/min.
The occasional oscillations observed in the DOC data are due to the variations in the air and oxygen flow rates, which are related to the mass flow con-troller operation ranges. Mass flow concon-trollers speci-fied to operate at maximum flow rates of ~ 5 L/min have accuracy limits in the range of + 0.3 L/min. The accuracy of the flow rates supplied by the mass flow controllers was also affected by the head loss increase due to the biomass build-up in the broth that also led to higher viscosity.
DOC Control by Growth Rate Modulation
Actually, the maximum achievable biomass concentration in a fed-batch culture is limited by the highest oxygen transfer rate (OTR) that can be supplied by the bioreactor system. For rE. coli
HCDC special care must be taken to prevent carbon source accumulation, which can easily happen if growth is limited by OTR. Furthermore, when OUR exceeds OTR, low levels of DOC are established, driving cell metabolism towards the production of undesirable fermentative products. Thus, an addi-tional module was included in the DOC controller so that the feeding flow rate was manipulated to keep the DOC at the set point in which the bioreactor was operated at its maximum OTR.
Figure 8 shows the performance of the DOC controller when the modulation by the feeding flow
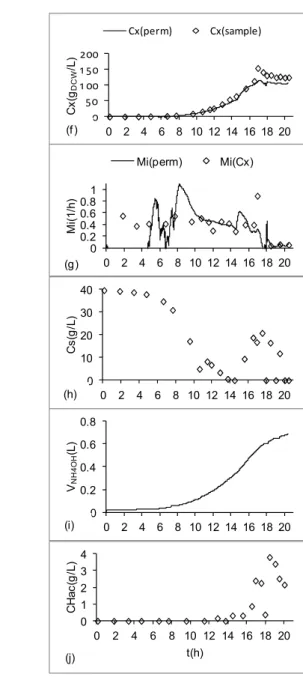
rate was activated. Shortly before 18 h of cultiva-tion, Figures 8(a) and 8(c) show that both the oxygen flow rate and the stirring speed were at their upper limits. In spite of this, the DOC (Fig. 8(d)) presented a decreasing profile. At this moment, the controller automatically reduced the feeding flow rate to de-crease the growth rate and, consequently, oxygen consumption. The effects of the control action can also be seen in Figures 8(h) and 8(j): substrate and acetate accumulation profiles (between 14 and 18 h) were reverted after the feeding was slowed down. The combined controller performance was satisfac-tory and DOC was kept between 10 and 40 % of saturation throughout the cultivation.
Looking at Figure 8(f), we observe that the per-mittivity estimated concentration matched perfectly to the off-line biomass concentration points (dry weight measurements) up to the moment of induc-tion. After the inducer is added, the viability de-crease was depicted by the permittivity data, but not by the off-line biomass concentration measurements, as discussed previously. The cumulative alkali con-sumption (Fig. 8(i)) for pH control also showed a close correlation with biomass concentration. The pH remained at the desired set-point throughout the experiment, with slightly higher values after induc-tion (Figure 8e).
Concerning the specific growth rate (μ) esti-mated from permittivity data (Figure 8(g)), the os-cillatory behavior registered up to ~ 7.5 h was related mainly to the low resolution of the permittivity measurements (Horta et al., 2012). After the induc-tion, a sharp decrease of μ and a gradual increase of substrate concentration were observed as conse-quences of the cell metabolic effort to produce the heterologous protein.
0 100 200 300 400 500 600 700
0 10 20 30 40 50 60 70 80
0 10 20 30
A
g
it
(rp
m
)
DOC
t (h) DOC(%sat) Agit(rpm)
(a)
0 1 2 3 4 5
0 10 20 30
Q
A
ir
, Q
O
2
(
L
/m
in
)
t (h)
QAir(L/min) QO2(L/min)
(b)
Figure 7: Fed-batch cultivation of rE. coli BL21(DE3) expressing a fragment of PspA3 antigenic protein, using lactose as inductor added by a pulse at 29.4h. Culture carried out with modified HDF medium using glycerol as carbon source, at 30 °C (Sargo, 2011); (a) Stirrer speed (Agit -rpm), dissoved oxygen concentration (DOC - % saturation); (b) Air flow rate (QAIR – L/min), oxygen flow rate (QO2 – L/min) and stirrer speed. Induction:
0 2 4 6
0 2 4 6 8 10 12 14 16 18 20
Q (
L
/m
in
)
Q_air Q_O2
(a)
0 0.1 0.2 0.3 0.4 0.5 0.6 0.7 0.8
0 2 4 6 8 10 12 14 16 18 20
F
(L/
h)
(b)
0 200 400 600 800 1000
0 2 4 6 8 10 12 14 16 18 20
A
g
it
(rp
m
)
(c)
10 20 30 40
0 2 4 6 8 10 12 14 16 18 20
DO
C
(%
s
a
t)
(d)
2 3 4 5 6 7
0 2 4 6 8 10 12 14 16 18 20
pH
(e)
0 50 1 00 1 50 200
0 2 4 6 8 10 12 14 16 18 20
Cx
(g
DCW
/L
)
Cx(perm) Cx(sample)
(f )
0 0.2 0.4 0.6 0.81
0 2 4 6 8 10 12 14 16 18 20
Mi
(1
/h
)
Mi(perm) Mi(Cx)
(g)
0 10 20 30 40
0 2 4 6 8 10 12 14 16 18 20
Cs
(g
/L
)
(h)
0 0.2 0.4 0.6 0.8
0 2 4 6 8 10 12 14 16 18 20
VNH4
O
H
(L
)
(i)
0 1 2 3 4
0 2 4 6 8 10 12 14 16 18 20
CH
a
c
(g
/L
)
t(h) (j)
Figure 8: Typical time profiles of stirring speed, feed flow rate, air and oxygen flow rates and other variables for the combined DOC control. Fed-batch cultivation of rE. coli BL21(DE3) expressing a fragment of PspA3 antigenic protein. Culture carried out with modified HDF medium using glycerol as carbon source, at 30 ºC (Sargo, 2011). (a) air and oxygen flow rates in L/min; (b) feed flow rate in L/min; (c) stirrer speed in rpm; (d) dissolved oxygen concentration as % of saturation; (e) pH; (f) biomass concentration on-line estimated from permittivity data and measured off-line by dry weight method; (g) on-line specific growth rate inferred from both permittivity data and dry weight measurements; (h) substrate concentration (glycerol); (i) cumulative volume of NH4OH added; (j)
acetate concentration in g/L. Induction with IPTG at 16.5 h (Horta et al., 2012); K = 0.8 (Figure 2).
SuperSys_HCDC and Overall Process Performance
The cultivation performance was influenced by the software functions. Table 1 shows some of the key
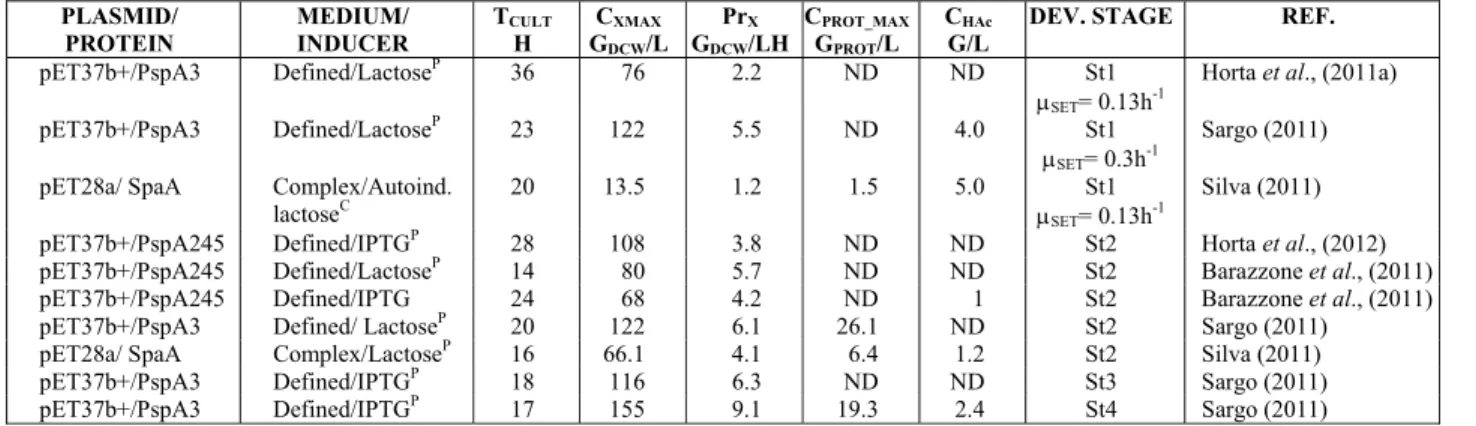
Table 1: Cultivations performed under the supervision of SUPERSYS_HCDC at different development stages. Microorganism rE. coli BL21(DE3). PrX – biomass productivity; CPROT_MAX – concentration of recombi-nant protein; Tcult – cultivation time; CHAc – max acetic acid concentration; Dev. Stage – stage of software development: St1- Feed flow control with fixed μSET;St2- Feed flow control with dynamic μDYN;St3- Feed flow control with dynamic μDYN, m and YXS; St4- Feed flow control with dynamic μDYN, m and YXS, and restrictions by DOC.
PLASMID/ PROTEIN
MEDIUM/ INDUCER
TCULT
H
CXMAX
GDCW/L
PrX
GDCW/LH
CPROT_MAX
GPROT/L
CHAc
G/L
DEV. STAGE REF.
pET37b+/PspA3 Defined/LactoseP 36 76 2.2 ND ND St1
μSET= 0.13h-1
Horta et al., (2011a)
pET37b+/PspA3 Defined/LactoseP 23 122 5.5 ND 4.0 St1
μSET= 0.3h-1
Sargo (2011)
pET28a/ SpaA Complex/Autoind. lactoseC
20 13.5 1.2 1.5 5.0 St1
μSET= 0.13h-1
Silva (2011)
pET37b+/PspA245 Defined/IPTGP 28 108 3.8 ND ND St2 Horta et al., (2012) pET37b+/PspA245 Defined/LactoseP 14 80 5.7 ND ND St2 Barazzone et al., (2011) pET37b+/PspA245 Defined/IPTG 24 68 4.2 ND 1 St2 Barazzone et al., (2011) pET37b+/PspA3 Defined/ LactoseP 20 122 6.1 26.1 ND St2 Sargo (2011) pET28a/ SpaA Complex/LactoseP 16 66.1 4.1 6.4 1.2 St2 Silva (2011)
pET37b+/PspA3 Defined/IPTGP 18 116 6.3 ND ND St3 Sargo (2011)
pET37b+/PspA3 Defined/IPTGP 17 155 9.1 19.3 2.4 St4 Sargo (2011)
*ND: not detected. P – induction by pulse addition; C – inducer continuously supplied.
As can be seen in Table 1, the software was validated for cultivations carried out with different medium formulations (complex/defined), inducers (IPTG/lactose) and inducing strategies (pulse/con-tinuous). Increasing biomass productivity with soft-ware evolution was observed. In addition, more ad-vanced strategies (1 to 4) helped to reduce the forma-tion of acetate. There was also an increase in the production of recombinant protein, mainly due to implementation of a feed flow rate control matching the actual cell growth rate (Horta et al., 2012).
CONCLUSIONS
The adequate control, monitoring and supervision of a bioprocess is an important step to achieve batch to batch reproducibility and quality control high standards, as well as more robust and cost effective processes, less prone to human errors. These issues are crucial for the production of biopharmaceuticals and are present in both FDA and GMP regulations.
In this work, the development of the automatic supervision and control tool SUPERSYS_HCDC is presented and discussed. The tool includes several up-to-date functionalities, such as: automatic com-bined control of the DOC; automatic start-up of the feed pump; remote access and warning system by voice alarms or SMS messages. It was set-up in the LabView environment, enabling a user-friendly interface, with flexibility of choices by the operator for all tasks. Its modular structure also facilitates the
inclusion of new functionalities. In the latest version (St5 – not included here), growth rate modulation for DOC control can also be performed by automatic temperature reduction. Furthermore, a new version of the tool (St6) for supervision and control of airlift bioreactors is under development.
The tool was designed to be used as support in HCDC of rE. coli and, so far, it has been extensively tested in 22 fed-batch cultures of 5 different recom-binant strains of this bacterium. But it has also been used to supervise batch and fed-batch cultures of other industrially important microorganisms like Pichia pastoris, Bacillus subtilis, Bacillus megaterium and
Saccharomyces cerevisiae.
The tool proved to be extremely useful for correctly running long lasting (~ 40 h) HCDC, when the bioreactor was operated by several users with different practice skills. Important decisions such as the right moment for starting the feed pump, the oxygen and air flow rates to be used, and suitable feeding profiles could be left to the tool.
In the specific case of HCD cultures of rE. coli, the tool showed a reliable performance when con-trolling the DOC and the nutrient supply, even considering the high level of difficulty imposed by the high biomass concentrations and the metabolic drifts triggered by heterologous protein synthesis. It certainly contributed to achieve a biomass concentra-tion of 155 gDCW/L in only 17 h of culture, leading to
a maximum cell productivity of 9.2 gDCW.L-1.h-1.
ACKNOWLEDGEMENTS
The authors would like to thank the São Paulo Research Foundation (FAPESP) and Brazilian Federal Agency for Support and Evaluation of Graduate Education (CAPES) for funding this work, and Tiago Martins Pereira and Amadeus Gomes de Azevedo for technical support.
NOMENCLATURE
CS Substrate concentration g/L
CS0 Substrate concentration in the
feeding medium
g/L
CSR Residual substrate concentration g/L
CX Cellular concentration g/L
CX0 Cellular concentration (g/L) in
the beginning of the feeding stage
F Feeding rate L/h
m Maintenance coefficient gX/gS.h
t Time
T Temperature °C or K
V0 Volume of cultivation medium
at the beginning of feeding stage
L
YXS Yield coefficient gX/gS Greek Letters
μDYN Dynamic specific growth rate
on-line estimated
h-1 μ or mi Specific growth rate h-1 μCRIT Critical specific growth rate h
-1
μMAX Maximum specific growth rate h -1
μSET Specific growth rate limited by
the fed flow rate
h-1
Abbreviations
AI Artificial Intelligence HCDC High Cell Density Cultivation SMA Smoothed Moving Average
OD Optical Density 600 nm DCW Dry Cell Weight
DOC Dissolved Oxygen Concentration
% of saturation
REFERENCES
Babaeipour, V., Shojaosadati, S. A., Robatjazi, S. M., Khalilzadeh, R., Maghsoudi, N., Over-production
of human interferon-y by HCDC of recombinant
Escherichia coli. Process Biochemistry, 42, 112-117 (2007).
Barazzone, G. C., Carvalho, R. Jr., Kraschowetz, S., Horta, A. C. L., Sargo, C. R., Silva, A. J., Zangirolami, T. C., Goulart, C., Leite, L. C. C., Tanizaki, M. M., Gonçalves, V. M., Cabrera-Crespo, J., Production and purification of recombinant fragment of pneu-mococcal surface protein A (PspA) in Escherichia coli. Procedia in Vaccinology, 4, 27-35 (2011). Carvalho, R J., Cabrera-Crespo, J., Tanizaki, M. M.,
Gonçalves, V. M., Development of production and purification processes of recombinant fragment of pneumococcal surface protein A in Escherichia coli using different carbon sources and chroma-tography sequences. Appl. Microbiol. and Biotech-nol., 94(3) 683-694 (2012). DOI: 10.1007/s00253-011-3649-9.
Dabros, M., Schuler, M. M., Marison, I. W., Simple control of specific growth rate in biotechnological fed-batch processes based on enhanced online measurements of biomass. Bioprocess Biosyst. Eng., 33, 1109-1118 (2010).
Davey, H. M., Davey, C. L., Woodward, A. M., Edmonds, A. N., Lee, A. W., Kell, D. B., Oscilla-tory, stochastic and chaotic growth rate fluctua-tions in permittistatically controlled yeast cultures. Biosystems, 39, 43-61 (1996).
Demain, A. L., Vaishnav, P., Production of recombi-nant proteins by microbes and higher organisms. Biotech. Advances, 27, 297-306 (2009).
Eiteman, M. A., Altman, E., Overcoming acetate in
Escherichia coli recombinant protein fermenta-tions. Trends in Biotechnology, 24(11), 530-536 (2006).
Henry, O., Kamen, A., Perrie, M., Monitoring the physiological state of mammalian cell perfusion processes by on-line estimation of intracellular fluxes. Journal of Process Control 17, 241-251 (2007).
Horta, A. C. L., Silva, A. J., Sargo, C. R., Gonçalves, V. M., Zangirolami, T. C., Giordano, R. C., Ro-bust artificial intelligence tool for automatic start-up of the sstart-upplementary medium feeding in re-combinant E. coli cultivations. Bioprocess Biosyst. Eng., 34(7), 891-901 (2011a).
Horta, A. C. L., Zangirolami, T. C., Giordano, R. C., Cruz, A. J. G., Reis, G. B., Jesus, C. D. F., Super-visory system for bioreactor high cell density cultivations. Registered Software, Process Num-ber 11008-6, RPI 2115, INPI, Brazil (2011c). Horta, A. C. L., Sargo, C. R., Silva, A. J., Gonzaga, M.
C., Santos, M. P., Gonçalves, V. M., Zangirolami, T. C., Giordano, R. C., Intensification of high cell-density cultivations of rE. coli for production of S. pneumoniae antigenic surface protein, PspA3, using model-based adaptive control. Bioprocess Biosyst. Eng., 35(8), 1269-1280 (2012).
Kilikian B. V., Suárez I. D., Liria C. W., Gombert A. K, Process strategies to improve heterologous protein production in Escherichia coli under lac-tose or IPTG induction. Process Biochemistry, 35, 1019-1025 (2000).
Korz, D. J., Rinas, U., Hellmuth, K., Sanders, E. A., Deckwer, W. D., Simple fed batch technique for high cell density cultivation of Escherichia coli. Journal of Biotechnology, 39, 59-65 (1995). Kuprijanov, A., Gnoth, S., Simutis, R., Lübbert, A.,
Advanced control of dissolved oxygen concentra-tion in fed batch cultures during recombinant protein production. Appl. Microbiol. Biotechnol., 82, 221-229 (2009).
Lee, S. Y., High cell density culture of Escherichia coli. TIBTECHT 14, 98-105 (1996).
Liljeqvist, S., Stahl, S., Production of recombinant subunit vaccines: Protein immunogens, live deliv-ery systems and nucleic acid vaccines. J. Bio-technol., 73, 1-33 (1999).
Markx, G. H., Davey, C. L., The dielectric properties of biological cells at radio frequencies: Applica-tions in biotechnology. Enzym. Microb, Technol. 25, 161-171 (1999).
Matanguihan, R. M., Konstantinov, K. B., Yoshida, T., Dielectric measurement to monitor the growth and the physiological state of biological cells. Bioprocess Engineering, 11, 213-222 (1994). Montes, T., Grazú, V., López-Gallego, F., Hermoso, J.
A., Garcia, J. L., Manso, I., Galán, B., González, R., Fernandez-Lafuente, R., Guisán, J. M., Ge-netic modification of the Penicillin G Acylase surface to improve its reversible immobilization on ionic exchangers. Applied and Environmental Microbiology, 73, 312-319 (2007).
Nielsen, J., Villadsen, J., Lidén, G., Bioreaction En-gineering Principles, 2nd Edition. New York, Kluwer Academic/Plenum Publishers (2002).
Rocha, I. C. A. P., Model-based strategies for com-puter-aided operation of recombinant E. coli fer-mentation. PhD Thesis, em Eng. Quím. e Biológ., Escola de Eng., Universidade do Minho (2003). Sargo, C. R., Aperfeiçoamento de Cultivos de Alta
Densidade Celular de rE.coli Utilizando Glicerol Como Fonte de Carbono. Dissertation, Universi-dade Federal de São Carlos (2011). (In Portuguese). Seborg, D. E., Edgar, T. F., Mellichamp, D. A.,
Process Dynamics and Control. 2nd Edition. New Jersey, John Wiley and Sons, Inc. (2004).
Seeger, A., Schneppe, B., McCarthy, J. E. G., Deckwer, W. D., Rinas, U., Comparison of tempera-ture- and isopropyl-P-D-thiogalacto-pyranoside-in-duced synthesis of basic fibroblast growth factor in high-cell-density cultures of recombinant Es-cherichia coli. Enzyme and Microbial Technol-ogy, 17, 947-953 (1995).
Shiloach, J., Fass, R., Growing E. coli to high cell density: A historical perspective on method de-velopment. Biotech. Adv., 23, 345-357 (2005). Silva, A. J., Vacinas Recombinantes Contra Erisipela
Suína: Desenvolvimento Integrado de Biopro-cesso, da Biologia Molecular ao Biorreator, The-sis, Universidade Federal de São Carlos (2011). (In Portuguese).
Silva, A. J., Iemma, M. R. C., Horta, A. C. L., Sargo, C. R., Giordano, R. L. C., Giordano, R. C., Zangirolami, T. C., Novo, M. T. M., Cloning, Auto-induction Expression, and Purification of rSpaA Swine Ery-sipelas Antigen. Current Microbiology, 65(4), 369-374 (2012).
Studier, F. W., Protein production by auto-induction in high-density shaking culture. Protein Express Purif., 41, 207-234 (2005).
Suárez, D. C., Kilikian, B. V., Acid acetic accu-mulation in aerobic growth of recombinant E. coli. Process Biochemistry, 35, 1051-1055 (2000). Tibayrenc, P., Preziosi-Belloy, L., Ghommidh, C.,
Online monitoring of dielectrical properties of yeast cells during a stress-model alcoholic fer-mentation. Process Biochemistry, 46, 193-201 (2011).
Tripathi, N. K., Sathyaseelan, K., Jana, A. M., Rao, P. V. L., High yield production of heterologous proteins with Escherichia coli, Defence Science Journal, 59(2), 137-146 (2009).