*e-mail: [email protected]
1. Introduction
Peritectic solidiication has attracted more attention in experimental and theoretical studies1 since many technologically important materials are peritectic, such as Sn–Cd2,3, Sn–Sb4,5, Sn-Ag6, Sn–Bi–Zn7, Zn–Cu8,9, Zn–Ag10 lead-free soldering materials, high temperature intermetallics Ti–Al11, Ni–Al12, HF–B13, superconducting materials YBCO14, magnetic materials Nd–Fe–B15, and structural materials Fe–Ni16,17 and Fe–Cr–Ni18. Many interesting microstructures have been found during directional solidiication of peritectic alloys, which have drawn much attention since the last four decades4. In the solidiication of these alloys, a dendrite structure is the commonly encountered pattern. The microstructural scales involving the primary dendrite arm spacing (PDAS) and the secondary dendritic arm spacing (SDAS) have been carried out in directional solidiication of various peritectic alloys, including Pb–Bi19, Zn–Cu19 and Nd–Fe–B20. In fact, PDAS and SDAS in the solidiication microstructure determine the inal physical properties of peritectic alloys. Therefore, it is of great signiicance to control the peritectic solidiication by different techniques (Bridgman method6,7, Forced Crucible Rotation21, Bridgman-Stockbarger22, Ultrasonic Vibration 5,23, Temperature Gradient Zone Melting24).
Tin–antimony alloys are important materials in the industry for their use in die casting alloys, high temperature lead–free solders, manufacture of cable sheathing and battery grids, and in manufacturing acidic accumulators25,26. It is usually
applied in the industry as a sliding material such as the bearing babbit alloy. The Sn-Sb peritectic alloy has widespread applications, and is valuable in the industry27. Recently, the study by Rosa et al.,28 has shown that improvement in cell size and corrosion resistance depends on the cooling rate imposed during directional solidiication of the Sb–Pb alloy.
The investigations of mechanical properties of Sn–Sb alloys are crucial for many industrial applications. However, the effects of growth velocity on the microstructure and mechanical properties of the Sn–10.2 Sb peritectic alloy have not been investigated in a systematic manner. Therefore, the aim of the present work is to study the effect of growth velocity on PDAS, SDAS, microhardness (HV),
and compressive strength (σc) for a directionally solidiied
Sn–10.2 Sb peritectic alloy using the Bridgman method at a constant temperature gradient (G=4.5 K. mm-1), and to compare the results with the previous experimental results for similar alloy systems.
2. Experimental Procedure
2.1. Alloy preparation, directional solidiication
and metallographic processes
The master alloy Sn–10.2 Sb (all compositions are in wt.% unless otherwise noted) was prepared by melting weighed
quantities of (≥99.99 wt.%) Sn and (≥99.99 wt.%) Sb metals in a graphite crucible (170 mm length, 30 mm inner diameter,
Microstructural Evolution and Mechanical Properties in Directionally Solidiied Sn–10.2 Sb
Peritectic Alloy at a Constant Temperature Gradient
Elif Yılmaza, Emin Çadırlıb*, Emine Acerc, Mehmet Gündüzd
aKayseri Vocational High School, Erciyes University, Kayseri, Turkey bDepartment of Physics, Faculty of Arts and Sciences, Niğde University, Niğde, Turkey
cDepartment of Physics, Institute of Science, Erciyes University, Kayseri, Turkey
dDepartment of Physics, Faculty of Sciences, Erciyes University, Kayseri, Turkey
Received: February 6, 2015; Revised: October 20, 2015; Accepted: December 22, 2015
The Sn–10.2 Sb (mass fraction) peritectic alloy was prepared using a vacuum melting furnace and a hot illing furnace. The samples were directionally solidiied upwards at steady state conditions with a constant temperature gradient (G=4.5±0.2 K. mm-1) under different growth velocities
(V=13.3–266.7 µm. s-1) in a Bridgman-type directional solidiication apparatus. The effects of the growth velocity (V) on the dendritic spacings were investigated. Primary dendrite arm spacing (PDAS)
of α phase in directionally solidiied Sn–10.2 Sb peritectic alloy was measured on the longitudinal and transverse sections of 4 mm diameter cylindrical samples. Secondary dendrite arm spacing (SDAS) was measured on the longitudinal section. The experimental results show that the measured PDAS (λ1L, λ1T) and SDAS (λ2) decrease with increasing growth velocity. The dependence of PDAS, SDAS,
microhardness (HV) and compressive strength (σc) on the growth velocity were determined by using
a linear regression analysis. The experimental results were compared with the previous experimental results and the results of the experimental models.
Keywords: Solidiication, Microstructure, Dendrite arm spacings, Peritectic alloy, Microhardness,
and 40 mm outer diameter), which was placed in a vacuum melting furnace, and the metals were completely melted, taking into account the phase diagram29 as shown Figure 1. After allowing time for the melt to become homogeneous, the molten master alloy was stirred and quickly poured into the graphite crucibles (ID: 4 mm, OD: 6.4 mm and L: 200 mm) which were placed in a hot illing furnace and then lowered to the cold region of the furnace. The samples were directionally frozen from the bottom to the top to ensure that the samples were full to the brim. One of the
prepared samples was positioned in a Bridgman–type furnace. After stabilizing the thermal conditions in the furnace under an argon atmosphere, the sample was withdrawn downwards by approximately 90–100 mm with a known pulling rate by means of a synchronous motor and the sample rapidly quenched. The block diagram of the experimental set up is shown in Figure 2. Samples were solidiied under steady state conditions with different V (13.3–266.7 µm. s-1) at a constant G (4.5 K. mm-1) in order to investigate the effect
of V on PDAS, SDAS, HV and σc.
Figure 1. The Sn-Sb phase diagram29
2.2. Measurement of solidiication processing
parameters (G and V)
The temperature of the Bridgman–type furnace was controlled by a 0.5 mm insulated K-type thermocouple placed between the heating element and alumina tube. The temperature could be controlled to about ±0.1 K during the run. Three insulated K–type 0.5 mm diameter thermocouples with known distances were placed in alumina crucibles which were parallel to the direction of heat low inside the graphite cylinder (see Figure 2). All of the leads were connected to a data logger interfaced with a computer and the temperature data recorded simultaneously. When the third thermocouple was at the solid–liquid interface and then the irst and the second thermocouples in the liquid, their temperatures were used to obtain the temperature gradient
G. G was also obtained from the recorded cooling rates (T. = G V). Both results were similar. G could be kept constant
during the run by keeping the temperature of the cooler part and the hotter part of the furnace constant, and the distance between them stable. The positions of the thermocouples were measured by electronic calipers having an accuracy of ±0.02 mm after quench. Careful experimental measurements showed that the pulling rates of the samples were equal to the value of the growth velocities30. The solidiication time and solidiied distance were also measured for the run and their ratio gives the growth velocity. The error in the G and V
measurements has been calculated to be about 4%.
2.3. Metallographic examination
The unidirectionally grown quenched sample was removed from the alumina crucible, then ground to observe the solid-liquid interface. The longitudinal section of the sample (10 mm), which included the quenched interface, was separated from the sample and set in the cold mounting resin. The longitudinal and transverse sections of this part were ground and polished using diamond paste to a 1 µm inish and etched within the solution of 100 ml H2O and 10 g CrO3 to reveal the microstructure. The microstructures of the samples were investigated by using Olympus BH–2 optical microscopy with LG Honeywell CCD camera.
2.4. Measurement of primary and secondary
dendrite arm spacing
The primary dendrite arm spacing, PDAS (λ1), was
measured on the longitudinal and transverse sections of each sample by using the linear intercept method30-32. In the linear intercept method, λ1L is obtained on the longitudinal
section by measuring the distance between adjacent dendrite tips. Although λ1 is independent of the distance behind the
quenched interface, to be more precise, the λ1T measurements
on the transverse sections were taken on the plane ≤ 500 µm just behind the tips. The total 50–250 λ1 were measured using
the mean linear intercept method on the longitudinal and transverse sections, depending on the growth conditions. The secondary dendrite arm spacing λ2 was measured on the
longitudinal sections of the samples from the initial adjacent side branches of primary dendrites. Values of λ2 data reported
here were averaged over the 25–50 λ2 measurements depending
on the growth conditions. It has been found that a standard deviation is approximately 5% for λ1 and λ2 measurements.
2.5. Measurement of microhardness (HV) and
compressive strength (σ
c)
Microhardness measurements in the present work were made with a DuraScan 20 semiautomatic Microhardness test device using a 300 g load and a dwell time of 10 s. Ten measurements were taken from the longitudinal and transverse sections of each sample. The average values were calculated from these microhardness values. Some errors were inevitable during the microhardness measurements. These errors were owing to factors such as surface quality, inhomogeneities in the microstructure, and the ambiguity of the traces. The error in the microhardness measurements has been calculated to be approximately 5%.
The measurements of the compressive tensile strength were made at room temperature with a Shimadzu AG-IS universal testing machine. Cylindrical compressive test samples with a diameter of 4 mm and gauge length of 6 mm were prepared from the directionally solidiied rod samples under different growth velocities. The compressive axis was parallel to the growth direction of the sample. The compressive tests were repeated three times and the average value was taken. It has been found that the standard deviation was approximately 5%.
3. Results and Discussion
3.1. Composition analysis of the phases (EDS
Analysis)
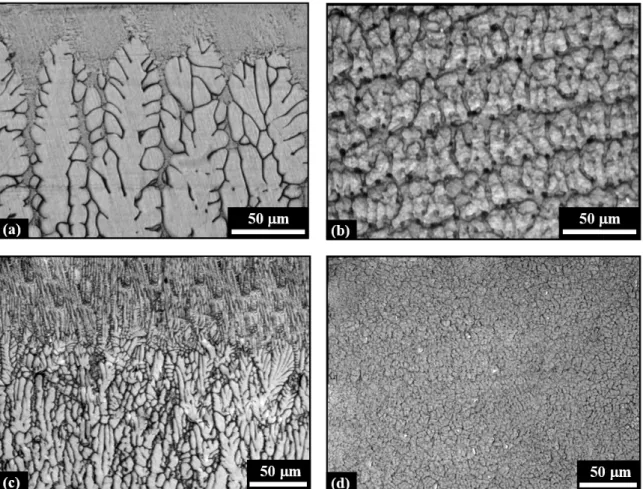
EDS analysis was performed to determine the composition of the phases in the Sn–10.2 Sb (mass fraction) peritectic alloy at 20 keV using X-ray lines. According to the EDS analysis results shown in Figure 3, three different phases (dark gray quenched liquid phase, light gray dendritic matrix phase, and white SnSb intermetallic phase) grew during the directional solidiication of Sn–10.2 Sb alloy. The composition of the dendritic matrix phase (β–Sn) was Sn–10.16 Sb (wt.%), and that of the dark gray quenched liquid phase was Sn–6.39 Sb (wt.%). Also, the white phase (SnSb intermetallic phase) was Sn–43.76 Sb (wt.%). These determined compositions are very close to values of nominal compositions (Figure 1).
3.2. The effect of growth velocity on dendritic
spacings
The Sn–10.2 Sb peritectic alloy was directionally solidiied at steady state conditions with different growth velocities
(V=13.3–266.7 µm. s-1) at a constant temperature gradient
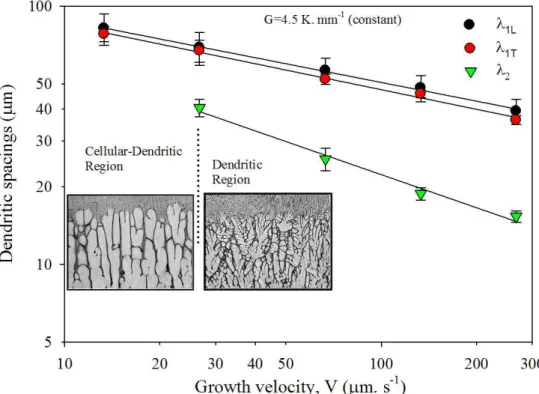
(G =4.5 K. mm-1). The optical micrographs of longitudinal and transverse sections of the directionally solidiied Sn–10.2 Sb peritectic alloy prepared under different solidiication parameters are given in Figure 4. As seen in Figure 4, the microstructure is dendritic form. The PDAS was measured from the longitudinal and transverse sections and SDAS was measured from the longitudinal section of the samples grown at different V. As seen in Figure 5, an increase in
the λ 1L value decreased from 82.1 to 39.3 µm and the λ1T
value decreased from 78.1 to 36.2 µm. Similarly, when the growth velocity was increased from 26.7 to 266.7 µm. s-1, the λ2 value decreased from 40.4 to 15.3 µm. Secondary dendrite
arms were not observed for 13.3 µm. s-1 growth velocity, because the microstructure is cellular or cellular–dendritic
(see Figure 4). The dependency of λ1 and λ2 on V was determined
by a linear regression analysis. From the experimental results, the relationship between microstructure parameters (λ1, λ2)
and growth velocity (V) can be established as follows:
a 1L k V1
λ = − (1a)
b 1T k V2
λ = − (1b)
c 2 k V3
λ = − (2)
where a, b and c are exponent values for the growth velocity,
and k1, k2 and k3 are constants which can be experimentally
determined. According to Eqs. (1) and (2), PDAS and SDAS change with the growth velocity. The exponent values (a, b) of V were found to be 0.24 and 0.25 for λ1
values obtained from longitudinal and transverse sections of samples respectively. Similarly, the exponent value (c) of V
found to be 0.46 for λ2 value was obtained from longitudinal
sections of samples. The exponent values (a, b and c) and
experimental constants (k1, k2 and k3) are given in Table 1.
The exponent values (0.24 and 0.25) of λ1 are in agreement
with the values 0.25, 0.23, 0.27, 0.26, 0.25 and 0.28 obtained
by Yang et al.33, Lapin et al.34, Kloosterman and Hosson35, Pryds et al.36, Gündüz et al.37, and Şahin et al.38 respectively. These exponent values are also in agreement with the value 0.25 predicted by Hunt39, Kurz,Fisher40 and Trivedi41 theoretical models for steady state conditions. On the other hand, our exponent values (0.24 and 0.25) are less than the values of 0.40 and 0.41 obtained by Miyata et al.42 and Jesse,Giller43 and also the 0.50 predicted by Kurz et al., 44 numerical models for dendritic spacings. This discrepancy might be due to rapid solidiication conditions for the numerical model44, because under rapid solidification conditions, m (liquidus slope) and k (distribution coeficient)
cannot be constant and k becomes a function of growth velocity.45 As can be seen from the theoretical and numerical models, coeficients of λ1 and λ 2 are functions of m and k. Thus, the rapid solidiication and unsteady conditions cannot apply to steady state conditions case.
The exponent value (0.46) of λ2 is in good agreement
with the values 0.42 and 0.47 obtained by Şahin et al.38 and Kaya et al.46 respectively. In the present work, the λ
2 values
experimentally obtained as a function of growth velocity have been compared with the values of λ2 calculated from
the Trivedi–Somboonsuk47 and the Bouchard–Kirkaldy48,49 models. Our experimental values agree with the calculated
Figure 4. Microstructures of the directionally solidiied Sn–10.2 Sb peritectic alloy: (a) longitudinal section; (b) transverse section (G=4.5
K. mm-1, V = 26.7 µm. s-1); (c) longitudinal section; (d) transverse section (G=4.5 K. mm-1, V = 266.7 µm. s-1)
Table 1. The relationships between the dendritic spacings (λ1, λ2), mechanical properties (HVL, HVT, σc) and the growth velocity (V)
Relationship Constant (k) Correlation coeficient (r)
λ1L = k1V
-0.24 λ1T = k2V
-0.25 λ2= k3V
-0.46
HVL=k4 V
-0.09
HVT=k5 V
-0.08 σc=k6 V-0.10
k1=153.7 (µm1.24. s-0.24) k2=152.3 (µm1.25. s-0.25) k3=158.5 (µm1.43. s-0.43) k4=25.6 (kg. mm-2.09. s-0.09) k5=23.3 (kg. mm-2.08. s-0.08) k6=63.1 (MPa. µm0.10. s-0.10)
r1 = -0.998
r2 = -0.997
r3 = -0.994
r4 = -0.991
r5 = -0.996
r6 = -0.978
λ1L: the values of the PDAS measured from the longitudinal section of the samples; λ1T: the values of the PDAS measured from the transverse section of the samples; λ2: the values of the SDAS measured from the longitudinal section of the samples; HVL: the values of the microhardness measured from the longitudinal section of the samples; HVT: the values of the microhardness measured from the transverse section of the samples; σc: the values of the
values of λ2 from the Trivedi–Somboonsuk steady state model47 as a function of (V)0.5. In contrast, the calculated values of λ2 with the Bouchard–Kirkaldy unsteady state model48,49 as a function of V 0.67 do not agree with our experimental values. There is a clear difference between the exponent values obtained in the Trivedi–Somboonsuk and the Bouchard–Kirkaldy models. Briely, the results of our experiments (which were carried out under steady state conditions), agree with the results of the steady state
theoretical models.
3.3. The Effect of growth velocity on
microhardness and compressive strength
The high microhardness and compressive strength are reported to arise from the dendritic matrix due to Hall–Petch-type mechanism50,51. The Hall–Petch-type relationships between the growth velocity (V) and mechanical properties (HV, σc),
can be expressed as follows,
d
L 4
HV =k V− (3a)
e
T 5
HV =k V− (3b)
f c k V6 σ = − (4)
where d, e and f are the exponent values relating to the V and the k4, k5 and k6 are constants which can be experimentally
determined (Table 1). According to Eqs. (3) and (4), the microhardness and compressive strength change with
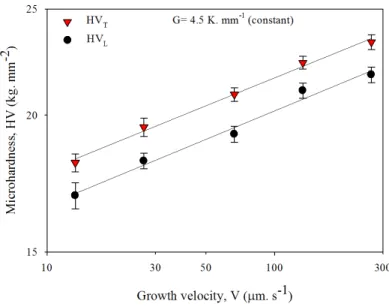
the growth velocity. At a constant temperature gradient (4.5 K/mm), an increase in the growth velocity resulted in increased microhardness (Figure 6). When the growth velocity was increased from 13.3.3 to 266.7 µm. s-1, the HVL increased from 16.8 to 21.7 kg. mm
-2 and the HV T increased from 18.1 to 23.3 kg. mm-2. The exponent value of V (0.08) obtained from this study as a function of HV is in agreement with the values of 0.06, 0.06, 0.07 and 0.09 reported by Çadırlı et al.52 for Sn-23Bi- 5Zn (wt%) alloy, by Hu et al.53 for Sn-58 wt% Bi eutectic alloy, by Vnuk et al.54 for Sn–Zn eutectic alloy, and by Böyük and Maraşlı55 for Sn-3.5Ag-0.9Cu (wt%) eutectic alloy respectively. The exponent value of V (0.08) is slightly lower than the values of 0.11 reported by Hu et al.56 for Sn-1.0 wt% Cu.
As seen in Figure 7(a), compressive strength (σc)
values increased with increasing V, but strain (%) values decreased. The maximum compressive strength of studied alloy reaches 107 MPa (Figure 7(b)). The factor responsible for higher compressive strength in the investigated alloys is ineness of the dendritic and SnSb intermetallic phases. Similar trends were observed by some researchers for different multicomponent alloys57-59. It can be seen from these igures that the σc values increased by approximately 36% with
increasing V for the studied alloy. The exponent value of V is equal to 0.10. This exponent value is smaller than the values of 0.20 and 0.23 obtained by Siewert et al.,60,61 for some soldering alloys. These discrepancies are due to factors such as composition, temperature gradient, microsegregation and presence of intermetallic phases.
4. Conclusions
In this work, microstructural properties of the directionally solidiied Sn–10.2 Sb peritectic alloy were investigated. The results are summarized as follows:
(1) The effects of growth velocity on PDAS and SDAS were investigated. Increasing of growth velocity was observed to result in iner microstructures.
(2) Experimental relationships 0 24.
1L k V1 λ = − ,
.
0 25 1T k V2
λ = − and 0 46.
2 k V3
λ = − show that the
dependency of the λ2 on growth velocity is stronger
than λ1.
(3) The exponent values (0.24 and 0.25) obtained in this experimental study for PDAS and SDAS are in agreement with the exponent value (0.25) predicted by theoretical models39-41,47 for the steady state
conditions. However , Kurz–Giovanola–Trivedi44 for rapid solidification conditions (for λ1) and
Bouchard–Kirkaldy models48,49 for the unsteady state conditions (for λ2) do not agree with the
experimental results.
(4) Increasing of growth velocity resulted in finer dendritic microstructures, thereby resulting in increased microhardness and compressive strength. The establishment of the relationships between HVL, HVT, σc and V have been obtained as HVL=k4V
-0.09, HVT=k5 V
-0.08 and σ c=k6V
-0.10
Acknowledgements
This project was inancially supported by the Erciyes University Scientiic Research Project Unit under contract No: FBT–07–18.
Figure 6. The variation of microhardness with growth velocity at a constant temperature gradient
References
1. Kerr HW, Kurz W. Solidification of peritectic alloys.
International Materials Reviews. 1996; 41(4):129−164. DOI: 10.1179/095066096790151231
2. Trivedi R, Park JS. Dynamics of microstructure formation in the two-phase region of peritectic systems. Journal of Crystal Growth. 2002;235(1-4):572−588.
3. Trivedi R, Shin JH. Modelling of microstructure evolution
in peritectic systems. Materials Science and Engineering A.
2005;413−414:288−295. DOI: 10.1016/j.msea.2005.09.027 4. Hu X, Li S, Liu L, Fu H. Microstructure evolution of directionally
solidified Sn-16%Sb hyperperitectic alloy. China Foundry.
2008;5:167−171.
5. Wei Z, Bingbo W. Peritectic solidification characteristics of Sb–Sn alloy under ultrasonic vibration. Materials Letters.
2015;138:1–4.
6. Şahin M, Çadırlı E. The effect of temperature gradient and growth rate on the microstructure of directionally solidified Sn-3.5Ag eutectic solder. Journal of Material Science: Materials in Electronics. 2012;23(2): 484−492.
7. Çadırlı E, Kaya H, Boyuk U, Maraşlı N. Effects of solidification parameters on the microstructure of directionally solidifed Sn-Bi-Zn lead-free solder. Metals and Materials International.
2012;18(2):349−354. DOI 10.1007/s12540-012-2021-7 8. Ma D, Li Y, Ng SC, Jones H. Unidirectional solidification
of Zn-rich Zn-Cu peritectic alloys-II. Microstructural length
scales. Acta Materialia. 2000;48:1741−1751. DOI: 10.1016/
S1359-6454(00)00003-3
9. Su Y, Wang M, Lin X, Huang W. Researches on lamellar structures in the unidirectional solidification Zn-2wt.%Cu peritectic alloy. Materials Letters. 2004;58(21):2670−2674.
10. Xu W, Ma D, Feng YP, Li Y. Observation of lamellar structure in a Zn-rich Zn-6.3at.%Ag hyper-peritectic alloy processed by rapid solidification. Scripta Materialia. 2001; 44(4):631−636.
11. Su Y, Liu C, Li X, Guo J, Li B, Jia J, Fu H. Microstructure selection during the directionally peritectic solidification of Ti-Al binary system. Intermetallics. 2005;13(3-4): 267−274.
12. Lee JH, Verhoeven JD. Peritectic formation in the Ni-Al system. Journal of Crystal Growth. 1994;144(3):353−366. DOI: 10.1016/0022-0248(94)90477-4
13. Gigolottia JCJ, Suzuki PA, Nunes CA, Coelho GC. Microstructural characterization of as-cast Hf–B alloys. Materials Research.
2012;15(2):185−190.
14. Rao Q, Fan X, Shu D, Wu CC. In-situ XRD study on the peritectic reaction of YBCO thin film on MgO substrate. Journal of Alloys and Compounds. 2008;461:L29−L33.
15. Zhong H, Li S, Lu H, Liu L, Zou G, Fu H. Microstructure evolution of peritectic Nd14Fe79B7 alloy during directional solidification.
Journal of Crystal Growth. 2008; 310(14):3366−3371.
16. Su Y, Guo J, Li X, Li S, Zhong H, Liu L, Fu H. Peritectic reaction and its influences on the microstructures evolution during directional solidification of Fe-Ni alloys. Journal of Alloys and Compounds. 2008;461:121−127.
17. Luo L, Su Y, Li X, Guo J, Yang HM, Fu H. Producing well aligned in situ composites in peritectic systems by directional solidification. Applied Physics Letters. 2008;92:061903. http:// dx.doi.org/10.1063/1.2841639
18. Fu JW, Yang YS, Guo JJ, Ma JC, Tong WH. Formation of a two-phase microstructure in Fe-Cr-Ni alloy during directional solidification. Journal of Crystal Growth. 2008;311(1): 132−136.
DOI: 10.1016/j.jcrysgro.2008
19. Ma D, Xu W, Ng SC, Li Y. On secondary dendrite arm coarsening in peritectic solidification. Materials Science and Engineering A. 2005;390:52−62.
20. Zhong H, Li S, Liu L, Lv H, Zou G, Fu H. Secondary dendrite arm coarsening and peritectic reaction in NdFeB alloys. Journal of Crystal Growth. 2008;311(2):420−424. DOI: 10.1016/j.
jcrysgro.2008.11.047
21. Biswas K, Hermann R, Wendrock H, Priede J, Gerbeth G, Buechner B. Effect of melt convection on the secondary dendritic arm spacing in peritectic Nd–Fe–B alloy. Journal of Alloys and Compounds. 2009;480(2):295–298.
22. Aguiar MR, Caram R. Directional solidification of a Sn-Se eutectic alloy using the Bridgman-Stockbarger method. Journal of Crystal Growth. 1996;166(1):398-401. DOI: 10.1016/0022-0248(95)00524-2
23. Zhai W, Hong ZY, Mei CX, Wang WL, Wei B. Dynamic solidification mechanism of ternary Ag–Cu–Ge eutectic alloy under ultrasonic condition. Science China Physic, Mechanics & Astronomy. 2013;56(2):462–473. DOI: 10.1007/s11433-013-5004-x
24. Liu D, Li X, Su Y, Peng P, Luo L, Guo J, et al. Secondary dendrite arm migration caused by temperature gradient zone melting during peritectic solidification. Acta Materialia.
2012;60(6-7):2679–2688.
25. Jiang Z, Lu Y, Zhao S, Gu W, Zhang Z. Effect of some elements on the performance of lead–antimony alloys for lead/acid batteries. Journal of Power Sources. 1990;31: 169−175.
26. Xie J, Zheng YX, Pan RJ, Liu SY, Song WT, Cao GS, et al. Sb-based alloy (NiSb, FeSb2) nanoparticles decorated graphene prepared by one-step solvothermal route as anode for Li-Ion batteries. International Journal of Electrochemical Science.
2011;6: 4811–4821. http://www.electrochemsci.org/papers/ vol6/6104811.pdf
27. Guan XF, Zhu DY, Chen LJ, Tang W. Rapid solidification of Sn-Sb peritectic alloy. The Chinese Journal of Nonferrous Metals. 2004;14:93−98.
28. Rosa DM, Spinelli JE, Osório WR, Garcia A. Effects of cell size and macrosegregation on the corrosion behavior of a dilute Pb–Sb alloy. Journal of Power Sources. 2006;162(1):696-705.
DOI: 10.1016/j.jpowsour.2006.07.016
29. Chen SW, Chen CC, Gierlotka W, Zi AR, Chen PY, Wu HJ. Phase equilibria of the Sn-Sb binary system. Journal of Electronic Materials, 2008;37(7):992−1002. DOI 10.1007/s11664-008-0464-x
30. Gündüz M, Çadırlı E. Directional solidification of aluminium-copper alloys. Materials Science and Engineering A.
2002;327(2):167−185.
31. Ourdjini A Liu J, Elliott R. Eutectic spacing selection in Al–Cu system. Materials Science and Technology. 1994;10(4):312−318.
32. Aker A, Kaya H. Measurements of microstructural, mechanical, electrical, and thermal properties of an Al–Ni alloy. International Journal of Thermophysics. 2013;34(2):267-283. DOI 10.1007/ s10765-013-1401-7
33. Yang S, Huang W, Lin X, Su Y, Zhou Y. On cellular spacing selection of Cu-Mn alloy under ultra-high temperature gradient and rapid solidification condition. Scripta Materialia.
2000;42:543−548.
34. Lapin J, Klimova A, Velisek R, Kursa M. Directional solidification of Ni-Al-Cr-Fe alloy. Scripta Materialia. 1997;37:85−91.
35. Kloosterman AB, Hosson JT. Cellular growth and dislocation structures in laser-nitrided titanium. Journal of Materials Science.
36. Pryds NH, Juhl TW, Pedersen AS. The solidification characteristics of laser surface-remelted Fe-12Cr-nC alloys. Metallurgical and Materials Transactions A. 1999;30(7): 1817−1826.DOI 10.1007/s11661-999-0180-z
37. Gündüz M, Kaya H, Çadırlı E, Maraşlı N, Keşlioğlu K, Saatçi B. Effect of solidification processing parameters on the cellular spacings in the Al-0.1wt %Ti and Al-0.5wt %Ti alloys. Journal of Alloys and Compounds. 2007;439(1-2):114−127. doi:10.1016/j.
jallcom.2006.08.246
38. Şahin M, Çadırlı E, Kaya H. Influence of the solidification parameters on dendritic microstructures in unsteady-state directionally solidified of lead-antimony alloy. Surface and Review Letters. 2010;17:477−486. DOI: 10.1142/S0218625X10014326
39. Hunt JD. Cellular and primary dendrite spacings, solidification and casting of metals. In: International Conference on Solidiication. Proceedings. London. The Metals Society: 1979. p. 3–9.
40. Kurz W, Fisher DJ. Dendrite growth at the limit of stability: tip radius and spacing. Acta Materialia. 1981;29(1):11–20. DOI: 10.1016/0001-6160(81)90082-1
41. Trivedi R. Interdendritic spacing: Part II. A Comparison of theory and experiment. Metallurgical and Materials Transactions A.
1984;15(6):977–982. DOI 10.1007/BF02644689
42. Miyata Y, Suzuki T, Uno IJ. Cellular and dendritic growth: Part I. Experiment. Metallurgical and Materials Transactions A. 1985;16(10):1799–1805. DOI 10.1007/BF02670367
43. Jesse RE, Giller HF. Cellular growth: The relation between growth velocity and cell size of some alloys of cadmium and zinc. Journal of Crystal Growth. 1970;7(3):348–352.
doi:10.1016/0022-0248(70)90062-X
44. Kurz W, Giovanola B, Trivedi R. Microsegregation in rapidly solidified Ag-15wt%Cu. Journal of Crystal Growth.
1988;91(1-2):123–125.doi:10.1016/0022-0248(88)90376-4
45. Kurz W, Fisher DJ. Fundamentals of solidiication. Aedermannsdorf, Switzerland Trans Tech; 1989.
46. Kaya H, Çadırlı E, Gündüz M. Dendritic growth in an aluminum-silicon alloy. Journal of Materials Engineering and Performance.
2007;16(1):12–21. DOI 10.1007/s11665-006-9002-2 47. Trivedi R, Somboonsuk K. Constrained dendritic growth and
spacing. Materials Science and Engineering. 1984;65(1):65–74. doi:10.1016/0025-5416(84)90200-3
48. Bouchard D, Kirkaldy JS. Scaling of intragranuiar dendritic microstructure in ingot solidification. Metallurgical and Materials Transactions B. 1996;27(1):101–113.DOI 10.1007/
BF02915081
49. Bouchard D, Kirkaldy JS. Prediction of dendrite arm spacings in unsteady-and steady-state heat flow of unidirectionally solidified binary alloys. Metallurgical and Materials Transactions B.
1997;28(4):651–663.DOI 10.1007/s11663-997-0039-x 50. Hall EO. The deformation and ageing of mild steel: discussion
of results. In: The Physical Society of London. Proceedings.
London; 1951;Section B 64:747–753.
51. Petch NJ. The cleavage strength of polycrystals. The Journal of the Iron and Steel Institute. 1953;174 25–28.
52. Çadırlı E, Böyük U, Kaya H, Maraşlı N. Determination of mechanical, electrical and thermal properties of the Sn-Bi-Zn ternary alloy. Journal of Non-Crystalline Solids. 2011;
357:2876–2881.DOI: 10.1016/j.jnoncrysol.2011.03.025 53. Hu X, Li K, Ai F. Research on lamellar structure and
micro-hardness of directionally solidified Sn-58Bi eutectic alloy.
China Foundry. 2012;9:360–365.
54. Vnuk F, Sahoo M, Baragor D, Smith RW. Mechanical properties of Sn-Zn eutectic alloys. Journal of Materials Science.
1980;15(10):2573–2583. DOI 10.1007/BF00550762 55. Böyük U, Maraşlı N. The microstructure parameters and
microhardness of directionally solidified Sn-Ag-Cu eutectic alloy. Journal of Alloys and Compounds. 2009;485(1-2):
264–269.doi:10.1016/j.jallcom.2009.06.067
56. Hu X, Chen W, Wu B. Microstructure and tensile properties of Sn-1Cu lead-free solder alloy produced by directional solidification. Materials Science and Engineering A. 2012;
556:816–823.
57. Mondal B, Samal S, Biswas K. Development of ultrafine Ti-Fe-Sn in-situ composite with enhanced plasticity. IOP Conference Series on Materials Science. 2011;27:012025.
58. Samal S, Biswas K. Novel high strength Ni48Cu10Co2Ti38Ta2 composite with enhanced plasticity. Journal of Nanoparticle Research. 2013;15:1783.
59. Samal S, Mohanty S, Mishra A K, Biswas K, Govind B. Microstructural evolution of ultrafine Ti-Fe-Co alloys.
Materials Science Forum. 2014;790–791:497-501.
60. Siewert T, Liu S, Smith DR, Madeni JC. Database for solder properties with emphasis on new lead-free solders. Colorado:
National Institute of Standards and Technology, Colorado School of Mines; 2002. http://www.msed.nist.gov/solder/ NIST_LeadfreeSolder_v4.pdf