Advances in Radio Science, 3, 395–398, 2005 SRef-ID: 1684-9973/ars/2005-3-395
© Copernicus GmbH 2005
Advances in
Radio Science
Analysis Method of Errors (Motion and Atmospheric) in Synthetic
Aperture Radar (SAR) Images
A. Danklmayer1, K. A. Camara de Macedo1, R. Scheiber1, T. Boerner1, and M. Chandra2
1Institut f¨ur Hochfrequenztechnik und Radarsysteme, Deutsches Zentrum f¨ur Luft und Raumfahrt (DLR), Oberpfaffenhofen,
P.O.Box 1116, 82234 Wessling, Germany
2Professur f¨ur Hochfrequenztechnik und Photonik, Technische Universit¨at Chemnitz, Reichenhainer Str. 70, 09126 Chemnitz,
Germany
Abstract. A method to allow the analysis of the effects of motion and atmospheric errors in SAR images is here pre-sented. The objective of the method is to allow the visual-ization of the effects of motion errors and atmospheric arte-facts on the processed (focused) SAR image. The method is intended to allow the analysis of the interaction of mo-tion and atmospheric errors with the adopted SAR process-ing procedure and motion compensation algorithms. In this article the analysis method has been applied and tested to a C-Band E-SAR (DLR airborne SAR system) data set where we see that the effects of linear and non-linear phase errors observed are in agreement with the theory.
1 Introduction
High resolution images, polarimetric data, repeat-pass Inter-ferometry are specially affected by motion and atmospheric errors. Moreover, phase effects can limit the interpretation of repeat-pass interferometric SAR applications like Differen-tial Interferometry (D-InSAR) in the way that subsidence of terrain or crustial deformation may be biased either by an at-mospheric phase screen or by residual motion errors (Ferretti et al., 2003; Danklmayer et al., 2004; Macedo and Scheiber, 2004; Scheiber, 2003; Prats, 2004).
Generally speaking the effects of the motion and atmo-spheric errors in the SAR image are the same, differing mainly in intensity and distribution along the image. Motion errors are associated to the flight instability around the nom-inal track (Macedo and Scheiber, 2004), while atmospheric effects are associated with erroneous propagation of the signal through the atmosphere (Ferretti et al., 2003). An atmospheric model applied to a SAR image geometry and acquisition characteristics is yet to be considered in a further work. One of the objectives of this paper is, once a model for atmospheric error is available, to use this model in the analysis method here proposed to see how the atmospheric Correspondence to:A. Danklmayer
effects take place (distribution and intensity) in the SAR image. Another objective of the proposed method is to permit the analyses of the interaction of the motion and atmospheric error with the processed algorithm used and error compensation algorithms. Below, we describe the nature of the motion and atmospheric errors.
Motion Errors
The SAR raw data are processed assuming that the acqui-sition has been performed in a rectilinear trajectory. In real-ity the acquisition happens in a non-rectilinear track causing undesired phase delays in the acquired data (Fig. 1a) lead-ing to distortions (phase offset, time shift and defocuslead-ing) of the Impulse Response Function (IRF) of the SAR processor (Buckreuß, S., 1994, 1991). The delay or phase error is 2π
times the round-trip distance difference in wavelength, that is:
φd=4π 1R/λ , (1) where λis the wavelength of radar signal and1R denotes the difference between nominal and real range.
Concerning flight stability, the airborne data are more affected by motion errors then the spaceborne data, and special care has to be taken during the processing chain to compute and compensate those errors (Scheiber, 2003; Prats, 2003; Moreira and Huang, 1994; Reigber and Scheiber, 2003). For actual airborne SAR systems, the motions errors vary up to 5 m around the nominal track.
Atmospheric Errors
396 A. Danklmayer et al.: Analysis Method of Errors in Synthetic Aperture Radar
Fig. 1.Sketch showing the nature of the phase errors.
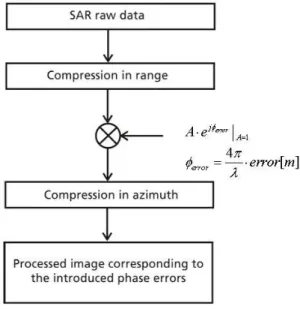
Fig. 2.Flow chart for the analysis procedure.
investigation can be considered in the context of future com-mercial SAR systems like TerraSAR-X (Werninghaus et al., 2004) and airborne SAR systems where control of product quality becomes increasingly important. Investigations on atmospheric effects in airborne SAR systems have not been found in the literature so far. For end users it is of great
Fig. 3.Depiction of the linear phase error.
Fig. 4.Depiction of the non-linear phase error.
interest and importance to provide an indication of product quality and how likely products are affected by atmospheric artefacts.
At first instance it would be sufficient to flag such data using tropospheric partameters i.e. temperature, pressure, at-mospheric humidity, wind speed, precipitation rate and in a following step one can concentrate to cancel such errors af-ter the definite identification and localization. Of course this provides a challenging task.
This article is organized as follows: Sect. 2, describes the analysis method here proposed for motion and atmo-spheric errors. Section 3 shows the results of the use of the method for a known linear and non-linear phase error. The conclusions are given in Sect. 4.
2 Analysis Method
The analysis method can be best described using the flow chart which is provided in Fig. 2.
A. Danklmayer et al.: Analysis Method of Errors in Synthetic Aperture Radar 397
Table 1.Main parameter for the simulation.
Parameter Value
Wavelength 0.0566 m PRF 952.38 Hz Flight velocity 72.6 m/s Sampling frequency 100 MHz Bandwidth 50 MHz
r0 1410 m
Azimuth pixel spacing 0.076 m Range pixel spacing 3 m
Azimuth Dimension 16384 px / 1249 m Range Dimension 512 px / 1536 m
Fig. 5.Raw data after range compression.
is added to the raw data, before SAR data compression. Al-ternatively, the error can be added to the range compressed data since the phase error effects in azimuth are dominant (Scheiber, 2003; Prats, 2004).
The above analysis by adding the phase error to the raw data is only corrected for phase errros associated with motion errors along a flat terrain area. For topography-dependent phase errors, each target in the image has a different phase error (Macedo and Scheiber, 2005). In order to add and analyse topography-dependent phase errors, the FFT ap-proach to compensate motion errors described in Macedo and Scheiber (2005) can be used to add (instead of compensating) phase errors.
In this work, the Range Doppler processor was used to compress the data. After the compression in range (see range compressed raw data in range in Fig. 4), the phase value er-rors have been added in order to see the effects of them in the processed SAR data. Up to now only linear and non-linear azimuth phase value errors have been considered (see Figs. 3 and 4) and the amplitude values of the added signals remained the same. The effects of this linear and non-linear
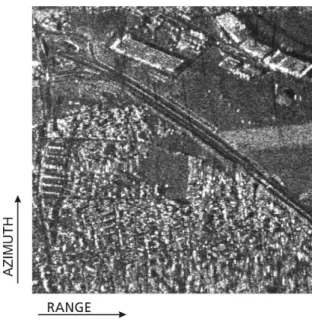
Fig. 6.Processed image with unmodified raw data.
Fig. 7.Processed image with linear phase error.
phase errors are well known in the literature (phase offset, shift in time, defocusing), (Buckreuß, 1994, 1991). By using them we want to see these known effects in the SAR im-age by using the proposed analyses method and see if it is in agreement with the theory.
3 Results
The data to be analysed was collected in strip-map mode with E-SAR, the experimental SAR system which belongs to DLR, German Aerospace Center, operated by the Mi-crowaves and Radar Institute (HR). Table 1 shows the main parameters of the used data.
398 A. Danklmayer et al.: Analysis Method of Errors in Synthetic Aperture Radar
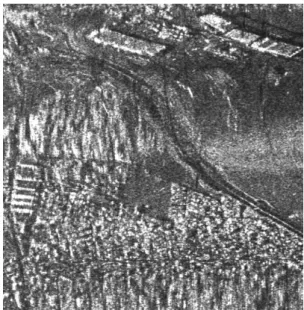
Fig. 8.Processed image with non-linear phase error.
introduction of additional phase values. Moreover in Figs. 5 and 6 the data with the linear and the nonlinear azimuth phase errors are given. The simulation for the linear case exhibits a vertical shift of the image of approximately 36 m. The cal-culation of this value can be done by using the following ex-pression (Buckreuß, 1994, 1991):
S= −r0
∂1r
∂x (2)
whereSdenotes the shift in meters,r0is the range distance
and1ris the phase error function.
In the case where the non-linear error was introduced to the raw data we observe basically two expected effects. One is in principle the same as in the linear case, to wit the shift in azimuth direction. The artificially bended road shown in Fig. 8 cf. Fig. 6 is an indicator of this effect. On the other hand defocusing took place which can be seen in the upper left of Fig. 8. This is not surprising if we consider the re-sults that we obtain in the case of simple point targets, where simulations have already been carried out (Buckreuß, 1994, 1991). The same effects appear on the IRF for point targets if linear or non-linear phase errors are introduced. The effects are the broadening of the main lobe, the shift of the main lobe and the elevation of the sidelobes. Using the proposed analysis method allows us to see and analyze the effects for the whole SAR image.
What has to be done in one of our next steps in the in-vestigation of the influence of phase errors is to adjust the values, in which we alter the pre-compressed raw data, to a realistic scenario. In the case of motion errors there is no doubt that typically values of the error are plus/minus 5 to 10 m from the nominal path. In the atmospheric case we are not fully aware of the detailed structure of the errors to be introduced. Therefore we have to clarify this issue with the help of a model to obtain the propagation conditions from the type of the weather and henceforth a pattern which can help
to prove the possible influence on the products and how they are affected.
4 Conclusions
The way in which the data was analyzed and modified with the introduced phase errors shows how they affect the im-age reconstruction and represents an appropriate approach to tackle the issue of errors due to track oscillations and atmo-spheric artefacts. It has been shown that the resulting be-havior due to linear and non-linear phase errors are as ex-pected and in agreement with the theory. Future work con-sists of elaborating the simulation to allow the computation of interferograms in terms of phase errors. Furthermore we consider the elaboration of the atmospheric model to fit the SAR image concerning phase and attenuation effects.
Acknowledgements. The authors wish to thank the EU for
sup-porting this research as a component of RTN (Research Training Network)–AMPER. Contract number: HPRN-CT-2002-00205
References
Buckreuß, S.: Motion Errors in an Airborne Synthetic Aperture Radar System, Eurp. Trans. Telecomm., vol 2, no. 6, 655–644, Nov.–Dec. 1991.
Buckreuß, S.: Bewegungskompensation f¨ur flugzeugetragene SAR-Systeme, DLR-Forschungsbericht, FB 94–17, 1994.
Danklmayer, A., Archibald, E., Boerner, T., Hounam, D., and Chan-dra, M.: Atmospheric effects and product quality in the applica-tion of SAR interferometry, EUSAR 2004, Ulm, Germany, 25– 27 May 2004.
Ferretti, A., Prati, C., and Rocca, F.: Permanent Scatters in SAR Interferometry, IEEE trans. On Geosc ad Rem. Sensing, vol. 39, No. 1, 8–20, 2001.
Macedo, K. A. C. and R. Scheiber: Controlled Experiment for Anal-ysis of Airborne DInSAR Feasibility, EUSAR 2004, Ulm, Ger-many, 25–27 May 2004.
Macedo, K. A. C. and Scheiber, R.: Precise Topography- and Aperture-Dependent motion compensation for Airborne SAR, IEEE Geosc. and Remote Sensing Lett., accepeted for publica-tion in the issue of April 2005.
Moreira, A. and Huang, Y.: Airborne SAR processing of highly squinted data using chirp scaling approach with integrated mo-tion compensamo-tion IEEE Trans. Geosc. And Remote Sensing, vol. GE-32, no. 5, 1029–1040, September 1994.
Prats, P., Reigber, A., and Mallorqui, J.: Interpolation-free coreg-istration and phase-correction of airborne SAR interferograms IEEE Geosc. and Remote Sensing Lett. Vol. 1, no. 3, 188–191, July 2004.
Reigber, A. and Scheiber, R.: Airborne differential SAR interfer-ometry: First results at L-band IEEE Trans. Geosc. And Remote Sensing, vol. GE-41, no. 6, 1516–1520, June 2003.
Scheiber, R.: A three-step phase correction approach for airborne repeat pass interferometric SAR data, Proceeding of IGARSS, Toulouse, July 2003.