www.hydrol-earth-syst-sci.net/20/3511/2016/ doi:10.5194/hess-20-3511-2016
© Author(s) 2016. CC Attribution 3.0 License.
A Lagrangian model for soil water dynamics during rainfall-driven
conditions
Erwin Zehe and Conrad Jackisch
Karlsruhe Institute of Technology (KIT), Karlsruhe, Germany Correspondence to:Erwin Zehe ([email protected])
Received: 4 March 2016 – Published in Hydrol. Earth Syst. Sci. Discuss.: 15 March 2016 Revised: 18 August 2016 – Accepted: 18 August 2016 – Published: 2 September 2016
Abstract. Within this study we propose a stochastic ap-proach to simulate soil water dynamics in the unsaturated zone by using a non-linear, space domain random walk of water particles. Soil water is represented by particles of con-stant mass, which travel according to the Itô form of the Fokker–Planck equation. The model concept builds on es-tablished soil physics by estimating the drift velocity and the diffusion term based on the soil water characteristics. A naive random walk, which assumes all water particles to move at the same drift velocity and diffusivity, overestimated deple-tion of soil moisture gradients compared to a Richards solver. This is because soil water and hence the corresponding wa-ter particles in smaller pore size fractions are, due to the non-linear decrease in soil hydraulic conductivity with de-creasing soil moisture, much less mobile. After accounting for this subscale variability in particle mobility, the particle model and a Richards solver performed highly similarly dur-ing simulated wettdur-ing and drydur-ing circles in three distinctly different soils. Both models were in very good accordance during rainfall-driven conditions, regardless of the intensity and type of the rainfall forcing and the shape of the initial state. Within subsequent drying cycles the particle model was typically slightly slower in depleting soil moisture gradients than the Richards model.
Within a real-world benchmark, the particle model and the Richards solver showed the same deficiencies in matching observed reactions of topsoil moisture to a natural rainfall event. The particle model performance, however, clearly im-proved after a straightforward implementation of rapid non-equilibrium infiltration, which treats event water as different types of particles, which travel initially in the largest pore fraction at maximum velocity and experience a slow diffusive mixing with the pre-event water particles. The proposed
La-grangian approach is hence a promising, easy-to-implement alternative to the Richards equation for simulating rainfall-driven soil moisture dynamics, which offers straightforward opportunities to account for preferential, non-equilibrium flow.
1 Introduction
Only a tiny amount of water is stored in the unsaturated zone: with an estimated volume of about 16 500 km3 (Dingman, 1994), soil moisture represents 0.05 % of total fresh water. Nevertheless, this tiny storage amount exerts first-order con-trol on the partitioning of net radiation energy in latent and sensible heat flux (Kleidon and Renner, 2013a, b; Gayler et al., 2014; Turner et al., 2014) – possibly the key process in land surface atmosphere exchange. Crucially, soil moisture crucially controls CO2emissions of forest soils (Koehler et al., 2010) denitrification and related trace gas emissions into the atmosphere (Koehler et al., 2012) as well as metabolic transformations of pesticides (e.g. Holden and Fierer, 2005). Nonetheless, soil moisture controls splitting of rainfall into surface runoff and (preferential) infiltration (Zehe et al., 2007; Lee et al., 2007; Loos and Elsenbeer, 2011; Graeff et al., 2012; Bronstert et al., 2012; Zimmermann et al., 2013; Klaus et al., 2014). Soil water is furthermore a key factor limiting vegetation dynamics in savannah ecosystems (Saco et al., 2007; Tietjen et al., 2010).
is the Darcy–Richards equation in combination with suit-able soil water characteristics. This continuum model es-sentially assumes that capillarity-controlled diffusive fluxes dominate soil water dynamics under local equilibrium condi-tions even during rainfall-driven condicondi-tions. Today we know that the assumptions of local equilibrium conditions (e.g. Hassanizadeh et al., 2002; Neuweiler et al., 2012) and a mainly diffusive flow are often not appropriate, particularly during rainfall events in structured soils. Rapid or preferen-tial flow implies a strong local disequilibrium and imper-fect mixing between a fast fraction of soil water, travelling in interconnected coarse pores or non-capillary macropores (Šim˚unek et al., 2003; Wienhöfer et al. 2009; Klaus et al., 2013), and the slower diffusive flow in finer fractions of the pore space. As outlined in a couple of excellent review arti-cles (e.g. Šim˚unek et al., 2003; Beven and Germann, 2013), many concepts have been proposed to overcome the inabil-ity of the Darcy–Richards concept to cope with non-well-mixed or even non-capillary, preferential flow. These con-cepts range from (a) early stochastic convection (Jury, 1982) and (b) dual porosity and permeability approaches assum-ing overlappassum-ing and exchangassum-ing continua (Gerke and van Genuchten, 1993; van Schaik et al., 2014) to (c) spatially ex-plicit representation of macropores as vertically and laterally connected flow paths (Vogel, 2006; Klaus and Zehe, 2010; Zehe et al., 2010a; Wienhöfer and Zehe, 2014) and (d) non-local formulations of the Richards equation (Neuweiler et al., 2012). Notwithstanding the listed shortcomings, the Darcy– Richards concept works well when soil water dynamics are dominated by capillarity particularly during radiation-driven conditions (Zehe et al., 2010b, 2014). Furthermore, it would be unwise to mistake the limitations of the Richards equation for non-importance of capillary forces in soil. Without capil-larity, infiltrating rainfall would drain into groundwater bod-ies, leaving an empty soil as the local equilibrium state (Zehe et al., 2013) – there would be no soil water dynamics at all, probably even no terrestrial vegetation, and the water cycle would operate in a completely different manner without cap-illary forces. Alternatives to the Darcy–Richards approach, particularly for rainfall-driven soil moisture dynamics, are thus highly desirable, as long as they preserve the grain of “truth” about capillarity as an underlying key control.
Here we propose such an alternative approach to simulate infiltration and soil moisture dynamics during and shortly af-ter rainfall events in an effective, stochastic and yet physi-cal way. Specifiphysi-cally, we hypothesise that infiltration and soil water flow during and shortly after rainfall events may be simulated by means of a non-linear random walk, represent-ing soil water by a variable number of particles. To the best of our knowledge, similar approaches have only been pro-posed by Davies and Beven (2012) and taken much further by Ewen (1996a, b). In accordance with the latter approach, our model concept is essentially built on capillarity by mak-ing use of soil physics and established soil water characteris-tics.
Particle tracking based on a random walk is usually em-ployed for simulating advective–dispersive transport of so-lutes in the water phase, but not for the soil water phase itself (Delay and Bodin, 2001; Klaus and Zehe, 2011; Dentz et al., 2012). For linear problems, when neither the dispersion co-efficient nor the drift term depends on solute concentration and thus particle density, a time domain representation of the random walk is favourable as it maximises computational ef-ficiency (Dentz et al., 2012). Non-linear problems, such as transport of non-linearly adsorbing solutes or the envisaged simulation of soil water dynamics, require a space domain random walk because the drift and diffusion terms change non-linearly with changing particle density. Hence, an inte-gral treatment is inappropriate as the superposition principle is invalid for non-linear problems.
In the following we introduce the model concept and present different benchmarks to test its capability to simu-late soil moisture dynamics during and shortly after rainfall events for equilibrium and non-equilibrium conditions. More specifically, we (a) detail the underlying theory and model implementation, (b) reflect on obvious and non-obvious im-plications of treating water flow in a porous medium as a non-linear random walk, and (c) propose a straightforward way to treat non-equilibrium infiltration in Sect. 2. Section 3 explains the model benchmarking (a) against a model based on the Darcy–Richards concept for various soils as well as initial and boundary conditions and (b) against soil moisture observations obtained in a rural loess catchment in Germany. After presenting the results in Sect. 4, we close with discus-sion and concludiscus-sions in Sect. 5.
2 Theory and model implementation
2.1 A random walk approach for diffusive water flow in the soil matrix
Our starting point is the Richards equation in the soil-moisture-based form: ∂θ ∂t = ∂k(θ ) ∂z + ∂ ∂z
D(θ )∂θ ∂z
D(θ )=k(θ )∂ψ
∂θ. (1)
θ[L3/L3] is the volumetric soil water content. Equation (1)
can be re-written in as:
∂θ ∂t = ∂ ∂z k(θ ) θ θ + ∂ ∂z
D(θ )∂θ ∂z
, (2)
and Eq. (2) can be further re-written into a divergence-based form: ∂θ ∂t = ∂ ∂z k(θ ) θ θ−
∂D(θ ) ∂z θ
+ ∂ 2
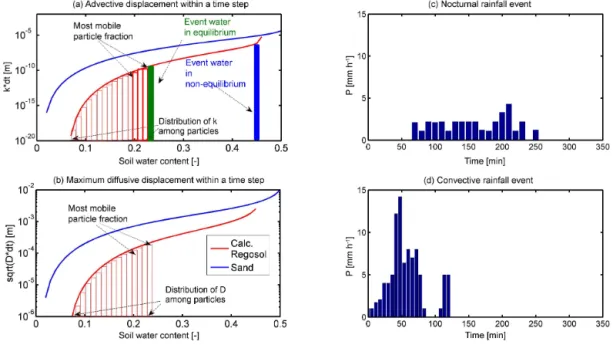
Figure 1.Advective/drift displacement of a particlek(θ) dt (a)and maximum diffusive displacement (D(θ )dt)0.5(b)plotted against soil water content for the sand on limestone in the Attert catchment and the Calcaric Regosol on loess in the Weiherbach catchment. The vertical bars visualise the distribution of theDamong the particles, representing water in different pore size fractions. The arrows mark the most mobile particle fraction in the five upper soil moisture classes. The red and the blue rectangle highlight the case when treating event water either as in local equilibrium and particles travel according toD((θ (t+0.51t ))andk((θ (t+0.51t ))or when they enter the coarsest pores and travel accordingks. Panels(c)and(d)present the two different rainfall events for the model testing.
Equation (3) is formally equivalent to the Fokker–Planck equation. The volumetric soil water content θ [L3/L3]
corresponds to the concentration C [M L−3] in the
ad-vection diffusion equation; the first term corresponds to a drift/advection term u(θ )=k(θ )/θ−∂D(θ )/∂z[L T−1],
characterising downward advective water fluxes driven by gravity. The second term corresponds to the disper-sive/diffusive solute flux by representing diffusive water movements driven by the soil moisture gradient and con-trolled by the diffusivity D(θ )[L2T−1] of soil water.D is
the product of the hydraulic conductivity k(θ )[L T−1] and
the slope of the soil water retention curve ∂ψ ∂θ [L].
This formal equivalence and the work of Ewen (1996a, b) motivated the idea to simulate infiltration and soil water movement by a random walk of a large number of particles. The soil moisture profile at a given time and within a given spatial discretisation is represented by the spatial density of “water particles” at this time. Water particles are constant in mass and volume. The trajectory of a single particle within a time step 1t is described by the corresponding Langevin
equation:
z(t+1t )= −
k(θ (t ))
θ (t ) +
∂D(θ (t )) ∂z
·1t
+Zp6·D(θ (t ))·1t , (4)
with Z being a random number, uniformly distributed
be-tween [1,−1]. Alternatively, when using standard normally
distributed random numbers,N, one obtains
z(t+1t )= −
k(θ (t ))
θ (t ) +
∂D(θ (t )) ∂z
·1t
+Np2·D(θ (t ))·1t . (5)
The term ∂D(θ )∂z corrects the drift term in the case
of a spatial variable diffusion as recommended by dis (1994), Roth and Hammel (1996), Michalak and Kitani-dis (2000), Elfeki et al. (2007), and Uffink et al. (2012). The main difference to the usual linear random walk is thatDand kdepend on soil moisture and thus the water particle density.
Here we parameterise this dependence by means of the van-Genuchten (1980) and Mualem (1976) model (Fig. 1).
2.2 Challenges of the particle-based approach 2.2.1 Non-linear dependence ofDandkon particle
density
The obvious implication of the non-linear dependence of the drift velocity and diffusion term on the soil water content is that a short time stepping in combination with at least a predictor corrector scheme is needed to account for the non-linear change in both parameters during an integration time step.
distribution of the soil (Jury and Horton, 2004) and the actual soil moisture reflects water that is stored among different size fractions of the wetted pore space.
At first sight, one could expect an approach where all wa-ter particles in the pore space experience the same diffu-sion coefficientD(θ (t ))and driftk(θ (t )) / θ (t )to work well
for high particle numbers. This straightforward approach is in analogy to the treatment of solutes in a random walk, where all solute particles in a flow field indeed experience the same dispersion, as they experience the same “average path length”. Hence, their diffusion step scales for all so-lute particles with the same coefficient. A closer look reveals, however, that it might be not that straightforward in the pore space, because water flow velocity decreases with decreas-ing pore size, which is reflected in the non-linear decrease in soil hydraulic conductivity with decreasing soil water con-tent. This non-linear decrease implies that the water parti-cles representing the actual soil water contentθ(t) do not all
travel at the same constant drift velocity k(θ (t )) and
diffu-sivityD(θ (t )). In fact, only a small fraction of the particles,
representing the water in the largest wetted pores, travels ac-cording to these values; the remaining water particles, repre-senting water stored in smaller pores, are much less mobile. To account for this subscale distribution of mobility, the dif-fusive step in the water particle model cannot scale for all particles with same maximumD(θ (t )) – it needs to reflect
the distribution ofD within the different wetted pore sizes
fraction (Fig. 1). To achieve this, we subdivide the particles in a grid cell intoN bins (for instance 800) and calculatek
andDstarting from the residual moisture content to theθr stepwise toθ (t )using a step with1θ=(θ (t )−θr) / N. The random walk step for particles within a given bin is hence as follows:
zi(t+1t )= −
k(θr+i·1θ )
θ (t ) +
∂D(θr+i·1θ )
∂z
·1t+Np2·D(θr+i·1θ )·1t i=1, . . ., N. (6) Essentially, we propose that a correct random walk imple-mentation needs to account for the different mobility of the water particles in different pore sizes in the outlined manner. Conversely, we expect a “naive” execution of Eq. (5), assum-ing that all particles in a given grid element are equally mo-bile in order to overestimate fluxes and depletion soil mois-ture gradients.
2.2.2 The necessity to operate at high particle numbers Another challenge when treating water flow in a Lagrangian approach is that a much larger number of particles is neces-sary compared to random walk applications of solute trans-port. Why is this? The latter treats cases when a solute in-vades a domain with a small or zero background concentra-tion of this solute. The total solute mass in the system can thus be represented by the order of 104–105particles even in
large, two-dimensional domains at a good signal-to-noise ra-tio (Roth and Hammel, 1996; Zehe et al., 2001). In the case of soil water dynamics the “background concentration”, i.e. the stored pre-event water mass in the soil profile, is much larger than the input signal of infiltrating event water. The particle number must thus be considerably increased to the order of 106in a one-dimensional domain to ensure that the rainfall input is represented by a number of particles which is sufficiently high for a stochastic approach.
2.3 Equilibrium and non-equilibrium infiltration Infiltration into the soil at a givenθ (t )is represented as input
of event water particlesNin(t) into the upper model element,
thereby changing the soil water content by1θ. Local
equi-librium conditions, as assumed in the Darcy–Richards con-cept, imply that water infiltrates into the smallest non-wetted part of the pore space (as sketched in Fig. 1a). Consequently, the random walk of the event and pre-event water particles in the largest wetted pores is determined byD(θ (t )+1θ )and k(θ (t )+1θ )(Fig. 1).
A straightforward approach to account for non-equilibrium infiltration is to assume that event water enters into and travels in the coarsest pores of the soil, thereby wetting the path of minimum flow resistance (Fig. 1a). This implies that diffusive mixing from these coarse pores into the smallest non-wetted part of the pore space is much slower than the gravity-driven downward flow. Non-equilibrium infiltration may hence be simulated by assigning the saturated hydraulic conductivityks/ θs as a drift term for “event water particles” and assuming small diffusive mixing, for instance the lower 5 or 10 % quantile of
D(θ ). From the latter we specify the timescales for the event
water to mix with the pre-event water as explained further in Sect. 3.2.
2.4 Model implementation and execution
2.4.1 Model parameters and initial and boundary conditions
The proposed water particle model is coded in Matlab and requires in its simplest form the same parameters, initial and boundary conditions as a numerical solver of the Richards equation (soil hydraulic functions for the entire soil profile as well as a rainfall time series). Although the random walk it-self does not require a spatial discretisation, we employ a grid to calculate particle densities and soil water contents during run time. The model is populated with the initial number of particles based on definitions of either soil moisture or ma-tric potential of the profile and its selected spatial discretisa-tion. The particle massm[M] is equal to the integral water
mass of the initial state divided byN. The spatial gradient of
Initial positions of the pre-event water particles in a given grid cell are uniformly distributed. Infiltration or soil evapo-ration is represented as particle inputNin(t )or lossNout(t )
into/from the upper model element by dividing the infil-trated/evaporated water mass in a time step by the particle mass. Infiltrating particles start atz=0. Depending on the selected lower boundary condition, particles may drain freely from the domain (free drainage boundary), a fixed number of particles is kept (constant-head boundary), or particles are not allowed to leave the domain (zero-flux boundary).
For the implementation of non-equilibrium infiltration we treat event water particles as separate type of particles (Fig. 1), similar to a different kind of solute that is not influ-enced by the pre-event water particles unless both fractions are well mixed. Shortly after infiltration we assume event particles to be mainly controlled by gravity; they travel ac-cording toks and experience a small diffusive motion
char-acterised by Dmix.Dmix determines the timescale at which
pre-event and event water particles get mixed (see Eqs. 7 and 8). Non-equilibrium implies that the timescale for diffusive mixing tmix is much larger than the timescale of advective
transport tad through a grid element1z, which implies the
grid Péclet number being much larger than 1:
1zks Dmix=
tmix
tad ≫1 (7)
tmix=(1z) 2
Dmix
;tad=1z
ks . (8)
Based on this, mixing can be characterised by, for instance, using an exponential distribution (as proposed by Davies and Beven, 2012). In our study we selected an even simpler ap-proach, assuming uniformly distributed mixing between the time when particle enter the domain and the mixing time. This approach maximises the entropy of the mixing process (Klaus et al., 2015), thereby minimising the number of a pri-ory assumptions, because mixing of each particle is equally likely.
2.4.2 Time stepping and subscale variability in particle mobility
For model execution we choose a predictor corrector scheme: we predict the particle displacement for 0.5·1t, based on k(θ (t )), D(θ (t )); update θ (t+0.5·1t ) based on the new
particle density distribution; and compute the full time step using k(θ (t+0.5·1t )),D(θ (t+0.5·1t )). Ask(θ (t ))and D(θ (t )) are only available at the discrete nodes of the
sim-ulation grid, these are interpolated to the particle locations using inverse distance weights.
We tested two different approaches to cope with the above-explained non-linear dependence of D andk on θ (t ) and
thus on particle density. The first approach, referred to as “full mobility mode”, distributes D among the particles to
resemble the shape of D between D(θr) and D(θ (t )) and ofkbetweenk(θr) andk(θ (t ))according to Eq. (6). To this
end, we subdivided the actual number of particles in a grid cell as well as theDandkcurves into different numbers of
bins (Fig. 1) to estimate the sensitivity ofN. This full
mo-bility approach does, however, imply the need to calculate a large chunk of somewhat marginal displacements askandD
decline rather fast. The computationally less extensive alter-native is to calculate the displacement according to Eq. (2) exclusively for the fastest 10 or 20 % of water particles and assuming the remaining ones to be immobile. Of key interest in this context is also the question of whether the fast mo-bile and the slow immomo-bile particles fractions mix across the pore size fractions or not (Brooks et al., 2010). Mixing can be implemented by assigning the particles randomly to the different bins of during each time stepD(θ ), while no
mix-ing can be realised by always assignmix-ing the same particle to same pore size fraction/“mobility class”. Within our
simula-tions we tested both opsimula-tions. The second option turned out to be clearly superior with respect to matching simulations with a Richards solver. Alternatively, we also implemented the straightforward/naive approach, where all particles in a grid cell travel according to the same diffusion coefficient and drift velocity.
3 Model benchmarking
3.1 Particle model versus Richards equation
In a set of benchmarks, we compared the particle model (PM) to a numerical solver of the Richards equation, which was also implemented using Matlab and the same predic-tor correcpredic-tor scheme. We simulated wetting and drying cy-cles for three soils with rather different soil water character-istics (Table 1). The first soil is a sandy soil developed on limestone located in the Attert experimental basin in Luxem-bourg (Martinez-Carreras et al., 2010; Wrede et al., 2015). The second soil is a young highly porous and highly per-meable soil on schistose periglacial deposits in the Attert basin, which predominantly consists of fine silt aggregates with relatively coarse inter-aggregate pores. The third soil is a Calcaric Regosol on loess with a large fraction of medium size pores, which is located in the Weiherbach catchment in south-western Germany.
These soils were exposed to simulated wetting and drying cycles summarised in Table 2 by combining block rains of different intensity with periods of no flux at the upper bound-ary. Thereby, we compared two different initial soil moisture profiles: a uniform soil water content of 0.269 m3m−3 and
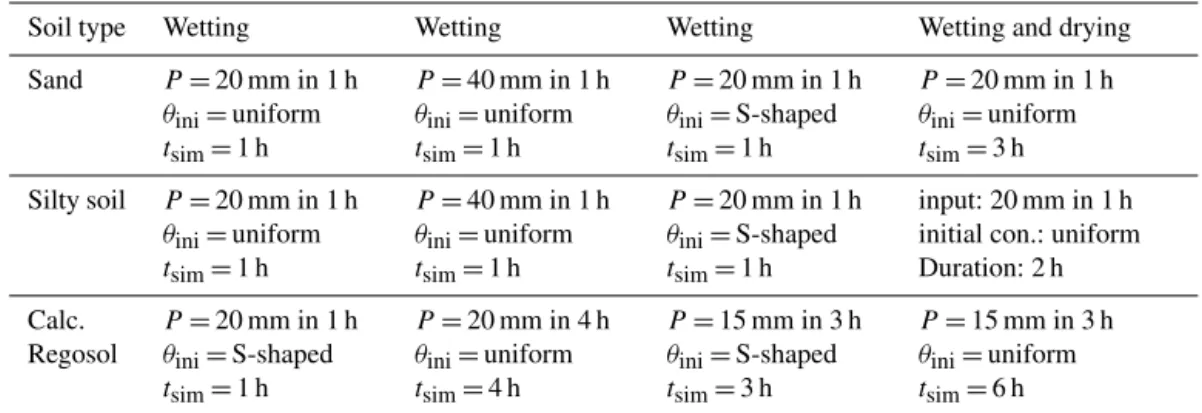
Table 1.Soil hydraulic parameters of the sandy soil on limestone, the young silty soil on schist and the Calcaric Regosol on loess: saturated hydraulic conductivityks, saturated and residual water contentsθsandθr,αparameter, and shape parametern.
Soil type ks[m s−1] θs[–] θr[–] α[m−1] n[–]
Sand on limestone 2.23×10⁻⁴ 0.508 0.01 4.71 1.475 Young silty soil on schist 2.62×10⁻⁴ 0.51 0.12 6.45 1.50 Calc. Regosol on loess 6.0×10⁻⁶ 0.46 0.06 1.50 1.36
Table 2.Characteristics of the numerical benchmarks: rainfall inputP, initial conditionθini, and simulation timetsim.
Soil type Wetting Wetting Wetting Wetting and drying
Sand P=20 mm in 1 h θini=uniform tsim=1 h
P=40 mm in 1 h θini=uniform tsim=1 h
P=20 mm in 1 h θini=S-shaped tsim=1 h
P=20 mm in 1 h θini=uniform tsim=3 h
Silty soil P=20 mm in 1 h θini=uniform tsim=1 h
P=40 mm in 1 h θini=uniform tsim=1 h
P=20 mm in 1 h θini=S-shaped tsim=1 h
input: 20 mm in 1 h initial con.: uniform Duration: 2 h
Calc. Regosol
P=20 mm in 1 h θini=S-shaped tsim=1 h
P=20 mm in 4 h θini=uniform tsim=4 h
P=15 mm in 3 h θini=S-shaped tsim=3 h
P=15 mm in 3 h θini=uniform tsim=6 h
to work out the upper limit for a feasible model execution. The initial number of particles wasNini=106in all cases.
Additionally, we tested the model during a 3 h long drainage scenario starting from a bell-shaped initial soil moisture profile. In the latter case the model domain was ex-tended to a depth of 2.5 m. Lastly, we compared both models in the sandy soil using a 2 h long convective rainfall event of 16 mm observed at a 6 min resolution in summer 2014 in the Attert catchment (Fig. 1d).
3.2 Real world benchmarks: moderate rainfall event on a loess soil
Additionally, we evaluated the particle model against mois-ture dynamics observed at the central meteorological station in the Weiherbach catchment (Zehe et al., 2001; Plate and Zehe, 2008). At this site past rainfall records and soil mois-ture records at 0.025, 0.1, 0.2, 0.3 and 0.4 m are available at a 6 min resolution (Schierholz et al., 2000). We carefully se-lected a moderate nocturnal rainfall event in order to avoid the influence of macropore flow and evaporation on wetting and subsequent drying. The event had a total depth of 4 mm with maximum rainfall intensity of 2 mm h−1, started on 9
May at 01:15 and lasted until 04:15. The changes in soil moisture in the upper layers revealed a recovery of 90 % of the rainfall water, which implies that a small fraction of the water might have bypassed the sensors.
Both models were operated at the fine spatial discretisa-tion of 0.025 m. We set the number of pre-event particles to 106. The simulation period ranged from 00:05 until 05:45 on this day, to allow for a drainage period but to stop
sim-ulation before evaporation in the natural system kicked in. Hydraulic properties of the top and subsoil of the Calcaric Regosol are given in Table 3. Both models were initialised by assigning the observed soil moisture values, which increased from 0.18 m3m−3at 0.025 m depth to 0.33 m3m−3at 0.4 m
depth, using inverse distance interpolation between the grid nodes. As no surface runoff occurred during this event, rain-fall was treated as a flux boundary condition.
4 Results
In the following we present final soil moisture profiles simu-lated with the Darcy–Richards and the particle model for se-lected runs and compare the temporal evolution of soil mois-ture profiles in the form of 2-D colour plots. In terms of com-puting time we noted no remarkable difference between the particle model and the Richards solver.
4.1 Particle model versus Richards equation 4.1.1 Sandy soil on lime stone
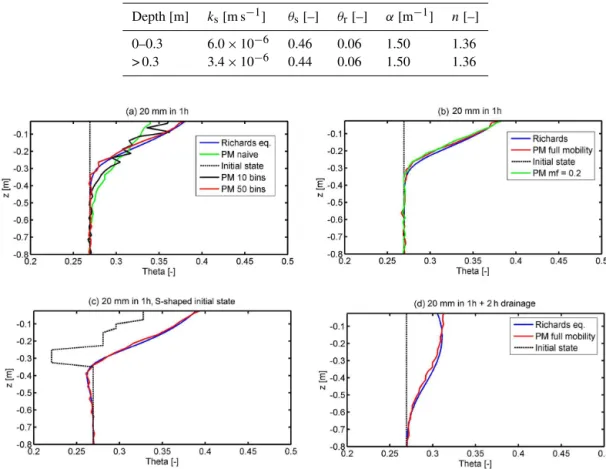
Figure 2 presents the final soil moisture profiles for both models for selected simulation experiments. Figure 2a re-veals that a treatment of soil moisture dynamics as a naive random walk (solid green line), when all particles travel ac-cording toD(θ (t ))andk(θ (t )), clearly implies – as expected
Table 3.Topsoil and the subsoil hydraulic properties at the central meteorological station in the Weiherbach catchment: saturated hydraulic conductivityks, saturated and residual water contentsθsandθr,αparameter, and shape parametern.
Depth [m] ks[m s−1] θs[–] θr[–] α[m−1] n[–]
0–0.3 6.0×10⁻⁶ 0.46 0.06 1.50 1.36 > 0.3 3.4×10⁻⁶ 0.44 0.06 1.50 1.36
Figure 2.Final soil moisture profiles simulated for the sandy soil with the naive random walk(a)and the particle model (PM) using a different number of bins. Panels(b)and(c)compare the particle model to the Richards equation for a block rain of 20 mm starting from the uniform initial state(b)and the S-shaped initial state(c); mf=0.1 denotes the mobile particle fraction. Panel(d)presents the same case as (b)after 2 h of additional drainage. The dashed grey line marks the initial soil moisture profiles.
with a suitable number of bins (N), simulations with the
particle model quickly converge to the simulations with the Richards equation. While a simulation withN=10 bins still shows considerable differences to the Richards equation, a simulation with N=50 bins already provides a much bet-ter match. When operating the particle model according to Eq. (6) usingN =800 bins, the model performed highly sim-ilarly to the Richards equation for all simulation experiments. This can be deduced from Fig. 2b and c, which show the sim-ulated soil moisture profiles which evolved from a uniform and an S-shaped initial state, respectively, after a block rain input of 20 mm. Figure 2d additionally corroborates the sim-ilar performance of both models during a simulated 1 h wet-ting and 2 h drying cycle. The particle model slightly under-estimates the depletion of the soil moisture gradient, which can be deduced from the small overshoot at the top of the pro-file and final propro-file and the slightly smaller values at a depth between 15 and 60 cm. For the sandy soil we also found very good agreement in general between the “full mobility”
par-ticle model and a simulation assuming a mobile fraction of 20 % (solid green line in Fig. 2b).
Figure 3a1 and a2 present a comparison of both models for two different grid sizes during a simulation of a block rain of 40 mm in 1 h. While the simulations with the differ-ent models at a grid size of 0.05 m were clearly differdiffer-ent at the depths of 0.2 and 0.4 m, they performed nearly identically at the finer grid size. Stronger differences between the parti-cle model and the Richards model occurred, however, at the end of a 3 h long drainage experiment, which started from a bell-shaped initial state (Fig. 3b1 and b2). The performance of additional simulations without a drift term in Eq. (6) and without gravity flux in the Richards equation was, in contrast, nearly indistinguishable (not shown). This suggests that dur-ing drainage conditions gravity-driven flow in the Richards model is slightly faster than in the particle model, which ex-plains the slight upward shift of the corresponding soil mois-ture peak.
corrobo-Figure 3.Final soil moisture profiles simulated for the sandy soil with the full mobility model for a block rain of 40 mm at two different grid sizes (a1anda2); the drainage experiment starting from the bell-shaped initial state (b1andb2), for a block rain of 20 mm at different time steps(c); and the convective rainfall event(d).
Figure 5.Final soil moisture profiles simulated with the Richards equation and the particle model for the young silty soil on schist. Panel (a)and(b)show the final states after a block rain of 20 mm and an additional 2 h of drainage, respectively. Panel(c)compares simulations starting from the S-shaped initial soil profile with the full class approach and a mobile fraction, mf, of 10 %. Panel(c)compares the full class approach against the Richards equation starting for a 40 mm block rain of 1 h. The dashed grey line marks the initial soil moisture profiles.
Figure 6.Time series of simulated soil moisture profiles in the upper 80 cm of the young silty soil on schist for a block rain of 20 mm and 2 h of subsequent drainage (aandb) and a block rain of 40 mm in 1 h (candd).
rated by Figs. 3d and 4c and d. Maximum feasible time steps for the particle model in fast-draining soils were 200 s, as corroborated by Fig. 3c. In this context it is worth mention-ing that the Richards solver already started oscillatmention-ing at time steps larger than 40 s.
wet-Figure 7.Final soil moisture profiles simulated for Calcaric Regosol on loess. Panels(a)and(b)compare the particle model in the full mobility model (solid green) and in a mobile fraction of 10 % (solid red) to the Richards solver for a 15 mm rainfall input in 3 h and different initial patterns. Panels(c)and(d)compare the Richards solver and the particle model assuming a mobile fraction of 0.1 after 15 mm infiltration in 3 h and a subsequent drainage phase of 3 h. The dashed grey line marks the initial soil moisture profiles.
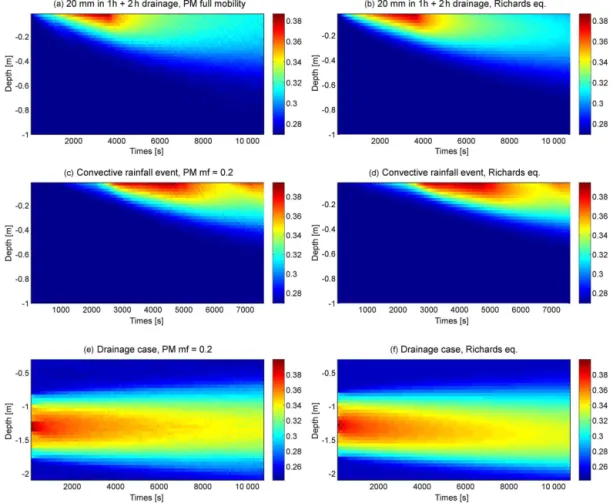
ting phase. However, these differences are small, as further corroborated by 2-D colour plots of the simulated drainage experiment (Fig. 4e and f). Both models perform highly similarly during wetting periods in the form of block rains (Fig. 4a and b) or during simulation of natural rainfall events (Fig. 4c and d).
We hence state that the particle model might be not suited for long-term simulations in coarse-grained, fast-draining soils during non-driven conditions. It appears, however, to be a feasible alternative to the Richards equation for simulation of rainfall-driven soil moisture dynamics in these soils.
4.1.2 Young silty soil on schist
Simulations of soil water dynamics for the young silty soil on schist again revealed a highly similar performance of the Richards equation and the full mobility particle model. This is corroborated by Fig. 5 for a simulated block rain of 20 mm in 1 h (Fig. 5a) and subsequent drying of 2 h dura-tion (Fig. 5b). Both models also perform highly similarly when starting with an S-shaped initial soil moisture profile (Fig. 5c) and during a 40 mm block rain (Fig. 5d). During the latter case, small differences occurred mainly close to the soil surface as shown for the final state (Fig. 5d) and the course of the simulation (Fig. 6c and d).
Again the particle model was slightly less efficient in de-pleting soil moisture gradients during longer drainage peri-ods. This is corroborated by the overestimation of topsoil moisture simulated with the particle model compared to the benchmark based on the Richards equation (Fig. 5c) and the corresponding colour plot in Fig. 6a and b. The differences
between simulations of the particle model operated in the full mobility mode and at a mobile fraction of 0.1 (Fig. 5c) were as small as in the sandy soil.
We can hence also state that the particle model may be a feasible alternative to the Richards equation for simulation of for rainfall-driven soil moisture dynamics in soils which consists of fine aggregated, silty material. Compared to the Richards equation, the particle model shows the same type of deficiency as during simulations for the sandy soil (i.e. a depletion of gradients that is slightly too slow due to a gravity flux being slightly too slow) but less pronounced.
4.1.3 Calcaric Regosol on loess
Figure 8.Time series of simulated soil moisture profiles in the upper 80 cm/20 cm of the Calcaric Regosol on loess for a block rain of 20 mm in 1 and 2 h of subsequent drainage (aandb) starting from an S-shaped soil moisture profile and for the nocturnal rainfall event observed in May in the Weiherbach catchment (candd).
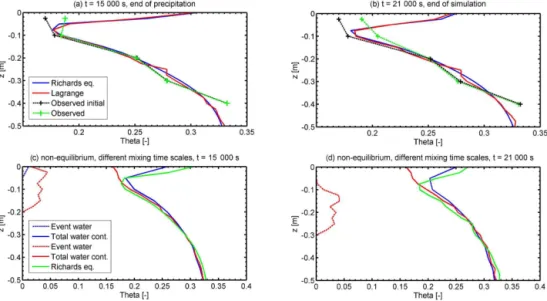
Figure 9.Soil moisture profiles simulated with the Richards equation (solid blue) and the particle model compared to observations in different depths at the end of the precipitation event (15 000 s)(a)and the end of simulation (21 000 s)(b). Initial soil moisture observations are given as black crosses, and intermediate and final observations are given as green crosses. Panels (c)and(d)present fractions of event water (dashed lines) total water content (pre-event+mixed water) for simulations assuming non-equilibrium infiltration. Blue lines correspond to tmix=4300 s and red lines totmix4=7300 s, and the solid green line shows the soil water content simulated with equilibrium infiltration.
We can hence state that the achievement of a very good and numerically efficient match of the Richards model required an operation of the particle model at a mobile fraction of 0.1. This is likely explained by the even finer pore sizes in the Calcaric Regosol, which is reflected in the corresponding air entry values in Table 1. This finding suggest that 90 % of the water stored in soil this fine-grained soil does not contribute
to rainfall-driven soil moisture dynamics but rather accumu-lates an immobile soil moisture stock.
4.2 Real-world benchmark
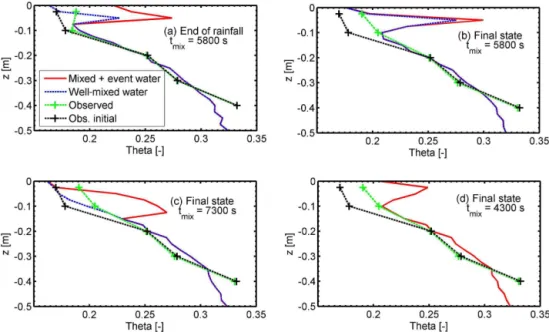
Figure 10.Non-equilibrium simulations compared against observed soil moisture values, fortmix=5800 s after the rainfall event(a)and at the end of the simulation(b). Panels(c)and(d)present the final state fortmix=7300 s andtmix=4300 s, respectively.
This can be deduced from the comparison of corresponding 2-D colour plots of the simulated space–time soil moisture patterns in Fig. 8c and d as well as from the soil moisture pro-files at the end of precipitation event (after 15 000 s, Fig. 9a) and the end of the simulation (after 21 000 s, Fig. 9b). Both models overestimate the observed soil moisture increase in 0.025 m at both time steps but clearly underestimate the ob-served soil moisture increase in 0.1 m depth at the end of the simulation. Hence, although both models perform nearly identically, none of them perform acceptably with respect to the observations.
A possible explanation for the overestimation of the soil moisture change in 0.025 m by the models, which is con-sistent with a non-closed water balance, is that a part of the rainfall water bypassed the measurement device due to fast non-equilibrium infiltration in connected coarse pores. To test this idea, we performed additional simulations by treating infiltrating event water particles as a second particle type infiltrating into the largest pores which uniformly mixed with the pre-event water particles within the timetmix. Fig-ure 9c and d compare the event water content and total con-tent (as the sum of pre-event and mixed water) for two dif-ferent mixing timestmix=4004 (Dmix=1.5×10⁻⁷m2s−1) and 17 144 (Dmix=3.3×10⁻⁸m2s−1), which correspond to the lower 50 or 30 % quantiles ofD(θ ), respectively. In
par-ticular, the model with the longer mixing time performed dis-tinctly differently to the particle model, assuming well-mixed infiltration. Event water infiltrates and bypasses the pre-event water to a depth of between 0.1 and 0.3 m in a clearly ad-vective fashion. Related volumetric pre-event water contents peak at 0.04 m3m−3(Fig. 9c and d). Consequently, the
rain-fall input leaves a much weaker signal in the well-mixed
water fraction (Fig. 10c), reflecting those event water par-ticles which diffusively travelled from the coarse pore frac-tion into the smallest non-wetted fracfrac-tion. In the case of the faster mixing, most of the event water is already mixed with the pre-event water at the end of the rainfall event (Fig. 9c), and water is completed mixed at the end of the simulation (Fig. 9d). Consequently, the differences to the simulation as-suming equilibrium infiltration are much less pronounced.
However, none of the selected mixing timescales yielded a systematically better performance of the particle model, in the sense that the mixed water fraction, which was assumed to be in good contact with the soil moisture probe, better matched the observation at 0.025 m depth. This is corrob-orated for the final states in Fig. 10c and d. We thus per-formed an additional model run assuming a diffusive mixing according to the 40 % quantile ofD(θ ), which corresponds
totmix=7800 s (Dmix=8.8×10⁻⁸m2s−1). In this case the simulated well-mixed water content matched the observa-tions at 0.025 and 0.1 m well. We can, hence, state that the proposed explanation is feasible and that the particle model allows treatment of non-equilibrium infiltration in a straight-forward manner.
5 Discussion and conclusions
5.1 Subscale variability in water particles – the key to a reasonable performance of a non-linear random walk
equation for simulating rainfall-driven soil moisture dynam-ics in the unsaturated zone in an effective and yet physical manner. The model preserves capillarity as a first-order con-trol and estimates the drift velocity and the diffusivity term based on the unsaturated soil hydraulic conductivity and the slope of the soil water retention curve. As expected, a naive random walk, when all particles in a grid element travel ac-cording tok(θ (t )),D(θ (t )), overestimated depletion of soil
moisture gradients compared to the Richards solver within three different soils for all tested initial and boundary condi-tions. The key to improving the particle model performance was to account for the fact that soil water in different pore size fractions is not equally mobile. When accounting for this subscale variability in particle mobility in different pore sizes by resampling theDandkcurves from their minimum
to the actual values with a suitable numbers of bins (Eq. 6), the performance of the particle model was in good to very good accordance with the Richards solver in three distinctly different soils. Both models were in very good accordance during rainfall-driven conditions, regardless of the intensity and type of the rainfall forcing and the shape of the initial state.
Within subsequent drying cycles the particle was typically slightly slower in depleting soil moisture gradients than the Richards model. Test simulations confirmed that the likely reason for this is the fact that gravity-driven flow in the Richards model is slightly faster than in the particle model. This reason is consistent with our finding that these differ-ences are larger in the fast-draining sandy soil with low re-tention properties than in the more fine-grained soils.
5.2 Learning about inherent assumption and stepping beyond limitations of the Richards approach Alternatively, we tested a less computationally demanding approach, assuming only 10 or 20 % of the fastest particles to be mobile, while treating the remaining particles located in smaller pores sizes as immobile. In the cases of the sandy soil and the silty soil, a mobile fraction of 0.1 or 0.2 revealed results almost identical to the full mobility model. In the fine porous Calcaric Regosol, the differences between the full mobility model and the model operated at a mobile fraction of 0.1 were slightly stronger. The mobile fraction mode was generally less dispersive then the full mobility model and, in particular, in better accordance with the Richards solver for all simulation experiments. Our simulations hence provide clear evidence that 90 % of the water stored in fine porous co-hesive soils does not contribute to rainfall-driven soil ture dynamics but rather accumulates an immobile soil mois-ture stock.
In this context we also compared the cases of perfect mixing and no mixing between mobile and immobile wa-ter particles between different time steps (as explained in Sect. 2.4.2). The second option was clearly superior with re-spect to matching simulations with a Richards solver, while
the other yielded strong differences. We can thus state that the particle model is a suitable tool to “unmask” (a) inherent implications of the Darcy–Richards concept on the fraction of soil water that actually contributes to soil water dynam-ics and (b) the inherent very limited degrees of freedom for mixing between mobile and immobile water fractions. Our findings suggest, furthermore, that the idea of two separate water worlds – one supplying runoff and the other supplying transpiration, which is advocated in Brooks et al. (2010) – is a somewhat naive interpretation of soil physics and the inher-ently low degrees of freedom water to mix across pores size fractions.
In a real-world benchmark, the particle model again matched simulations with the Richards solver very well. However, both models clearly overestimated topsoil wetting compared to observations, as well as underestimating wet-ting at 10 cm at the end of the simulation. An asset of the particle-based approach is that the assumption of local equi-librium equation during infiltration may be easily ignored. Specifically, we did this to test the idea whether bypassing of a fast water fraction may explain the model bias in the topsoil. To this end, infiltrating event water particles were treated as a second particle type which initially travels in a mainly gravity-driven manner in the largest pore fraction at maximum drift and yet slowly mix with the pre-event wa-ter particles within a characwa-teristic mixing time. Simulations with the particle model in the non-equilibrium mode per-formed evidently distinctly different in the topsoil, and were rather sensitive to the diffusion coefficientDmix describing mixing of event water particles. When assumingDmixequal to the 40 % quantile of theD(θ )curve, the mixed water
frac-tion of the particle model was in good accordance with ob-served soil moisture changes at 0.025 and 0.1 m depths after the rainfall and at the end of the simulation period.
Our findings are in line with the early findings of Ewen (1996b). The diffusive mixing term parameter
Dmix is perhaps easier to interpret than the λ parameter
Ewen (1996b) introduced to account for displacement of old water by new water particles, notwithstanding that displace-ment of pre-event water seems to play a key role in feeding macropore flow (Klaus et al., 2013, 2014). Contrary to the exponential mixing term Davis and Beven (2012) introduced to stop rapid flow in the multiple interacting pathways model, we used a uniform distribution which maximises entropy of the mixed particles (Klaus et al., 2015).
5.3 Conclusions and outlook
drawback is the required high density of particles, arising from the small ratio of event water to pre-event water in soil, which might become a challenge when working in larger do-mains and several dimensions. However, due to its simplicity the model is straightforward to implement on a parallel com-puter.
However, compared to the Richards solver, the approach has slight deficiencies during long-term drainage phases, particularly in coarse-grained, fast-draining soils. One may hence find an adaptive model structure to be favourable. Dur-ing radiation-driven conditions when water flow is slow and in local equilibrium, it is favourable to use to a Richards solver, because it works well and is much more computa-tionally efficient and the treatment of, for instance, root water uptake is much more straightforward. During rainfall-driven conditions, when time stepping needs to be in the order of minutes, due to the characteristic timescale of changes in rainfall intensity, we recommend to switch to the particle ap-proach, particularly also because the implementation of fast non-equilibrium infiltration and the separation of event and pre-event water is straightforward, for instance compared to a non-local formulation of the Richards equation (Neuweiler et al., 2012). In line with Ewen (1996), we hence regard particle-based models as particularly promising to deal with preferential transport of solutes (optionally also heat) and to explore transit time distributions in a forward mode.
We are aware that the evidence we provided here is a somewhat tentative first step to corroborate the flexibility of the particle-based approach to include non-equilibrium flow and matrix flow in the same stochastic, physical framework. A much more exhaustive treatment of this issue is provided in a forthcoming study which presents and extension of the concept to a two-dimensional domain with topologically ex-plicit macropores and the test of concurring hypothesis to represent infiltration into macropores as well as macropore matrix interactions.
Acknowledgements. This study contributes to and greatly benefited from the “Catchments As Organized Systems” (CAOS) research unit. We sincerely thank the German Research Foundation (DFG) for funding (FOR 1598, ZE 533/9-1). The authors acknowledge support by the Deutsche Forschungsgemeinschaft and the Open Access Publishing Fund of Karlsruhe Institute of Technology (KIT). The code, the data and the simulation projects underlying this study are freely available on request. We gratefully thank the three anonymous reviewers for their thoughtful comments, which were very helpful for improving the proposed model approach.
The article processing charges for this open-access publication were covered by a Research
Centre of the Helmholtz Association.
Edited by: A. Guadagnini
Reviewed by: three anonymous referees
References
Beven, K. and Germann, P.: Macropores and water flow in soils revisited, Water Resour. Res., 49, 3071–3092, doi:10.1002/wrcr.20156, 2013.
Brooks, J. R., Barnard, H. R., Coulombe, R., and McDonnell, J. J.: Ecohydrologic separation of water between trees and streams in a mediterranean climate, Nature Geosci., 3, 100–104, doi:10.1038/ngeo722, 2010.
Bronstert, A., Creutzfeldt, B., Graeff, T., Hajnsek, I., Heistermann, M., Itzerott, S., Jagdhuber, T., Kneis, D., Lueck, E., Reusser, D., and Zehe, E.: Potentials and constraints of different types of soil moisture observations for flood simulations in headwa-ter catchments, Nat. Hazards, 60, 879–914, doi:10.1007/s11069-011-9874-9, 2012.
Davies, J. and Beven, K.: Comparison of a multiple inter-acting pathways model with a classical kinematic wave subsurface flow solution, Hydrol. Sci. J., 57, 203–216, doi:10.1080/02626667.2011.645476, 2012.
Delay, F. and Bodin, J.: Time domain random walk method to simulate transport by advection-dispersion and matrix diffu-sion in fracture networks, Geophys. Res. Lett., 28, 4051–4054, doi:10.1029/2001gl013698, 2001.
Dentz, M., Gouze, P., Russian, A., Dweik, J., and Delay, F.: Dif-fusion and trapping in heterogeneous media: An inhomogeneous continuous time random walk approach, Adv. Water Resour., 49, 13–22, doi:10.1016/j.advwatres.2012.07.015, 2012.
Dingman, S. L.: Physical hydrology, McMillan, New York, 575 pp., 1994.
Elfeki, A. M. M., Uffink, G. J. M., and Lebreton, S.: Simulation of solute transport under oscillating groundwater flow in homoge-neous aquifers, J. Hydraul. Res., 45, 254–260, 2007.
Ewen, J.: ’Samp’ model for water and solute movement in unsat-urated porous media involving thermodynamic subsystems and moving packets .2. Design and application, J. Hydrol., 182, 195– 207, doi:10.1016/0022-1694(95)02926-5, 1996a.
Ewen, J.: ’Samp’ model for water and solute movement in un-saturated porous media involving thermodynamic subsystems and moving packets .1. Theory, J. Hydrol., 182, 175–194, doi:10.1016/0022-1694(95)02925-7, 1996b.
Gayler, S., Woehling, T., Grzeschik, M., Ingwersen, J., Wize-mann, H.-D., Warrach-Sagi, K., Hoegy, P., Attinger, S., Streck, T., and Wulfmeyer, V.: Incorporating dynamic root growth en-hances the performance of noah-mp at two contrasting win-ter wheat field sites, Wawin-ter Resour. Res., 50, 1337–1356, doi:10.1002/2013wr014634, 2014.
Gerke, H. H. and Van Genuchten, M. T.: A dual-porosity model for simulating the preferential movement of water and solutes in structured porous-media, Water Resour. Res., 29, 305–319, 1993. Graeff, T., Zehe, E., Blume, T., Francke, T., and Schröder, B.: Pre-dicting event response in a nested catchment with generalized linear models and a distributed watershed model, Hydrol. Pro-cess., 26, 3749–3769, doi:10.1002/hyp.8463, 2012.
Hassanizadeh, S. M., Celia, M. A., and Dahle, H. K.: Dynamic ef-fect in the capillary pressure-saturation relationship and its im-pacts on unsaturated flow, Vadose Zone J. 1, 38–57, 2002. Holden, P. A. and Fierer, N.: Microbial processes in the vadose
zone, Vadose Zone J., 4, 1–21, 2005.
Jury, W. A.: Simulation of solute transport using a transfer function model Water Resources Res., 18, 363–368, 1982.
Kitanidis, P. K.: Particle-tracking equations for the solution of the advection-dispersion equation with variable-coefficients, Water Resour. Res., 30, 3225–3227, doi:10.1029/94wr01880, 1994. Klaus, J. and Zehe, E.: Modelling rapid flow response of a tile
drained field site using a 2d-physically based model: Assessment of “equifinal” model setups, Hydrol. Process., 24, 1595–1609, doi:10.1002/hyp.7687, 2010.
Klaus, J. and Zehe, E.: A novel explicit approach to model bro-mide and pesticide transport in connected soil structures, Hy-drol. Earth Syst. Sci., 15, 2127–2144, doi:10.5194/hess-15-2127-2011, 2011.
Klaus, J., Zehe, E., Elsner, M., Kulls, C., and McDonnell, J. J.: Macropore flow of old water revisited: Experimental insights from a tile-drained hillslope, Hydrol. Earth Syst. Sci., 17, 103– 118, doi:10.5194/hess-17-103-2013, 2013.
Klaus, J., Zehe, E., Elsner, M., Palm, J., Schneider, D., Schroeder, B., Steinbeiss, S., van Schaik, L., and West, S.: Controls of event-based pesticide leaching in natural soils: A systematic study based on replicated field scale irrigation experiments, J. Hydrol., 512, 528–539, doi:10.1016/j.jhydrol.2014.03.020, 2014. Klaus, J., Chun, K. P., McGuire, K. J., and McDonnell, J. J.:
Tempo-ral dynamics of catchment transit times from stable isotope data, Water Resour. Res., 51, 4208–4223, doi:10.1002/2014wr016247, 2015.
Kleidon, A. and Renner, M.: A simple explanation for the sensitiv-ity of the hydrologic cycle to surface temperature and solar radi-ation and its implicradi-ations for global climate change, Earth Syst. Dynam., 4, 455–465, doi:10.5194/esd-4-455-2013, 2013a. Kleidon, A. and Renner, M.: Thermodynamic limits of hydrologic
cycling within the earth system: Concepts, estimates and implica-tions, Hydrol. Earth Syst. Sci., 17, 2873–2892, doi:10.5194/hess-17-2873-2013, 2013b.
Koehler, B., Zehe, E., Corre, M. D., and Veldkamp, E.: An inverse analysis reveals limitations of the soil-CO2profile method to cal-culate CO2production and efflux for well-structured soils, Bio-geosciences, 7, 2311–2325, doi:10.5194/bg-7-2311-2010, 2010. Koehler, B., Corre, M. D., Steger, K., Well, R., Zehe, E., Sueta, J. P., and Veldkamp, E.: An in-depth look into a tropical lowland forest soil: Nitrogen-addition effects on the contents of N2O, CO2and CH4and N2O isotopic signatures down to 2-m depth, Biogeochemistry, 111, 695–713, doi:10.1007/s10533-012-9711-6, 2012.
Lee, H., Zehe, E., and Sivapalan, M.: Predictions of rainfall-runoff response and soil moisture dynamics in a microscale catchment using the CREW model, Hydrol. Earth Syst. Sci., 11, 819–849, doi:10.5194/hess-11-819-2007, 2007.
Loos, M. and Elsenbeer, H.: Topographic controls on overland flow generation in a forest – an ensemble tree approach, J. Hydrol., 409, 94–103, doi:10.1016/j.jhydrol.2011.08.002, 2011. Martinez-Carreras, N., Udelhoven, T., Krein, A., Gallart, F., Iffly,
J. F., Ziebel, J., Hoffmann, L., Pfister, L., and Walling, D. E.: The use of sediment colour measured by diffuse reflectance spectrometry to determine sediment sources: Application to the attert river catchment (Luxembourg), J. Hydrol., 382, 49–63, doi:10.1016/j.jhydrol.2009.12.017, 2010.
Michalak, A. M. and Kitanidis, P. K.: Macroscopic behavior and random-walk particle tracking of kinetically sorbing solutes,
Wa-ter Resour. Res., 36, 2133–2146, doi:10.1029/2000wr900109, 2000.
Mualem, Y.: A new model for predicting the hydraulic conductivity of unsaturated porous media, Water Resour. Res., 12, 513–522, 1976.
Neuweiler, I., Erdal, D., and Dentz, M.: A non-local richards equa-tion to model unsaturated flow in highly heterogeneous media under nonequilibrium pressure conditions, Vadose Zone J., 11, doi:10.2136/vzj2011.0132, 2012.
Plate, E., and Zehe, E.: Hydrologie und Stoffdynamik kleiner Einzugsgebiete: Prozesse und Modelle, Schweizerbart’sche Ver-lagsbuchhandlung (Nägele u. Obermiller), 366 pp., 2008. Roth, K. and Hammel, K.: Transport of conservative chemical
through an unsaturated two-dimensional miller-similar medium with steady state flow, Water Resour. Res., 32, 1653–1663, 1996. Saco, P. M., Willgoose, G. R., and Hancock, G. R.: Eco-geomorphology of banded vegetation patterns in arid and semi-arid regions, Hydrol. Earth Syst. Sci., 11, 1717–1730, doi:10.5194/hess-11-1717-2007, 2007.
Schierholz, I., Schafer, D., and Kolle, O.: The weiherbach data set: An experimental data set for pesticide model testing on the field scale, Agr. Water Manage., 44, 43–61, doi:10.1016/s0378-3774(99)00083-9, 2000.
Šim˚unek, J., Jarvis, N. J., van Genuchten, M. T., and Gärdenäs, A.: Review and comparison of models for describing non-equilibrium and preferential flow and transport in the vadose zone, J. Hydrol., 272, 14–35, 2003.
Tietjen, B., Jeltsch, F., Zehe, E., Classen, N., Groengroeft, A., Schif-fers, K., and Oldeland, J.: Effects of climate change on the cou-pled dynamics of water and vegetation in drylands, Ecohydrol-ogy, 3, 226–237, doi:10.1002/eco.70, 2010.
Turner, D. D., Wulfmeyer, V., Berg, L. K., and Schween, J. H.: Water vapor turbulence profiles in stationary continental convec-tive mixed layers, J. Geophys. Res.-Atmos., 119, 11151–11165, doi:10.1002/2014jd022202, 2014.
Uffink, G., Elfeki, A., Dekking, M., Bruining, J., and Kraaikamp, C.: Understanding the non-gaussian nature of linear reactive so-lute transport in 1d and 2d, Transport in Porous Media, 91, 547– 571, doi:10.1007/s11242-011-9859-x, 2012.
van Genuchten, M. T.: A closed-form equation for predicting the hydraulic conductivity of unsaturated soils., Soil Sci. Soc. Am. J., 44, 892–898, 1980.
van Schaik, N. L. M. B., Bronstert, A., de Jong, S. M., Jetten, V. G., van Dam, J. C., Ritsema, C. J., and Schnabel, S.: Process-based modelling of a headwater catchment in a semi-arid area: The influence of macropore flow, Hydrol. Process., 28, 5805– 5816, doi:10.1002/hyp.10086, 2014.
Vogel, H. J., Cousin, I., Ippisch, O., and Bastian, P.: The dominant role of structure for solute transport in soil: Experimental evi-dence and modelling of structure and transport in a field exper-iment, Hydrol. Earth Syst. Sci., 10, 495–506, doi:10.5194/hess-10-495-2006, 2006.
Wienhöfer, J. and Zehe, E.: Predicting subsurface stormflow re-sponse of a forested hillslope – the role of connected flow paths, Hydrol. Earth Syst. Sci., 18, 121–138, doi:10.5194/hess-18-121-2014, 2014.
at the hillslope scale, Hydrol. Earth Syst. Sci., 13, 1145–1161, doi:10.5194/hess-13-1145-2009, 2009.
Wrede, S., Fenicia, F., Martinez-Carreras, N., Juilleret, J., Hissler, C., Krein, A., Savenije, H. H. G., Uhlenbrook, S., Kavetski, D., and Pfister, L.: Towards more systematic perceptual model de-velopment: A case study using 3 luxembourgish catchments, Hy-drol. Process., 29, 2731–2750, doi:10.1002/hyp.10393, 2015. Zehe, E., Maurer, T., Ihringer, J., and Plate, E.: Modelling water
flow and mass transport in a loess catchment, Phys. Chem.-Earth, 26, 487–507, doi:10.1016/S0378-3774(99)00083-9, 2001. Zehe, E., Elsenbeer, H., Lindenmaier, F., Schulz, K., and Bloschl,
G.: Patterns of predictability in hydrological threshold systems, Water Resour. Res., 43, W07434, doi:10.1029/2006wr005589, 2007.
Zehe, E., Blume, T., and Blöschl, G.: The principle of ‘maximum energy dissipation’: A novel thermodynamic perspective on rapid water flow in connected soil structures, Phil. Trans. R. Soc. B, 365, 1377–1386, doi:10.1098/rstb.2009.0308, 2010a.
Zehe, E., Graeff, T., Morgner, M., Bauer, A., and Bronstert, A.: Plot and field scale soil moisture dynamics and subsurface wetness control on runoff generation in a headwater in the ore mountains, Hydrol. Earth Syst. Sci., 14, 873–889, doi:10.5194/hess-14-873-2010, 2010b.
Zehe, E., Ehret, U., Blume, T., Kleidon, A., Scherer, U., and West-hoff, M.: A thermodynamic approach to link self-organization, preferential flow and rainfall-runoff behaviour, Hydrol. Earth Syst. Sci., 17, 4297–4322, doi:10.5194/hess-17-4297-2013, 2013.
Zehe, E., Ehret, U., Pfister, L., Blume, T., Schröder, B., Westhoff, M., Jackisch, C., Schymanski, S. J., Weiler, M., Schulz, K., All-roggen, N., Tronicke, J., van Schaik, L., Dietrich, P., Scherer, U., Eccard, J., Wulfmeyer, V., and Kleidon, A.: HESS Opinions: From response units to functional units: a thermodynamic rein-terpretation of the HRU concept to link spatial organization and functioning of intermediate scale catchments, Hydrol. Earth Syst. Sci., 18, 4635–4655, doi:10.5194/hess-18-4635-2014, 2014. Zimmermann, A., Schinn, D. S., Francke, T., Elsenbeer, H., and