Simulations of multipurpose water availability in a semi-arid catchment
under different management strategies
Julien Burte
a,b,c,d,*
, Jean-Yves Jamin
b, Anne Coudrain
a, Horst Frischkorn
c, Eduardo Sa´vio Martins
d aIRD, Great Ice (UR IRD 032), CC 57, University of Montpellier 2, 34095 Montpellier, FrancebCIRAD, UMR G-EAU, F-34398 Montpellier, France
cUFC, Department of Hydraulic and Environmental Engineering, Federal University of Ceara´, Fortaleza, Brazil dFUNCEME, Department of Hydrology, Fortaleza, Brazil
1. Introduction
The Brazilian Northeast (750,000 km2, 51 million inhabitants) is
a semi-arid region with a rainfall of less than 700 mm yr1and
potential evapo-transpiration (ETP) greater than 2000 mm yr1).
The high annual rainfall deficit is accentuated by a short rainy season (3 months) and strong irregularity in rainfall distribution. The spatial and temporal heterogeneity of precipitation combined with shallow soils overlying crystalline rocks, and high evapora-tion lead to intermittent river flow with a mean duraevapora-tion of less than 3 months (Cadier, 1993, 1996).
In order to adapt to this restricted water availability, the inland colonization of the Northeast, which started in the 1650s, has been guided by the river systems that constitute open paths and allow water access to the riverbed itself or to the related alluvial aquifer.
Indeed, during the dry season, open dug wells provided the cattle and human water supply (Molle, 1994). The land tenure of the small watersheds in Ceara´ State was, as a consequence, generally organized into narrow bands perpendicular to the river, allowing every landowner access to the riverbed.
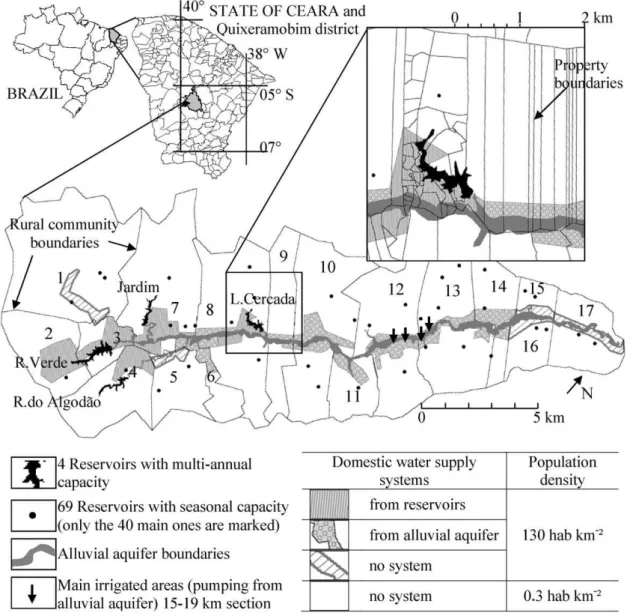
The Forquilha catchment illustrates this pattern, with some fields as narrow as 50 m along the river and as long as 6 km perpendicular to it (Fig. 1). Since 1998, the drilling of wells has resulted in the extraction of groundwater from the alluvial aquifer for irrigated crops, whose surface area has increased by 75 ha from 1998 to 2007. Even if this figure is small when compared to the 1000 ha of traditional rain-fed agriculture (beans, maize, and forage crops in the region in general;IBGE, 2004), it still has had an important impact on water requirements.
The pressure on water resources is indeed increasing and whether or not water availability can be sustainable is an open question. Support policies for participative water resources management are lacking. This results in strong individualism (Molle, 1994) and in a lack of social links among the different water territories within the same watershed (Tonneau and Caron, 2006).
Agricultural Water Management 96 (2009) 1181–1190
A R T I C L E I N F O
Article history: Received 23 June 2008 Accepted 9 March 2009
Keywords: Water management Alluvial aquifer Semi-arid Scenarios Modelling Multipurpose use
A B S T R A C T
In the semi-arid Brazilian Northeast, the exploitation of alluvial aquifers for irrigation and domestic supply to rural communities over the last 10 years has upset the traditional mechanisms of water resources management. In the Forquilha watershed (221 km2; 5
81700S, 3983000W), the two main water resources are reservoirs (with a capacity exceeding 0.9–6.7106m3), used for domestic water supply only, and an alluvial aquifer (2.3106m3), used for irrigation and domestic water supply. From 1998 to 2006, the irrigated area with alluvial groundwater increased from 0 to 75 ha, and the fraction of population supplied through domestic water networks, using reservoirs and the aquifer, increased from 1% to 70%. Based on physical and socioeconomic issues, three main water territories have been defined (‘‘Aquifer’’, ‘‘Reservoirs’’, and ‘‘Disperse Habitat’’). Considering the next 30 years with a realistic population growth, three hypotheses regarding irrigated area (i.e., 0, 75, or 150 ha), and several possible water-management scenarios, hydrological balance models were built and used to simulate the different impacts on water resource availability and salinity. Simulation results showed that, in all cases, releases from the upstream main reservoir are necessary to keep reservoir salinity below 0.7 g L1and for guaranteeing domestic needs in the whole watershed. As a consequence, a management approach that takes into account the interrelations among the three territories is necessary. Moreover, the simulations showed that the area of irrigated fields cannot exceed the current extent (75 ha), or serious restrictions on water availability and salinity will take place. Moreover, important socioeconomic problems are expected, including a high cost of palliative water supply with tank trucks from external sources.
ß2009 Elsevier B.V. All rights reserved.
* Corresponding author at: FUNCEME, Av. Rui Barbosa 1246, 60115-221 Fortaleza, Ceara´, Brazil. Tel.: +55 85 88 19 26 92; fax: +55 85 31 01 10 93.
E-mail address:[email protected](J. Burte).
Contents lists available atScienceDirect
Agricultural Water Management
j o u r n a l h o m e p a g e : w w w . e l s e v i e r . c o m / l o c a t e / a g w a t
Finally, because of the inter-annual climatic variability, during droughts, the rural population is highly dependent on local authorities to provide domestic water by tank trucks.
To provide stakeholders and local authorities with the elements of discussion on the possible options for managing the Forquilha valley water resources, different scenarios have been built using socioeconomic and hydrological data. Taking into account these two aspects is a growing trend for helping to discuss and assess water allocation in watersheds (Jakeman and Letcher, 2003; Liu et al., 2007; Mainuddin et al., 2007).
In the Forquilha case, the main factors considered in building such scenarios are (1) socio-political and economic factors; (2) hydrological factors (seasonal dynamics of the alluvial aquifer, salinity, sensitivity to anthropogenic actions, and relations between upstream reservoirs and downstream aquifer); and (3) interference from multiple uses on the different resources.
The objective of the present study was to evaluate water availability for different users and different uses within the whole Forquilha watershed (221 km2) for the next 30 years, according to
different possible future evolutions of irrigated crops (the main water consumers). The study has three specific constituents. First is the characterization of the different water resources (amount,
salinity, and variability) and the development of the related hydrological models, the different uses and users, and the main constraints (physical, socio-political, and economic) on water resources management. Second is the development of evolution scenarios for the next 30 years, assuming growing domestic water supply needs (SRH, 1992) and different assumptions about the evolution of the irrigated field area. Also, taken into consideration are possible water transfers among different regions within the watershed (e.g., release from the upstream reservoirs to the river that may feed the downstream aquifer). Third is the simulation, based on a 30-year rainfall series, of the impacts of the above scenarios on how well needs are met for water resources availability and reservoir quality (volume and salinity) and in aquifer volume for main user categories, taking into account a realistic climatic variability.
2. Study area and historical evolution of the water resources
The Forquilha catchment is occupied by 17 villages and their community territory (Fig. 1). During the period 1998–2007, the annual flow duration ranged from 0 to 7 months (average: 3 months).
At present, there are four types of water resources used for domestic and economic uses. Three are internal: reservoirs, an alluvial aquifer (storing runoff water) and cisterns (collecting rainfall water from the house roofs); and one is external: water brought from other catchments by tank trucks provided by the state authorities in case of necessity for domestic uses during severe droughts.
There are many reservoirs in the Forquilha catchment. There are sixty-nine annual reservoirs that are well distributed over the 17 communities (see dot points inFig. 1;Table 1); they fill and empty every year; capacity of each ranges from 0.05106to 0.3106m3
for a total capacity approaching less than 106m3. There are four
over-year reservoirs with a total capacity of about 10106m3
(Table 1), the biggest one is the Riacho Verde Reservoir (6.7106m3). They are located in the upper part of the catchment
(Fig. 1). Salinity is often less than 0.4 g L1; however, the impact of
evaporation may strongly increase this value up to 3 g L1during
the dry season. Upstream populations preferentially use these four main reservoirs. Cisterns provide very low-salinity water and are an auxiliary resource for domestic use for 5–45% of the families, depending on the community.
The alluvial aquifer covers about 6 km2(23 km by 250 m) with a
mean depth of alluviums of 6.8 m. At the end of the rainy season, the water table lies about 2.8 m below the soil surface and with a saturated height of 4 m. The groundwater volume is about 2.3106m3. The main inflow to the aquifer originates from the
intermittent river (Burte et al., 2005). Alluvial aquifer groundwater is essentially used in the downstream part of the watershed, traditionally by riparian landholders for forage crops with roots that use water directly and for cattle and domestic uses by digging holes in the riverbed (Ribeyre, 2006; Fabre and Burte, 2007). It has a higher salinity (mean value of 0.7 g L1,Table 1) than the river
water. This difference testifies to other inputs of saline water: a permanent input from the saline basement hard-rock aquifer, and an occasional input from the flush back of water from the unsaturated zone, where salt is accumulated by evaporation close to the soil surface (Coudrain et al., 2001; Burte, 2008). A great number of wells (180) have been drilled since 1998, allowing
intensive water-related activities during both dry and rainy seasons. Crop irrigation utilized 95% of the water withdrawal between 2000 and 2007, which benefited 5% of the families in the watershed. The remaining 5% of the available water was used for domestic water supply, which benefited 70% of the families in the watershed (Ribeyre, 2006). Intense pumping leads to progressive, locally accentuated depression of the water table (reaching about 2 m) and influences alluvial groundwater salinity dynamics, making it locally unsuitable for traditional uses or irrigation. This outcome leads farmers to limit and sometimes even to stop irrigation at the end of the dry season when the water table is too low and/or the water salinity too high.
Therefore, the crucial question is as follows: Is it possible to satisfy pumping requirements for irrigation, restricted to few farmers (landholders), while securing water access to the riverbed for poor landholders and landless farmers without pumping facilities, while guaranteeing a continuous domestic supply (Table 2)?
3. Data and methods
3.1. Hydrological characterization of Forquilha watershed
For this study, monthly rainfall data were needed for the simulations over 30 years. The data used were the mean values from the two closest rain gauges of the Brazilian monitoring network with the longest time in operation (1977–2007). They are located in Manituba and Sa˜o Miguel, 8 km northeast and 5 km southwest of the study area, respectively.
SPOT5 images with 10 m resolution (10/2002 and 07/2003) were used to map the watershed and the alluvial sediment boundaries and to estimate the surface area of the reservoirs. Water level and electric conductivity were monitored in the four over-year reservoirs (03/2003 to 06/2007) and in 20 piezometers located along the alluvial aquifer (09/2000 to 06/2007). Discharge rate and flow routing in the river were monitored during three events of release from the R. Verde reservoir in 2003, 2004, and 2005. These data have been used to calibrate the models.
3.2. Characterization of uses, users, and water-management constraints
A water resources typology was undertaken in two steps. The first step was based on interviews and semi-directive surveys carried out in 15 of the 17 watershed communities, from July to September 2005 (Ribeyre, 2006). These investigations identified the main groups of water users, types of uses, perceptions about water resources, and criteria for using and managing water resources. The results were compared with qualitative and quantitative socioeconomic data, collected over a two-month period from July to August 1998 with a questionnaire covering 1024 households (99% of the population). The second step was conducted in six communities (no. 3, 7, 10, 12, 13, and 17 inFig. 1). Multiple-choice questionnaires, records, and analysis grids were
Table 1
Present types of water resources in Forquilha watershed.
Name Max capacity (m3) Annual usable volume of water (m3) Surface area (m2) Salinity range (g L1) Location (Fig. 1) Four multiyear reservoirs
R. Verde 67105 5.7105 8105 0.14–0.38 2 and 3
R. Algoda˜o 8.7105 2.1105 1.6105 0.09–0.25 4
Jardim 9.7105 2.1105 1.8105 0.09–0.28 7
L. Cercada 13105 1.3105 3.1105 0.07–0.35 8
69 annual reservoirs <10105 – <1105 >0.05 1–17
90 Cisterns 9102 9
102 – 0.05–0.15 1–17
Alluvial aquifer 2.3106 1
106 6
106 0.1–2 Mean value 0.7 Mainly in 12 and 13
Tank trucks 30 L day1capita1 1–17
Table 2
Present types of needs of water resources in Forquilha watershed.
Name Mean annual water
requirement (m3)
Max salinity (g L1)
Location (Fig. 1)
‘‘Reservoirs’’ territory
Domestic water 57103 <0.7 2, 3, 4,7,8
Cattle water 13103 <5
‘‘Aquifer’’ territory
Domestic water 43103 <0.7
Cattle water 22103 <5 5,6,7, 9–14
irrigated fields (75 ha) 1106 <1.2 ‘‘Disperse habitat’’ territory
Domestic water 13103 <0.7 1–17
Cattle water 23103 <5 1–17
used in order to highlight and quantify the individual and collective water-management modes.
Finally, these data were completed by observations and data collected since 1998 through discussions with internal and external stakeholders, including politicians. From these data, satisfaction criteria and constraints on resources exploitation were defined and are further used to discuss scenario impacts on resource availability and uses/user satisfaction.
3.3. Scenario building
Selected scenarios should be both technically sound and socially useful so that they can be used to discuss the different management options with relevant stakeholders (Srdjevic et al., 2004; Mermet, 2005; Treyer, 2005). Here, the objective was to provide, through different simulations, some insight into the availability of the resources in terms of quantity and quality for the next 30 years, taking into account the assumption of a growing population and an unknown increase in the irrigated field area. Because variations in irrigated areas affect water availability much more than variations in population, three contrasted values were selected for irrigation level:
1.Irrigated area = 0 ha, corresponding to what prevailed before 1998. The water resources are only dedicated to domestic and cattle water supply, and all crops are rain fed.
2.Irrigated area = 75 ha, corresponding to the 2007 situation; pumping from the aquifer is necessary in communities 12 and 13 (Fig. 1) to ensure agricultural production and to assure survival of tree crops like guava.
3.Irrigated area = 150 ha, corresponding to a doubling of the 2007 irrigated area.
The simulations were based on the rainfall data for the 1977– 2007 period that includes some multiyear droughts leading to water supply collapse. In such situations, tank trucks provide a palliative domestic supply, using as reference a need of 30 L day1capita1. The cost, 5.4 US$ m3, is covered by the state
(Araujo et al., 2005).
It is now widely accepted that climate is changing worldwide (IPCC, 2007); however, in the studied area, the effects on local rainfall are still being debated (Christensen et al., 2007; Krol and Bronstert, 2007; Salazar et al., 2007). Thus, the results of the simulations presented below must be used knowing that the aridity could increase and aggravate the water needs in the Brazilian Northeast.
3.4. Modelling approach
To take into account the rainfall seasonality, a time step of one month was chosen. At each step, the needs of the population, cattle, and irrigation have to be computed. At each step, the water availability and salinity of the different water bodies—reservoirs, cisterns, and aquifer also have to be computed.
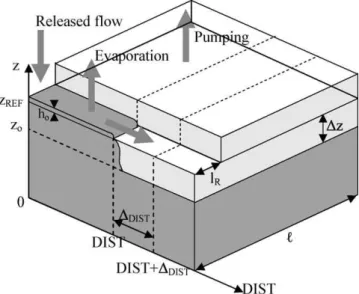
Three models were built to simulate the dynamics of the main hydrological resources (Fig. 2): (1) a hydrological balance (water and salt) model for reservoirs, in which evaporation is very high; (2) a hydrological model for the alluvial aquifer (Burte et al., 2005) with main recharge from stream flow in the minor riverbed (corresponding to flood and released discharged events from the R. Verde reservoir), which takes into account pumping and ground-water flow; and (3) a downstream discharge routing model for water release into the river from the R. Verde reservoir, allowing evaluation of its impact on alluvial aquifer recharge.
4. Results
4.1. Typology of water resources users and uses
From the analysis of the spatial variations of water resources, users, and uses, three different water territories were defined (Fig. 3) in conformity with ‘‘thoughts and actions are structured by water’’ (Tonneau and Caron, 2006). The ‘‘territories’’ as set up in this study conform closely to those perceived by the local people. Evident tensions exist among people in these territories about water transfer from one territory to another.
The ‘‘Reservoir’’ territory (40% of whole population) covers the area of the communities located upstream around the four main
Fig. 2.Hydrological models built and used in the study with monthly time step to simulate the time evolution of the water content and water salinity (1) of the reservoirs, (2) of the alluvial aquifer and (3) of the released discharge routing. Constraints due to social pressure are taken into account (4) in the flow released from reservoirs.
reservoirs of the catchment. All uses (drinking water, domestic water, cattle water) are supplied by community systems fed by these reservoirs. There is no local water supply alternative. These populations are poor, established on steep slope areas that are not very suitable either for agriculture or for cattle breeding.
The ‘‘Aquifer’’ territory (30% of whole population) accounts for downstream communities that meet water requirements (domes-tic water supply systems, irrigation, and cattle) by pumping from the alluvial aquifer. Irrigation exists only in this territory, and has been developed since 1998. The irrigated zones are located almost exclusively in the 15–19 km section downstream from the R. Verde reservoir (Fig. 1). Water from small reservoirs and cisterns is used only as drinking water.
The ‘‘Disperse Habitat’’ territory (30% of whole population) covers the area where the habitat is dispersed and small local resources (cisterns or small reservoirs) provide the water supply. The recharge of these cisterns or reservoirs occurs during the rainy season but is irregular: families must adapt their strategy for water supply throughout the year according to the available resources. During droughts, the access to water is recurrently problematic; water needs to be transported from remote resources such as over-year reservoirs or the alluvial aquifer, which is accessed through holes excavated in the riverbed. In this context, daily consumption in ‘‘Disperse Habitat’’ territory is only 30 L day1capita1, whereas
it is around 100 L day1capita1in the other two territories.
The water transfers between these ‘‘conceptual’’ territories are either natural or under control. The ‘‘natural flow’’ is the upstream–downstream flow related to flood events. The control transfers are related to the opening of the gates of the R. Verde. During the dry season, aquifer users put pressure on politicians to force upstream communities to accept water release from the R. Verde reservoir. This seasonal strain situation can degenerate into social conflicts. The upstream communities want to preserve ‘‘their’’ resources and do not accept releasing water unless the water level in the reservoir is quite high.
4.2. Hydrological models
4.2.1. Hydrological balance model of reservoirs
The hydrological balance model of reservoirs was developed at monthly time intervals taking into account main outflows (evaporation; seepage losses; released discharge; and pumping), and inflows (precipitation over the reservoir and runoff from upstream watersheds during the rainy season).
The water level–surface–volume relationships, described by VR =KHRaand SR =
a
KHRa1, were used to characterizeeach reservoir, where HR is water level, SR is water surface, VR is water volume, andKand
a
are two parameters related to depth– area–volume relationship of each reservoir obtained from a regional model (Molle and Cadier, 1992; Cadier, 1993). Data used to calibrate parameters was highest value of HR (measured in situ), HR and SR on 17/07/2003 (HR was measured and SR was obtained from the 10 m resolution SPOT5 image).In the semi-arid Northeast, runoff is the main recharge mechanism for reservoirs (Dubreuil, 1966; Dubreuil et al., 1968); it also generates the river flood events that are the main inflow into the alluvial aquifers (Burte et al., 2005). Because runoff data are needed in the simulations and they are not available for this watershed, runoff was evaluated from the Sudene/Orstom annual rainfall-runoff regional model (Molle and Cadier, 1992; Cadier, 1993) developed on the base of a regional study carried out on 165 small watersheds (Cadier, 1993). For every watershed, a characteristic runoff depth (RD600) has been calculated according
to geomorphologic, vegetation, and soil parameters for 600 mm annual rainfall. Next, for any annual rainfallP, runoff depth RD is estimated by RD = RD6001.4(P600)/100.
Volume losses by seepage have been neglected except for the L. Cercada reservoir, where seepage rates are known to be higher because they result in superficial flow downstream from the dam. They have been measured and vary from 15 to 30 L s1depending
on the water level in the reservoir.
Evaporation of reservoir water,E(mm), is linearly related to evapo-transpiration, ETP (mm), through a coefficient
b
, withE=
b
ETP (Cadier et al., 1992; Molle & Cadier, 1992; Cadier, 1993). Theb
coefficient has been calibrated from level curves observed in dry seasons over the 2003–2007 period (b
= 1.14).Verification of the reservoir model has been based on the simulation of the evolution of water salinity. Computed values were compared to observed values during the dry seasons of the 2003–2007 period. The R2 was 0.91 for runoff for the Cercada
reservoir and 0.96 for the R. Verde reservoir.
4.2.2. Hydrological balance model of alluvial aquifer
The hydrological balance model of the aquifer is detailed in
Burte et al., 2005. Simulations of flow and salt transport on a 1.5 km alluvial aquifer section have been carried out with the spatial, physically based model Feflow (WASY, 2005). Results corroborate that the main water inflow into the aquifer is related to flood events.
4.2.3. Hydrological balance model for released flow in riverbed
Recharge of the alluvial aquifer by water release from the reservoir is expected to be of major impact 15–19 km downstream from the R. Verde reservoir where irrigation is the most developed. A released flow routing model along the river was built to compute the time of release necessary to recharge the aquifer 15–19 km downstream from the R. Verde reservoir. Simulations were carried out for different discharge rates and pumping scenarios. Initial condition is the water level of the alluvial aquifer before recharge (zo). Part of released volume is consumed by pumping and by evaporation and does not contribute to raising the water table. Evaporated volume and pumping volume can be viewed as a function of distance from R. Verde reservoir (DIST). Evaporating rate in the riverbed is assumed to be 8 mm day1.
Then, during a time step
D
t, the released volumeVRcan be divided into three components: evaporated volume, pumping volume and ‘‘effective’’ volume (VEF). OnlyVEFcontributes to watertable rising (
D
z) and flood progression in the river from DIST to DIST +D
DIST(Fig. 4), as follows:VEF¼‘
r
D
DISTD
zþhoD
DIST ½lRþr
ð‘lRÞ:where ‘ is aquifer width,
r
is the aquifer porosity,D
z is the difference between the water level before recharge and the river bed level,lRis river width, andhois a parameter calibrated using three monitored release events occurring in 2003, 2004, and 2005 (Fig. 5).4.3. Evolution scenarios over 30 years
The objective of the scenarios is to project ahead for 30 years from 2007 (2007–2037) to discuss the availability of water resources. Because this availability depends on the rainfall scenario, we used an observed time series (1977–2007), which integrates a realistic distribution of dry and rainy spells.!decrier la` un minimum dure´e ‘‘over-year se´cheresse. . .comme c’est utilise apre`s.
Different hypotheses can be considered for the evolution of population. We chose the ‘‘growing’’ hypothesis following the observed 1998–2006 period trend (Fig. 6). Nevertheless, as already noticed since 2002 (Fig. 6), we chose a linearly decreasing growth rate of the number of families from 3% to 0% between 2007 and 2037. This may correspond to realistic conditions with land and pedo-climatic constraints. In any case, the growth rate is not
expected to have a significant influence on the results of the simulations, since only a small portion of the resources is used for domestic supply (Table 2).
In all of the simulations, population evolution is the same one (Fig. 6), growing from 974 to 1400 families (i.e., from 3500 to 5600 people) in 30 years and with increasing proportion of population having access to domestic supply (Fig. 6).
In the simulations, the domestic and drinking water require-ments are met with priority at each time step. The ‘‘Reservoir’’ territory is supplied by pumping from the four main over-year reservoirs, while the ‘‘Aquifer’’ territory is supplied by pumping from the alluvial aquifer. For the ‘‘Disperse Habitat’’ territory, the families supply themselves from high renewal rate resources or, when necessary, from the alluvial aquifer. In ‘‘Disperse Habitat’’ territory, because all water resources are small and used until exhaustion, management cannot improve water availability.
Simulations of release events have been carried out for the four over-year reservoirs. Results show that only the R. Verde reservoir can yield volumes and discharges sufficient to affect the alluvial
aquifer. Therefore, the simulations presented here refer only to releases from the R. Verde reservoir.
For all simulations, the following constraint was taken into account: pumping from reservoirs for domestic water supply systems is not possible if the volume is less than 15% of the reservoir capacity (a critical volume reserved for safeguarding the aquatic ecosystem and for acceptance for communities) and is not possible if water salinity is greater than 1.5 g L1.
In aquifer simulations, inflow into the aquifer, corresponding to results from the reservoir release simulations was taken into account. And, the following constraint was taken into account: pumping from the aquifer is possible for domestic supply and irrigation as long as the water height is higher than 2 m. This is in respect to the fact that when the aquifer water level drops, farmers stop pumping if the water level is deeper than 2.8 m below soil surface.
Families of the ‘‘Disperse Habitat’’ territory use annual reservoirs and sometimes the aquifer for all uses as long as the water level is less than 1.8 m below the soil surface.
4.4. Simulation results
In the ‘‘Reservoir’’ territory, monthly pumping from the reservoirs for domestic water supply ranges 0.4–1.2% of outflows for the R. Verde reservoir, and 0.8–2% of the R. Algoda˜o reservoir. Therefore, the pumping has a negligible influence on the
Fig. 4.Alluvial aquifer and river bed diagram, with main fluxes of hydrological balance during timeDt(released flow, evaporation, pumping), resulting in aquifer recharge along distanceDDIST. ‘is aquifer width,lRis river width,Dz is the difference between the water level before recharge (zo) and the river bed level (zREF).
Fig. 5.Simulated (solid line) and observed (circles) flood routing downstream from the R. Verde reservoir for a discharge event of 57 h (280 L s1during the first 20 h, then 140 L s1) occurred in 2004.
Fig. 6.Number of families vs time: during the observation period 1998–2006 the growth rate decreased from 6% to 3% and during the simulation period 2007–2037 the growth rate used decreases from 3% to 0%.
Table 3
Minimum continuous discharge rate (L s1) for river flows reach 15–19 km downstream.
Initial filling of alluvial aquifer (%) Scenario/Irrigated area (ha)
0 75 150
100% 30 50 70
75% 55 80 90
Table 4
Minimum discharge time (day) necessary to reach 15–19 km downstream in case of 75% initial water-filling of alluvial aquifer, for different scenarios and discharge rates.
Discharge rate (L s1) Scenario/Irrigated area (ha)
0 75 150
80 90 120 a
130 50 62 66
280 22 23 24
hydrological balance and dynamics of the reservoirs. For instance, mean pumping in the R. Verde reservoir is 1.3103m3month1
and represents, per family, a mean water consumption of 10 m3month1
. Evaporated volumes correspond to the main term of outflow from reservoirs, computed values range from 80103
to 250103m3month1.
Release discharge simulations from the R. Verde reservoir have been carried out (seeTables 3 and 4) for up to 280 L s1(maximum
discharge allowed by valve). The aim was to determine the release
characteristics (flow, duration and date in the year) necessary to recharge the alluvial aquifer down to the main pumping areas (section 15–19 km downstream R. Verde). Two hypotheses have been tested: (1) the release starts at the beginning of the dry period (i.e., highest levels of water in the alluvial aquifer) and ends with the onset of the rainy season; and (2) the release begins when water level drops below 3.8 m below soil surface, that is to say 1–3 months after the onset of the dry season. Results of the simulations show that if the release is continuous and starts when the alluvial aquifer is full, discharge rates of 50 L s1, and of 70 L s1 are
required to meet sufficient water to maintain continuous water flow in the river to 19 km from the water source and irrigation of 75 and 150 ha, respectively. In case of no irrigation, discharge rate less than 30 L s1is required to maintain the perennial water flow
19 km downstream. Discharge rates in the range 0–280 L s1have
been simulated for release starting when the aquifer is 75% full to evaluate the duration of release necessary to recharge the alluvial aquifer as far as 19 km downstream (Table 3). For the scenario ‘‘Present/75 ha’’, a continuous 80 L s1discharge during 120 days is
necessary to recharge 19 km of alluvial aquifer downstream. Simulations show that the higher the discharge rate, the lower the transit losses and the faster the water level rise (Fig. 7).
Discharge rates higher than 130 L s1lead to flooding of parts of
upstream fields, which is not allowed by landowners. Hence, simulations for 2007–2037 have been limited to the 0–130 L s1
range for the discharge.
Fig. 7.Scenario ‘present/75 ha’: results of four simulations for discharges rates from 20 to 280 L s1,with duration of release and distance reached by flow downstream from R. Verde reservoir. For the case of 20 L s1, even after 365 days of release, the computed flow only reaches 9 km downstream from the reservoir.
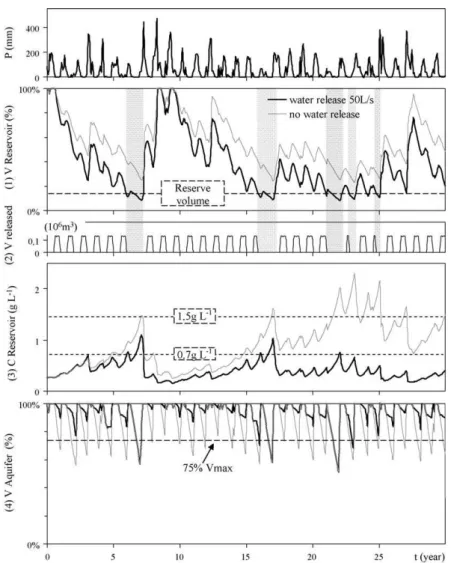
Fig. 8.Scenario ‘‘75 ha’’. Precipitations (30 years series) and results from 2 simulations (in black, with release of 50 L s1during 5 months; in grey, without release) (1) R. Verde (RV) volume of water (%); (2) released volumes (106m3) from RV; (3) RV salt concentration (g L1) and (4) volume of water in the alluvial aquifer (%). Horizontal dotted lines and outlined grey areas indicate critical values and periods.
4.4.1. Scenario ‘‘Present/75 ha’’ (Fig. 8)
During the 1989–1998 period, the populations of the ‘‘Reser-voir’’ territory did not allow releases from reservoirs in order to guarantee the availability of ‘‘their’’ water resource. With the hypothesis of ‘‘no release’’, simulations for 2007–2037 (Fig. 8) show that the reservoir volume always remains higher than the critical volume. They also show that salinity reaches the threshold of 0.7 g L1
in 6 out of 10 years for drinking water and irrigation and the threshold of 1.5 g L1in 1 out of 6 years for domestic water.
During over-year drought, the recharge to the R. Verde reservoir is insufficient during several consecutive years, leading to high value of water salinity. In this 30-year time series simulation, the quality of water remains poor for human consumption half of the time. The threshold of 1.5 g L1is exceeded during two long periods (23 and
15 months) during which water supply to the R. Verde commu-nities would require tank truck supply at an annual cost of 3000 US$. Water volume and salinity of the smaller reservoirs (R. Algoda˜o and Jardim) never exceed the limits for domestic uses because they have a higher renewal rate.
The alluvial aquifer has a seasonal dynamic and is entirely recharged in 9 out of 10 years. Nevertheless, without releases, water level decreases in 9 out of 10 years by more than 25%, leading farmers to adapt to the situation by decreasing the irrigated area at the end of the dry season. Moreover, water access to the alluvial aquifer is difficult for families in ‘‘Aquifer’’ and ‘‘Disperse Habitat’’ territories and for cattle. However, the domestic water supply
system is secure. In 1 out of 30 years, the water level decreases more than 50%. Consequently, irrigation stops and domestic uses are strongly limited. In contrast to the ‘‘Reservoir’’ territory, restrictions on supply are temporary (less than 3 consecutive months), so that there would be a limited duration for tank truck water supply by the State.
In the case of a management with releases from the R. Verde reservoir, two simulations have been made (Fig. 8), with discharge hypotheses of 50 L s1during 5 months in the dry season, and of
130 L s1during one month when the alluvial groundwater level
drops below 4.8 m below soil surface. There is no release if the volume of the R. Verde reservoir is lower than the critical level (15%).
With both discharge hypotheses, the volume of R. Verde drops below critical volume in 1 out of 3 years and 15% of the time. Salinity is lower than 0.7 g L1, 95% and 91% of the time for the 50
and 130 L s1 hypotheses, respectively. The reservoir volume is
insufficient to release water in 1 out of 10 years. The longest continuous period with an R. Verde volume below 15% is 11 consecutive months. Domestic water supply through tank trucks, leads to annual costs of 3.5103US$. For both discharge hypotheses, in 8 out of 10 years, the aquifer water resource is sufficient to satisfy domestic and agricultural requirements and is easily accessible, without pumping, for cattle and families of the ‘‘Disperse Habitat’’ territory. In 1 out of 10 years, quantitative restrictions appear for irrigation but not for domestic water supply.
In the case of severe over-year drought (once in 30 years), release from R. Verde is not possible because the water level is too low; consequently, the alluvial aquifer water volume decreases to less than 50%.
Seasonal release with 50 or 130 L s1 discharge rates for 5
months or 2 months, respectively, strongly improves the guarantee of water availability for irrigated areas of the territory ‘‘Aquifer’’ and maintains a low water salinity of R. Verde. However, the critical volume of the R. Verde reservoir is reached in one of three years, which can cause supply interruption to the reservoir communities.
4.4.2. Scenario ‘‘no irrigation/0 ha’’
The main result from this simulation is that the seasonal decrease of alluvial aquifer volume is only 10–20%, guaranteeing all uses in the ‘‘Aquifer’’ territory, even without release.
However, discharge from R. Verde is necessary to maintain low salinity in this water body. With 30 L s1seasonal discharge during
5 months, simulation shows that there is no seasonal reduction of the alluvial aquifer volume 99% of the time, which is particularly favourable for traditional agricultural uses (breeding, forage crops on the river banks) and domestic uses by the poorest populations (direct access to the aquifer in the riverbed). Resource availability (reservoirs or aquifer) for domestic supply is guaranteed 100% of the time for the aquifer and 98% of the time for the R. Verde reservoir.
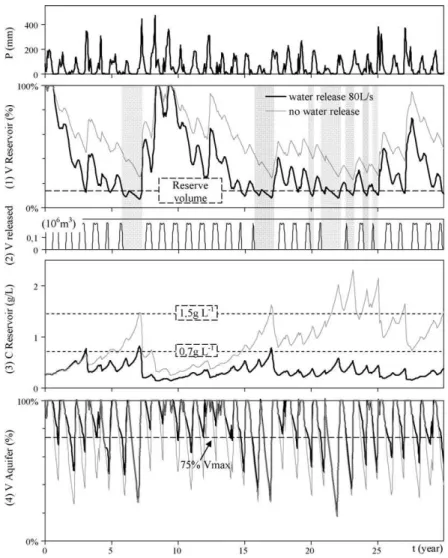
4.4.3. Scenario ‘‘irrigation doubled/150 ha’’ (Fig. 9)
If the irrigated area is 150 ha and if there is no release from the R. Verde reservoir, the alluvial aquifer level decreases to less than 50% of the maximum value 9 out of 10 years (Fig. 9). As a consequence, farmers would have to stop pumping for agricultural uses, and restrictions would strongly affect domestic uses in the territory ‘‘Aquifer’’. Thus, according to the simulations, this scenario should be rejected.
In case of a management with release from R. Verde, only discharge rates higher than 80 L s1during 5 months will recharge
the alluvial aquifer 19 km downstream, where the main irrigation area is located. With this mode of management, the R. Verde reservoir volume decreases below 15% in 1 out of 2 years and 25% of the months. Water salinity stays below 0.7 g L199% of the time.
The reservoir volume is insufficient to release enough water to recharge the aquifer in 2 of 10 years. The longest continuous period with an R. Verde volume below 15% is 17 consecutive months. Domestic water supply through tank trucks in this situation leads to annual costs of 17.5103US$. Aquifer volume drops below 50%
once in five years, restricting irrigation. Water access for the population of the ‘‘Disperse Habitat’’ territory and for cattle is very
difficult. The aquifer volume drops below 75% in two out of three years, requiring domestic water supply to ‘‘Aquifer’’ territory population through tank trucks at an annual cost of 12103US$.
5. Conclusions
Characterization of the physical environment was carried out in parallel to a study of uses and resource users in the Forquilha catchment. This approach allowed the design of relevant manage-ment scenarios for water resources exploitation and the construc-tion of simple hydrological models to simulate the impacts of those scenarios.
From the experience gained with the Forquilha watershed, the use of available formulas for small catchments of the semi-arid Northeast (Cadier, 1993) seems sufficient to characterize surface water resources within the framework of our modelling strategy. The minimum hydrological data necessary to our approach have to be provided; the monitoring of water level and salinity of main water resources during one year is necessary to characterize the dynamics (quality and quantity) of the alluvial aquifer and of reservoirs and to allow calibration of ‘‘Reservoir’’ and ‘‘Aquifer’’ models. One release event resulting in full alluvial aquifer recharge must also be monitored to calibrate the routing model.
The main result from the simulations is that seasonal releases from a large upstream reservoir (of a capacity of 6.7106m3) are
effective in maintaining reservoir salinity at a level compatible with a domestic water supply. Depending on discharge rates from the upstream reservoir and on scenarios, it is possible to recharge the alluvial aquifer downstream. Releases from small reservoirs (<1106m3) would not have any significant impact on alluvial
aquifer recharge far downstream from the reservoir.
The other main result concerns the computed results on the water resources availability as a function of the scenario of ‘‘irrigation’’.
For the ‘‘No irrigation’’ scenario, resource availability for domestic uses and cattle is maximum: 100% of the time for the ‘‘Aquifer’’ and ‘‘Disperse Habitat’’ territories and 98–100% of the time for the ‘‘Reservoir’’ territory (Table 5).
With the simulations of ‘‘Present/75 ha’’ scenario, current management practice effects are evaluated. In case of released discharge of 50 L s1during the dry season, water availability for
domestic uses is guaranteed 99% of the time for the territory ‘‘Aquifer’’ and 90–100% of the time for the ‘‘Reservoir’’ territory. For irrigation, water supply is guaranteed in 8 out of 10 years. Without release, irrigation in the territory ‘‘Aquifer’’ would be guaranteed only in 1 of 10 years: during the dry season, restrictions on irrigation would be imposed in 9 out of 10 years. This result emphasizes that the present situation with 75 ha irrigated cannot
Table 5
Results from simulations for 30 years (population increasing from 3900 to 5600 persons).
Conditions of simulations: Results of simulations (in bold when highly beneath desired):
Surface of irrigated fields Annual release from R. Verde
Mean annual cost for tank trucks (US$)
% time of satisfaction for domestic needs (% yrs)
% time of satisfaction of the irrigation needs (% yrs)
% time with volume of Verde>15% of its capacity (% yrs)
% time with salinity of R. Verde
<0.7 g L1(% months) Irrigated fields: 0 ha
0 L s1 88% – 100% 40%
30 L s1during 5 months 98% – 100% 86%
Irrigated fields: 75 ha
0 L s1 3000 40% 10% 100% 40%
50 L s1during 5 months 3500 70% 90% 70% 95%
130 L s1during 2 months 3500 70% 90% 70% 95%
Irrigated fields: 150 ha
0 L s1 0 10% 10% 100% 40%
80 L s1during 5 months 17500 30% 30% 50% 99%
be sustainable without negotiations on the discharge issue among the different communities and users.
Results from the simulation with the scenario ‘‘Irrigation doubled/150 ha’’ show that such irrigation growth is incompatible with priority uses, especially domestic uses. The consequence is that free extension of irrigated crops, as is currently observed and even encouraged by authorities, is unsustainable. To avoid future conflicts, irrigation extension should be restricted through negotiations between communities and irrigating farmers.
A participatory water management, integrating main related water resources, would be hydrologically effective and socially desirable; communities of both ‘‘Reservoir’’ and ‘‘Aquifer’’ terri-tories would benefit from it. To identify the best release strategy would allow maximization of resources availability for users, taking into account evaporated volumes from R. Verde, the need to recharge the alluvial aquifer, and the maintenance of good reservoir water quality and the guarantee of water quantity in R. Verde. However, this approach may result in a high social cost of conciliation work to guarantee acceptance by all categories of users.
The results from the different scenarios presented in this paper, showing clearly the risks if no coordination is put in place, are a basis for promoting discussions that include the different stakeholders. The forms to be adopted for such coordination, the installation of an official catchment committee, informal negotiations, and political mediation, will have to be defined with cooperation of the different stakeholders, but its necessity is clear.
Acknowledgements
The authors wish to thank the Centre International de Recherche Agronomique pour le De´veloppement (CIRAD), the Institut languedocien de recherche sur l’Eau et l’Environnement (IFR-ILEE) and the Franco Brazilian Capes-Cofecub program for their financial support to this research.
References
Araujo, J.C.d., Molinas, P.A., Lamartine Lea˜o Joca, E., Pacheco Barbosa, C., Souza Bemfeito, C.J.d., Carmo Belo, P.s.d., 2005. Custo de Disponibilizac¸a˜o e Distri-buic¸a˜o da A´gua por Diversas Fontes no Ceara´. Revista Econoˆmica do Nordeste 36, 281–307.
Burte, J., 2008. les petits aquiferes alluviaux dans les zones cristallines semi-arides: fonctionnement et strategies de gestion. Etude de cas dans le nordeste bre´silien. Universite´ Montpellier II et Universidade Federal do Ceara´, Montpellier (France) and Fortaleza (Brasil), pp. 193.
Burte, J., Coudrain, A., Frischkorn, H., Chaffaut, I., Kosuth, P., 2005. Human impacts on components of hydrological balance in an alluvial aquifer in the semiarid Northeast, Brazil. Hydrological Sciences Journal-Journal Des Sciences Hydro-logiques 50, 95–110.
Cadier, E., 1993. Hydrologie des petits bassins du Nordeste bre´silien semi-aride. Transposition a` des bassins non e´tudie´s. PhD Thesis. Universite´ Montpellier 2, pp. 404.
Cadier, E., 1996. Hydrologie des petits bassins du Nordeste Bresilien semi-aride: typologie des bassins et transposition ecoulements annuels Small watershed hydrology in semi-arid north-eastern Brazil: basin typology and transposition of annual runoff data. Journal of Hydrology 182, 117–141.
Cadier, E., Molle, F., Albuquerque, C.H.C.d., Doherty, F.R., Montgaillard, M., 1992. Dimensionnement de petits barrages dans le Nordeste bre´silien semi-aride. In: ORSTOM (Ed.), pp. 28.
Christensen, J.H., Hewitson, B., Busuioc, A., Chen, A., Gao, X., Held, I., Jones, R., Kolli, R.K., Kwon, W.-T., Laprise, R., Magan˜a Rueda, V., Mearns, L., Mene´ndez, C.G., Ra¨isa¨nen, J., Rinke, A., Sarr, A., Whetton, P., 2007. Regional climate projections. In: Solomon, S., Qin, D., Manning, M., Chen, Z., Marquis, M., Averyt, K.B., T. M., Miller, H.L. (Eds.), Climate Change 2007: The Physical Science Basis. Contribution of Working Group I to the Fourth Assessment Report of the Intergovernmental Panel on Climate Change. Cambridge University, Cambridge, United Kingdom and New York, NY, USA, p. 94.
Coudrain, A., Talbi, A., Ledoux, E., Loubet, M., Vacher, J., Ramirez, E., 2001. Subsurface transfer of chloride after a lake retreat in the central Andes. Ground Water 39, 751–759.
Dubreuil, P., 1966. L’e´tude pluvio-hydrologique du bassin de Jaguaribe. Terres et eaux 19, 11.
Dubreuil, P., Girard, G., Herbaud, J., 1968. Monographie hydrologique du bassin du Jaguaribe (Ceara-Bre´sil). ORSTOM, pp. 397.
Fabre, N., Burte, J., 2007. In: UFRGS (Eds.), Efeitos da interac¸a˜o entre polı´ticas pu´blicas e dinaˆmicas locais sobre a agricultura familiar: Estudo de caso da bacia do Riacho Forquilha – Quixeramobim/CEARA´. Agricultura familiar: Inter-ac¸a˜o entre politicas publicas e dinamicas locais, Rio Grande do Sul, pp. 221–248. IBGE, 2004. Uso da terra no Brasil Indicadores de desenvolvimento sustenta´vel.
Brasilia, pp. 42.
IPCC, 2007. Climate Change 2007: The Physical Science Basis. Contribution of Working Group I to the Fourth Assessment Report of the Intergovernmental Panel on Climate Change. Cambridge University Press, Cambridge, pp. 996. Jakeman, A.J., Letcher, R.A., 2003. Integrated assessment and modelling: features,
principles and examples for catchment management. Environmental Modelling & Software 18, 491–501.
Krol, M.S., Bronstert, A., 2007. Regional integrated modelling of climate change impacts on natural resources and resource usage in semi-arid Northeast Brazil. Environmental Modelling & Software 22, 259–268.
Liu, Y., Guo, H.C., Zhang, Z.X., Wang, L.J., Dai, Y.L., Y.Y., F., 2007. An optimization method based on scenario analysis for watershed management under uncer-tainty. Environmental Management 39, 678–690.
Mainuddin, M., Kirby, M., Qureshi, M.E., 2007. Integrated hydrologic-economic modelling for analyzing water acquisition strategies in the Murray River Basin. Agricultural Water Management 93, 123–135.
Mermet, L., 2005. Etudier des e´cologies futures: un chantier ouvert pour les recherches prospectives environnementales. PIE Peter Lang, Bruxelles. Molle, F., 1994. Politique de l’eau, irrigation et socie´te´ - le cas du Nordeste bre´silien.
Les cahiers de la Recherche De´veloppement 37, 18–32. Molle, F., Cadier, E., 1992. Manual do pequeno ac¸ude, pp. 528.
Ribeyre, D., 2006. La valle´e du Forquilha: multi-usages et strate´gies de gestion de l’eau dans le Nordeste semi-aride (Ceara - Bre´sil). CNEARC (Montpellier-France), pp. 145.
Salazar, L.F., Nobre, C.A., Oyama, M.D., 2007. Climate change consequences on the biome distribution in tropical South America. Geophysical Research Letters 34, L09708.
Srdjevic, B., Medeiros, Y.D.P., Faria, A.S., 2004. An objective multi-criteria evaluation of water management scenarios. Water Resources Management 18, 35–54. SRH, 1992. Polı´tica Estadual de Recursos Hı´dricos. Secretaria de Recursos Hidricos
-Governo do Estado do Ceara, pp. 1–18.
Tonneau, J.-P., Caron, P., 2006. Se´cheresse et de´veloppement territorial. Colloque eau et territories, Lyon, pp. 1–9.
Treyer, S., 2005. L’adaptation sur le long terme a` la limitation des ressources en eau. Une prospective par scenarios pour la re´gion de Sfax, en Tunisie. Etudier des e´cologies futures. Un chantier ouvert pour les recherches prospectives envir-onnementales. Bruxelles 325–341.