DOI: http://dx.doi.org/10.5007/1980-0037.2012v14n3p313
original article
RBCDH
Licence Creative Commom
CC
1 Universidade do Estado de Santa Catarina. Departamento de Edu-cação Física. Centro de Ciências da Saúde e do Esporte. Florianópolis, SC. Brazil.
2 Universidade do Estado de Santa Catarina. Departamento de Ciências da Saúde. Centro de Ciências da Saúde e do Esporte. Florianópolis, SC. Brazil.
Received: 06 October 2011 Accepted: 17 January 2012
Performance comparison of
resistance-trained subjects by diferent methods of
adjusting for body mass
Comparação do desempenho de praticantes de exercícios
resistidos por diferentes métodos de ajuste pela massa
corporal
Wladymir Külkamp1
Jonathan Ache Dias1
Susana Cristina Domenech2
Noé Gomes Borges Junior2
Monique da Silva Gevaerd2
Abstract– he aim of this study was to compare the performance (1RM) of resistance-trained subjects, using diferent methods of adjusting for body mass (BM): ratio standard, theoretical allometric exponent (0.67), and speciic allometric exponents. he study included 11 male and 11 female healthy non-athletes (mean age = 22 years) engaged in regular resistance training for at least 6 months. Bench press (BP), 45° leg press (LP) and arm curl (AC) exercises were performed, and the participants were ranked (in de-scending order) according to each method. he speciic allometric exponents for each exercise were: for men – BP (0.73), LP (0.35), and AC (0.71); and for women – BP (1.22), LP (1.02), and AC (0.85). he Kruskal-Wallis test revealed no diferences between the rankings. However, visual inspection indicated that the participants were oten classiied diferently in relation to performance by the methods used. Furthermore, no adjusted strength score was equal to the absolute strength values (1RM). he results suggest that there is a range of values in which the diferences between exponents do not relect dif-ferent rankings (below 0.07 points) and a range in which rankings can be fundamentally diferent (above 0.14 points). his may be important in long-term selection of universally accepted allometric exponents, considering the range of values found in diferent studies. he standardization of exponents may allow the use of allometry as an additional tool in the prescription of resistance training.
Key words: Anthropometry; Muscle strength; Resistance training.
INTRODUCTION
he measurement of muscle strength is fundamental in sports, as well as in prevention and rehabilitation. Both training plans and the preparation of diagnoses and training protocols are oten deined according to the results of muscle strength assessments1,2.
Although evidence suggests that body mass (BM) and muscle strength (MS) are associated3-7, the importance of adjusting or scaling MS levels to
BM during assessments is oten neglected when the purpose is to compare diferent individuals. If any kind of scaling is adopted8,9,it is oten limited
to the use of the ratio standard (MS/BM)10.
Other variables, such as the cross-sectional area (CSA) of muscles, may be biologically more closely correlated with MS11-14, but reliable
measure-ments of CSA are expensive and made using computed tomography12 or
magnetic resonance14, which makes the use of BM more attractive.
Several natural phenomena, such as the ratio between MS and BM, follow the power law ((y=axb), and a growing number of studies have been
conducted to evaluate whether allometry may be satisfactorily used to compare the MS of individuals or groups. In short, allometric scaling is achieved by linearizing a power function using the least squares method (equation 2) and the natural logarithm (ln) of the dependent and independ-ent variables, which are, in this case, MS and BM.
Allometry, a relatively easy method, also has a strong theoretical basis and has gained credibility in the academic and scientiic ields5,16-19.
How-ever, most studies have only applied allometry to athlete performances7,20
and have neglected the reality of non-athletes, particularly those that practice resistance training (RT).
Some authors suggest that, based on the geometric similarity theory, an exponent of 0.67 should be used whenever a speciic allometric expo-nent cannot be deined5,21,22. However, geometric similarity is not found in
practice, at least not in the relation between body circumferences and BM23.
he comparison of non-athlete performance may seem trivial. How-ever, the study of methods for more accurate comparisons of MS between diferent groups and individuals, particularly non-athletes, may help to establish normative values that take into considerations the diferent in-dividual physical and functional diferences.
his study compared the performance (muscle strength [MS]) of resistance-trained (RT) individuals according to body mass (BM) using diferent scaling methods: ratio standard, theoretical allometric exponent (0.67) and speciic allometric exponents.
MeThODs
Subjects
heir training protocol consisted of eight to ten resistance exercises involv-ing the main muscle groups three times a week, with two to three sets of 8 to 12 repetitions. Only individuals with some experience in one-repetition maximum (1RM) tests were evaluated.
Exclusion criteria were any physical impairment that would prevent or make test performance unsafe and use of drugs that might afect performance.
All participants read and signed an informed consent term. All pro-cedures were approved by the Ethics Committee for Research with Hu-man Beings of Universidade do Estado de Santa Catarina under number 143/2009.
Procedures
All 1RM tests were preceded by general and speciic warm-up exercises. Evaluations were made using the bench press (BP), 45-degree leg press (LP) and the arm curl (AC) tests, in this order, to avoid the consecutive perfor-mance of any two exercises using the upper limbs. he deinition of 1RM was the load for which individuals could only make one repetition without any signiicant change in their performance technique and including all the movement range (except LP, which was limited to 90-degree knee lexion). Some studies suggest that at least three sessions are necessary for the familiarization with the 1RM test protocols24,but others showed that one
testing day is enough to ensure result reliability when individuals already practice bodybuilding25. Moreover, although 1RM using the three tests
should ideally be performed on diferent days, other studies also had participants perform them on the same occasion25,26 without any negative
efects on their conclusions.
In our study, performance in the 1RM tests should be interpreted, although not directly, as an expression of BM (kg).
Statistical analysis
he Shapiro-Wilk test was used to test the normal distribution of the anthropometric variables and MS. he SPSS 17.0 was used for statistical analyses, and the level of signiicance was set at 5%.
Construction of allometric models
he possibility of adopting allometric scaling due to the lack of linearity in the relation between MS and BM was conirmed using the exceptional circumstance expression (EC) deined by Tanner (equation 1), which is true when the division of the variation coeicients (vc) of the variables is equal to the Pearson correlation coeicient (r) between them10.
BMvc/MSvc = r (equation 1)
in kg) in each situation, and all the allometric exponents (b) were deined within a 95% conidence interval (CI).
lnMS = (ln a) + (b * lnBM) (equation 2)
Regression diagnoses
To evaluate the quality of allometric scaling, diagnostic criteria of the regressions were used to deine the it of the models. his set of criteria was introduced by Batterham and George16 and adopted by others, such as
Vanderburgh and Doman17, Cleather18, Pua27 and Zoeller et al.19.
Rank comparison
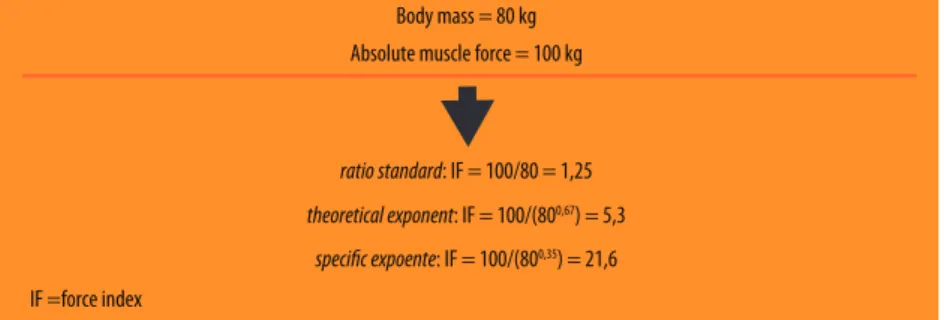
Each method generated a ranking according to participant perfor-mance and classiied ranks in descending order, from stronger to weak-est. he reference rank, deined according to absolute force values (1RM), was the basis to maintain participant rank and compare changes in ranking (change of position of same participant in diferent ranks) and, consequently, the diference between methods. Diferences were detected using the Kruskal-Wallis test and the visual inspection of ranks, and the criterion for the latter was that the change of at least one position would deine diference. Participant classiication according to the diferent methods (ranking) was deined by calculating the individual force index, as illustrated in Figure 1.
Figure 1. Example of force index calculation for an individual performing leg press test
ResUlTs
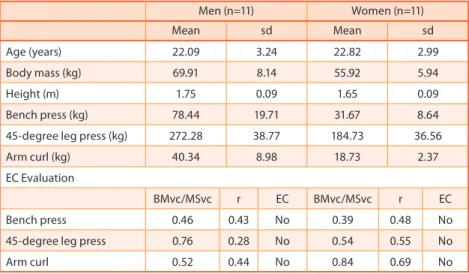
he variables that describe the sample and the results of the exceptional circumstance (EC) equation are shown in Table 1.
Construction of allometric models
According to Box 1, EC was not found in any of the tests, which conirmed the linearity of the relation between MS and BM and made it possible to use allometry as the scaling method.
Atkins21 studied allometry in a group of rugby players and also used
he equations derived from allometric scaling of 1RM performance of men and women separately in the diferent RT tests, as well as the speciic exponents derived, are shown in Table 1.
Box 1. Sample characteristics and evaluation of EC as deined by Tanner
Men (n=11) Women (n=11)
Mean sd Mean sd
Age (years) 22.09 3.24 22.82 2.99
Body mass (kg) 69.91 8.14 55.92 5.94
Height (m) 1.75 0.09 1.65 0.09
Bench press (kg) 78.44 19.71 31.67 8.64
45-degree leg press (kg) 272.28 38.77 184.73 36.56
Arm curl (kg) 40.34 8.98 18.73 2.37
EC Evaluation
BMvc/MSvc r EC BMvc/MSvc r EC
Bench press 0.46 0.43 No 0.39 0.48 No
45-degree leg press 0.76 0.28 No 0.54 0.55 No
Arm curl 0.52 0.44 No 0.84 0.69 No
BMvc = body mass variation coeicient; MScv = muscle strength variation coeicient; r = Pearson correlation between BM and MS; EC = exceptional circumstance, deined by Tanner; sd = standard deviation
Table 1. Log-linear regressions of each speciic situation
Test S Log-linear regression SEE R2 (adjust.R2) b CI
BP M lnY=(0.7305lnX)+1.2331 0.26 0.101(0.001) 0.73 -0.91 – 2.37
LP M lnY=(0.3518lnX)+4.099 0.14 0.078(-0.054) 0.35 -0.73 – 1.43
AC M lnY=(0.7105lnX)+0.6613 0.22 0.137(0.041) 0.71 -0.63 – 2.05
BP W lnY=(1.2208lnX)+1.4851 0.24 0.241(0.157) 1.22 -0.41 – 2.85
LP W lnY=(1.0220lnX)+1.0944 0.17 0.324(0.249) 1.02 -0.09 – 2.14
AC W lnY=(0.8544lnX)+0.5109 0.09 0.510(0.455) 0.85 0.22 – 1.49
S = sex; M = men; W = women; BP = bench press; LP = 45-degree leg press; AC = arm curl; ln = natural logarithm; CI = 95% conidence interval; SEE – standard error of estimate.
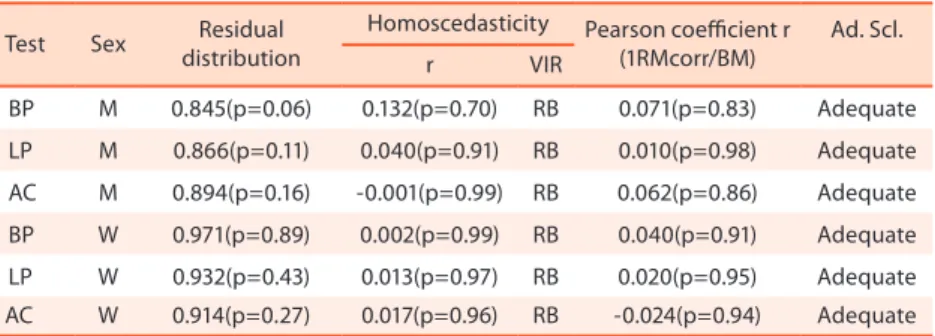
Regression diagnoses
he analysis of normal distribution of residuals revealed that residuals did not have a Gaussian distribution only in the bench press test in the group of men. In all other regressions, distribution was normal (Table 2).
he analysis of homoscedasticity showed that all regressions provided good it, as signiicant values of the correlation between residuals and lnMS were not found in any of them, which ruled out the possibility of a systematic linear behavior. In addition, visual inspection of the graphs revealed that there was also no systematic nonlinear behavior that might be deined, for example, by a polynomial function (Table 2).
Table 2. Regression diagnoses
Test Sex Residual distribution
Homoscedasticity Pearson coeicient r (1RMcorr/BM)
Ad. Scl.
r VIR
BP M 0.845(p=0.06) 0.132(p=0.70) RB 0.071(p=0.83) Adequate
LP M 0.866(p=0.11) 0.040(p=0.91) RB 0.010(p=0.98) Adequate
AC M 0.894(p=0.16) -0.001(p=0.99) RB 0.062(p=0.86) Adequate
BP W 0.971(p=0.89) 0.002(p=0.99) RB 0.040(p=0.91) Adequate
LP W 0.932(p=0.43) 0.013(p=0.97) RB 0.020(p=0.95) Adequate
AC W 0.914(p=0.27) 0.017(p=0.96) RB -0.024(p=0.94) Adequate
Ad. Scl. = adequacy of allometric scaling; VIR = visual inspection of residuals; BP = bench press; LP = 45-degree leg press; AC = arm curl; RB = random behavior; M = men; W = women; r = Pearson correlation coeicient; BM = Body mass; 1RMcorr = corrected allometric force
Rank comparison
Statistical analyses failed to detect diferences between ranks in each situ-ation although there were visible changes in positions, which raised ques-tions about the sensitivity of the test in this type of comparison. herefore, visual inspection was performed according to the criterion of change in at least one position to deine diference.
Box 2 shows the ranks in the three RT tests, the positions deined ac-cording to absolute force and the force allometrically adjusted to a speciic exponent, to a theoretical exponent (0.67) and to the ratio standard. he last two columns of each table show the changes in each position: the irst shows the diference found between the speciic exponent and the theoreti-cal exponent; and the second, the diferent between the speciic exponent and the ratio standard. hese diferences were expressed as absolute values; values equal to zero indicate no change in positions; positive and nega-tive values indicate the number of ascending and descending positions in comparison with the reference rank (speciic allometric exponent).
Box 2. Rank diferences of force corrected according to speciic exponent, theoretical exponent (0.67) and ratio standard in each test
Bench press, men Bench press, women
R1 AbF R2 0.73 R3 0.67 R4
1(ratio) DifA DifB
R2 1.22
R3 0.67
R4
1(ratio) DifA DifB
1º 1º 1º 1º 0 0 2º 1º 2º 1 0
2º 2º 2º 3º 0 -1 3º 3º 3º 0 0
3º 5º 5º 5º 0 0 1º 2º 1º -1 0
4º 3º 3º 2º 0 1 4º 4º 4º 0 0
5º 4º 4º 4º 0 0 5º 5º 5º 0 0
6º 8º 8º 9º 0 -1 6º 6º 6º 0 0
7º 7º 7º 7º 0 0 7º 7º 7º 0 0
8º 9º 9º 8º 0 1 8º 8º 8º 0 0
9º 6º 6º 6º 0 0 10º 9º 10º 1 0
10º 10º 10º 10º 0 0 11º 11º 11º 0 0
11º 11º 11º 11º 0 0 9º 10º 9º -1 0
45-degree leg press, men 45 -degree leg press, women
R1 AbF R2 0.35 R3 0.67 R4
1(ratio) DifA DifB
R2 1.02
R3 0.67
R4
1º 1º 1º 1º 0 0 3º 4º 3º -1 0
2º 2º 4º 4º -2 -2 4º 5º 4º -1 0
3º 4º 3º 3º 1 1 2º 2º 2º 0 0
4º 3º 2º 2º 1 1 1º 1º 1º 0 0
5º 7º 9º 9º -2 -2 6º 9º 6º -3 0
6º 8º 7º 8º 1 0 8º 10º 8º -2 0
7º 6º 6º 6º 0 0 9º 8º 9º 1 0
8º 5º 5º 5º 0 0 5º 3º 5º 2 0
9º 9º 8º 7º 1 2 11º 11º 11º 0 0
10º - - - 10º 7º 10º 3 0
11º - - - 7º 6º 7º 1 0
Arm curl, men Arm curl, women
R1 AbF
R2 0.71
R3 0.67
R4
1(ratio) DifA DifB
R2 0.85
R3 0.67
R4
1(ratio) DifA DifB
1º 2º 2º 3º 0 -1 2º 2º 3º 0 -1
2º 1º 1º 1º 0 0 3º 3º 4º 0 -1
3º 4º 4º 5º 0 -1 1º 1º 1º 0 0
4º 3º 3º 2º 0 1 5º 5º 5º 0 0
5º 5º 5º 6º 0 -1 7º 7º 8º 0 -1
6º 7º 7º 8º 0 -1 10º 9º 11º 1 -1
7º 6º 6º 4º 0 2 4º 4º 2º 0 2
8º 8º 8º 7º 0 1 6º 6º 6º 0 0
9º 9º 9º 9º 0 0 9º 8º 9º 1 0
10º 11º 11º 11º 0 0 8º 10º 7º -2 1
11º 10º 10º 10º 0 0 11º 11º 10º 0 1
R1 AbF = absolute force rank; R2 = speciic exponent rank; R3 = theoretical exponent rank; R4 = ratio standard rank; DifA = diference of positions (R2 – R3); DifB = diference of positions (R2 – R4)
DIsCUssION
his study used diferent BM adjustment methods to compare ranks ac-cording to performance in 1RM tests of individuals that practiced resist-ance training.
he theoretical allometric exponent (0.67), based on geometrical simi-larity, was included because it has been recommended for the general use in allometric scaling of force, particularly when it is not possible to derive a speciic exponent4,5,21,28. he use of another common exponent for all the
exercises was not feasible because most studies in the literature suggested diferent exponents, which made it diicult to choose one that might be a safe reference.
he ratio standard, included here despite the indisputable theoretical basis that conirms its inadequacy, provided a way to examine whether the exponents found in our study, particularly those close to 1, may lead, in practice, to any signiicant diferences in ranks from the results obtained when the exponent is equal to 1.
were derived (BP and LP in the group of women). In addition, a diference of 0.15 points between the speciic exponent of AC in the group of women and the ratio standard (1 – 0.85) ranked individuals diferently.
herefore, in the sample under study, there seemed to be a range of values for which the diferences in exponents did not indicate diferent ranks (below 0.07 points) and a range in which ranks may be essentially diferent (above 0.14 points). his may be associated with the variation coeicient of the force values in the sample in each situation, in which the diferences between individuals may be large enough to make the mini-mum exponent diferences prevent diferences in rankings. he existence of ranges that are sensitive to diferences may raise questions about the validity of calculating means as a technique to estimate common expo-nents, as reported by Folland et al.13 in their study about allometric scaling
of isometric force and torque.
It is important to note that, although not the focus of this study, no method generated adjusted force rankings equal to the ranking deined by absolute force (Table 4), which supports the idea that performance in absolute values should be seen cautiously in the comparison of groups.
Vanderburgh et al.29 compared the strength of men and women using
traditional analysis of covariance and also found diferences in the result of speciic exponent and ratio standard scaling. Ater the calculation of mean values of corrected forces according to both methods, they concluded that the use of the ratio standard overestimates female force when compared with the speciic allometric exponent and results in theoretically less ac-ceptable diferences.
Markovic and Jaric28 used a single sample t test to investigate the
dif-ferences between the 0.67 exponent and the exponents that they found in six types of dynamic tests, such as BP, squats and arm curls. hey con-cluded that the theoretical exponent may be used to normalize force in all exercises because there is no statistical signiicance in the t test results (p>0.05). However, this result was presumed even though an exponent of 0.27 was found for the handgrip strength, which may raise questions about test sensitivity and the validity of this type of method.
Markovic and Sekulic30 compared allometric modeling in groups of
powerliters and weightliters to investigate whether the exponents that they found in each modality, for men and women, did not have any signiicant diferences from the 0.67 exponent. hey examined exponents within the conidence interval deined (95% CI) at the time when the log-linear regres-sions were built. herefore, when the 0.67 exponent was within that CI, it was not classiied as diferent from the speciic exponents derived in their study.
In our study, the method adopted by Markovic and Seculic30 could not
be used because the low values of the coeicient of determination (R2) of
the log-linear regressions generated very large CI, which included negative and positive exponents (Table 2).
possible. However, this type of analysis precludes tests of statistical prob-ability and may be easily replicated in future studies. herefore, its merits may be assed by the interpretation of results alone. In addition, it raises questions about the validity of the indiscriminate use of the 0.67 exponent to adjust MS to BM, as suggested by several authors4,5,21,28.
Although such detailed comparisons of force seem to be more impor-tant in weightliting competitions, in which changes of one single position may result in prizes, the study of non-athlete rankings according to diferent exponents may help to build a more accurate model of allometric scaling for the prescription of RT to improve health. Rank comparisons may, in practice, ine-tune the deinition of how much the absolute diferences of exponents may be relected in the discrimination of groups according to force (ranges sensitive to diference), which may lead to the adoption of a standard number selected from a restricted set of exponents.
One of the main limitations of this study was its small sample size, which, however, does not seem to have afected results, as it was possible to compare methods and detect diferences between them. In addition, the purpose of this study was not to extrapolate results; rather, it aimed at contributing to the discussion about the need to use adequate strategies to adjust muscle strength to body mass.
CONClUsION
he analysis of the diference between ranks deined by speciic exponents, the theoretical exponent (0.670) and ratio standard revealed that, in most situations, there were non-corresponding changes in positions. he three methods oten discriminated individuals in relation to 1RM force difer-ently. In addition, no adjusted force ranking was equal to the ranking by absolute force values (1RM).
Results suggest that there is a range of values within which diferences between exponents do not relect diferent ranks (below 0.07 points) and a range within which rankings may be essentially diferent (above 0.14 points). his may be important in the long term selection of allometric exponents that are universally accepted, considering the variation of values found in diferent studies. Exponent standardization may lead to the use of allometry as an additional tool in prescribing and controlling resistance exercises.
ReFeReNCes
1. Cronin JB, Hansen KT. Strength and power predictors of sports speed. J Strength
Cond Res 2005;19(2):349–357.
2. Nobori H, Maruyama H. Invention and making of “Power Measure”, a simple
instrument to measure muscular strength – validation of the measurement values. J Phys her Sci 2007;19:9-13.
3. Nevill AM, Ramsbottom R, Williams C. Scaling physiological measurements for
in-dividuals of diferent body size. Eur J Appl Physiol Occup Physiol 1992;65(2):110-117.
4. Vanderburgh PM. A simple index to adjust maximal strength measures by body
5. Jaric, S. Muscle strength testing: Use of normalization for body size. Sports Med 2002; 32(10):615-631.
6. Stone MH, Sands WA, Pierce KC, Carlock J, Cardinale M, Newton RU.
Relation-ship of Maximum Strength to Weightliting Performance. Med Sci Sports Exerc 2005;37(6):1037-43.
7. Külkamp W; Dias JA, Wentz MD. Percentuais de 1RM e alometria na prescrição
de exercícios resistidos. Motriz 2009;15(4):976-86.
8. hé DJ, Ploutz-Snyder L. Age, Body Mass, and Gender as Predictors of Masters
Olympic Weightliting Performance. Med Sci Sports Exerc 2003;35(7):1216-1224.
9. Fontoura AS, Schneider P, Meyer F. O efeito do destreinamento de força muscular
em meninos pré-púberes. Rev Bras Med Esporte 2004;10(4):281-4.
10. Tanner JM. Fallacy of per-weight and per-surface area standards and their relation to spurious correlation. J Appl Physiol 1949;2:1-15.
11. Hill AV. he Abrupt Transition from Rest to Activity in Muscle. Proc R Soc Lond
B Biol Sci 1949;136:399-420.
12. Maughan RJ, Watson JS, Weir J. Muscle strength and cross-sectional area in
man: a comparison of strength-trained and untrained subjects. Brit J Sports Med 1984;18(3):149-157.
13. Folland JP, Mc Cauley TM, Williams AG. Allometric scaling of strength
measure-ments to body size. Eur J Appl Physiol 2008;102(6):739-45.
14. Akagi R, Takai, Y, Ohta M, Kanehisa H, Kawakami Y, Fukunaga T. Muscle volume
compared to cross-sectional area is more appropriate for evaluating muscle strength in young and elderly individuals. Age Ageing 2009;38(5):564-9.
15. García-manso JM, Martín-gonzález JM. Leis de potência ou escala: sua aplicação
ao fenômeno esportivo. Fit Perf J 2008;7(3):195-202.
16. Batterham AM, George KP. Allometric modeling does not determine a
dimen-sionless power function ratio for maximal muscular function. J Appl Physiol 1997;83(6):2158-66.
17. Vanderburgh PM, Dooman C. Considering body mass diferences, who are the
world’s strongest women? Med Sci Sports Exerc 2000;32(1):197-201.
18. Cleather DJ. Adjusting powerliting performances for diferences in body mass. J
Strength Cond Res 2006;20(2):412-21.
19. Zoeller RF, Ryan ED, Gordish-Dressman H, Price TB, Seip RL, Angelopoulos TJ,
et al. Allometric scaling of isometric biceps strength in adult females and the efect of body mass index. Eur J Appl Physiol 2008;104:701-10.
20. Crewther BT, McGuigan MR, Gill ND. he ratio and allometric scaling of speed,
power, and strength in elite male rugby union players. J Strength Cond Res 2011;25(7):1968-75.
21. Atkins SJ. Normalizing expressions of strength in elite rugby league players. J
Strength Cond Res 2004;18(1):53-8.
22. Jaric S, Mirkov D, Markovic G. Normalizing physical performance tests for body
size: a proposal for standardization. J Strength Cond Res 2005;19(2):467-74.
23. Nevill AM, Stewart AD, Olds T, Holder R. Are adult physiques geometrically
similar? he dangers of allometric scaling using body mass power laws. Am J Phys Anthropol 2004;124(2):177-82.
24. Dias RMR, Cyrino ES, Salvador EP, Caldeira LFS, Nakamura FY, Papst RR, et al.
Inluência do processo de familiarização para avaliação da força muscular em testes de 1-RM. Rev Bras Med Esporte 2005;11(1):34-8.
25. Silva-Junior AM, Lima MLF, Ribeiro LG, Dantas EHM. Veriicação das possíveis
diferenças entre diferentes dias do teste de 1RM. Fit Perf J 2007;6(4):232-6.
26. Shimano T, Kraemer WJ, Spiering BA, Volek JS, Hatield DL, Silvestre R, et al.
27. Pua Y. Allometric Analysis of Physical Performance Measures in Older Adults. Phys her 2006;86(9):1263-70.
28. Markovic G, Jaric S. Movement performance and body size: the relationship for
diferent groups of tests. Eur J Appl Physiol 2004;9:139-49.
29. Vanderburgh PM, Sharp M; Nindl B. Nonparallel slopes using analysis of
covari-ance for body size adjustment may relect inappropriate modeling. Meas Phys Ed Exerc Sci 1998;2:127-35.
30. Markovic G, Sekulic D. Modeling the inluence of body size on weightliting and
powerliting performance. Coll Antropol 2006;30(3):607-13.
Endereço para correspondência
Wladymir Külkamp
Departamento de Educação Física - CEFID/UDESC
Rua Pascoal Simone, 358, Bairro Coqueiros.
CEP 88080-350 – Florianópolis, SC. Brasil.