Article
Printed in Brazil - ©2013 Sociedade Brasileira de Química0103 - 5053 $6.00+0.00
A
*e-mail: [email protected]
Modified Eremophilanes and Anti-Inflammatory Activity of
Psacalium cirsiifolium
Amira Arciniegas,a Ana L. Pérez-Castorena,*,a Antonio Nieto-Camacho,a
José Luis Villaseñorb and Alfonso Romo de Vivara
aInstituto de Química and bInstituto de Biología, Universidad Nacional Autónoma de México, Circuito Exterior, Ciudad Universitaria, 04510 Coyoacán, D. F., México
Quatro novos eremofilanos modificados, juntamente com dez derivados conhecidos de cacalol, dois cariofilenos, um aromadendreno e um flavonoide foram purificados a partir de Psacalium cirsiifolium. As estruturas destes compostos foram elucidadas por análise espectroscópica. A atividade anti-inflamatória dos extratos e de sete dos compostos isolados foi avaliada no modelo de 12-O-tetradecanoilforbol-13-acetato (TPA) de inflamação aguda induzida. O composto inédito
2α-hidroxiadenostin B (4) mostrou uma atividade dependente da dose (IC50 0,41 µmol por orelha) e um efeito de inibição de neutrófilos medido pelo teste de mieloperoxidase (MPO) semelhante ao efeito da indometacina, 0,31 e 1,0 µmol por orelha.
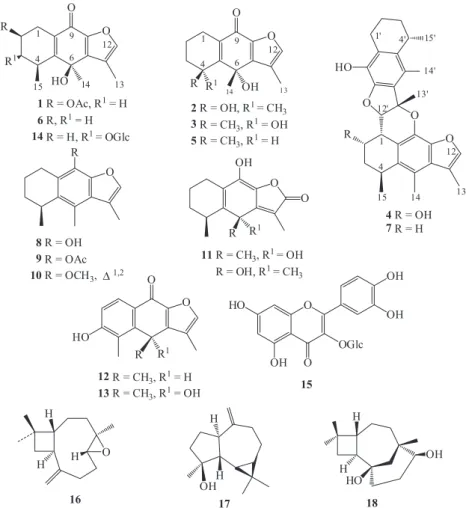
Four new modified eremophilanes,together with ten known cacalol derivatives, two caryophyllenes, one aromadendrene and one flavonoid were isolated from Psacalium cirsiifolium.
The structures of these compounds were elucidated by spectroscopic analysis. The anti-inflammatory activity of extracts and of seven of the isolated compounds was evaluated on 12-O-tetradecanoylphorbol-13-acetate (TPA) model of induced acute inflammation. The new compound 2α-hydroxyadenostin B (4) showed a dose dependent activity (IC50 0.41 µmol per
ear) and a neutrophil inhibition effect as measured by the myeloperoxidase (MPO) assay similar to that of indomethacin at 0.31 and 1.0 µmol per ear.
Keywords: Psacalium, modified eremophilanes, anti-inflammatory activity, TPA,
myeloperoxidase
Introduction
Psacalium cirsiifolium is one of the 40 species of perennial herbs grouped into the genus Psacalium (Asteraceae, Senecioneae, Tussilagininae).1 They are disseminated
from the south of the United States to Guatemala and some of them are used in folk medicine to cure diabetes and renal, hepatic, gastrointestinal and dermatological problems.2,3 The hypoglycemic, anti-inflammatory and
antioxidant activities of P. decompositum,4-6 P. peltatum7,8 and P. radulifolium9 extracts have been reported. The
antimicrobial effects of P. radulifolium10 and the anti-inflammatory properties of P. sinuatum11 have also been
determined. Sesquitepenes mainly of eremophilane and modified eremophilane types are the main secondary metabolites isolated from the eight species of the genus chemically studied so far: P. decompositum4-6 (also studied
as Cacalia decomposita),12,13 P. tussilaginoides (studied
as Cacalia ampulacea),13 P. peltatum,7,8 P. sinuatum,11 P. radulifolium,9,10 P. paucicapitatum,14 P. megaphyllum15 and P. beamanii.16 Cacalol has been identified as the
major active compound in these species with antioxidant,9
antimicrobial10 and anti-inflammatory17 activities. Cacalone, epi-cacalone, maturinone, and radulifolin D have also shown anti-inflammatory properties.17,18 As continuation of our
research on Senecioneae we studied the chemical composition of P. cirsiifolium which to the best of our knowledge has no previous studies. We report the isolation of fourteen modified eremophilane derivatives (1-14), of which four (1-4) are
described for the first time.Two known caryophyllenes (16, 18), one aromadendrene (17) and one flavonoid (15) were
also isolated (Figure 1). The 12-O -tetradecanoylphorbol-13-acetate (TPA) model of induced acute inflammation was used to evaluate the anti-inflammatory activity of extracts and of the isolated compounds non-evaluated previously. The most active compound (4) was tested on the myeloperoxidase
Results and Discussion
Compound 1 was obtained as a colorless oil. The IR
spectrum indicated hydroxyl, ester and conjugated ketone groups (3390, 1743, 1661 cm-1). The molecular formula
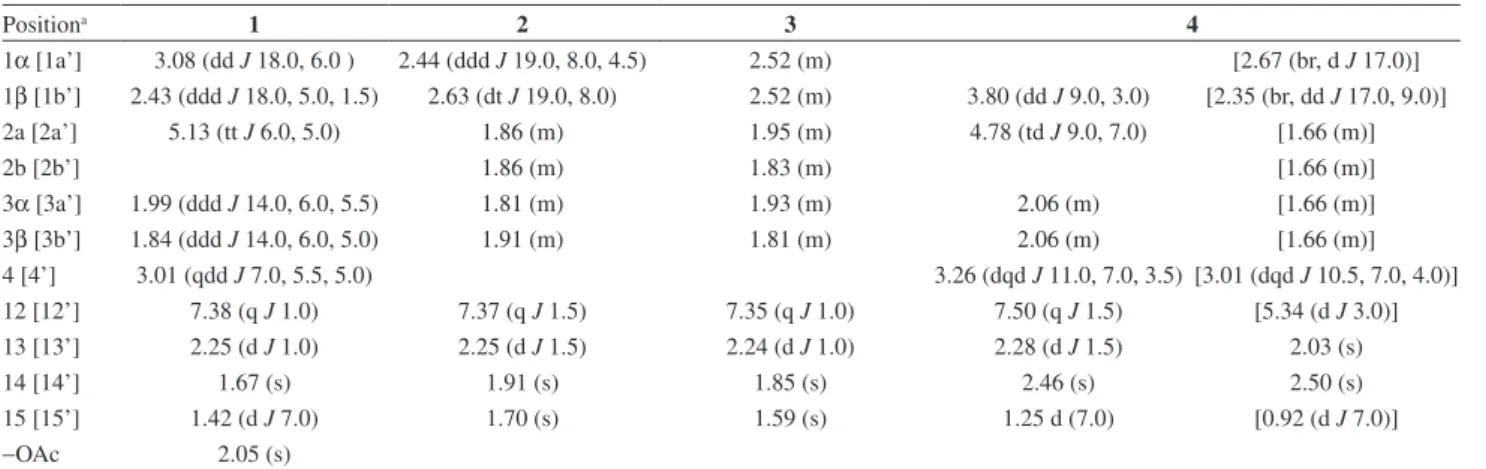
C17H20O5, determined by HRESIMS, showed eight degrees of insaturation. The 1H NMR spectrum (Table 1) was
similar to those of cacalone (5) and epi-cacalone (6)6 with
two additional signals at dΗ 5.13 (tt,1H, J 6.0, 5.0 Hz)
and 2.05 (s, 3H). The first one was attributed to H-2 by its correlations with the H2-1 and H2-3 methylene groups
observed in the COSY experiment. The downfield chemical shift of H-2 indicated that an acetate group, whose methyl group appeared at dΗ 2.05 was attached to this position, and,
in addition, H-2 showed an interaction with the carbonyl at
dC 170.5 in the HMBC experiment. The NOESY spectrum
showed interactions between H3-15 and the acetate
methyl, therefore this group should have a β-pseudoaxial orientation, since on biogenetic grounds H3-15 is β.19
Likewise, the coupling constant of H-2 (J6.0, 5.0 Ηz)
suggested its α-pseudoequatorial orientation. Moreover, a CD (circular dichroism) analysis of compound 1 showed a
similar profile to that of epi-cacalone (6), consequently, the
hydroxyl group at C-6 (dC 72.1) in 1 should be β-oriented
as the one in 6. Therefore, 1 was identified as (2R, 4S, 6S )-2-acetoxy-epi-cacalone.
Compounds 2 and 3 exhibited the same molecular
formula C15H18O4 (HRESIMS) and very similar spectroscopic
data, with evidence of hydroxyl (3400 cm−1) and conjugated
carbonyl groups (1660 cm-1) in the IR spectra. The 1H and 13C NMR spectroscopic data of these compounds also
resembled those of cacalone (5) and epi-cacalone (6),6 and
were indicative of the presence of an additional hydroxyl group. Position of this additional group at C-4 (dC75.5 in 2
and 74.6 in 3) was supported by the correlations observed
in the HMBC experiments between H3-15 and C-4 in
both 2 and 3. Differences between the two compounds were
however observed in their 1H NMR spectra (Table 1) where
methyl groups 14 and 15 appeared at dH1.91 (s, H-14) and
1.70 (s, H-15) in compound 2, and at dH 1.85 (s, H-14)
and 1.59 (s, H-15) in 3; and in the 13C NMR spectrum of 2
(Table 2), the signals of C-14 and C-15 appeared at dC 28.5
and 29.6, respectively, while in compound 3 the signals
of the same atoms were observed at dC 32.2 and 29.7. At
this point, it was evident that 2 and 3 should have different
was comparable with that of cacalone (5), indicating that
they have the same stereochemistry at C-6 and, therefore,
2 and 3 are epimers at C-4. On the other hand, the fact that
in compound 2, H3-14 and H3-15 resonated at lower field
(Dd 0.06 and 0.11, respectively) than the same groups in 3,
indicated that in compound 2, each of these methyl groups
is feeling a deshielding effect due to its syn orientation with a hydroxyl group, which is not the case in compound 3.
Additionally, in the carbon resonance of CH3-14 in 3 a
downfield shift (Dd 3.7) was observed with respect to that in 2 as a result of a change from a pseudoaxial orientation in
compound 2 to a pseudoequatorial in 3,in order to release
steric crowding.20 In the case of CH
3-15, this showed almost
the same chemical shifts in 2 and 3 (Dd 0.01) since it adopted in both pseudoaxial orientation which was α in 2 and β in 3.
This last was evident by the NOESY interaction observed between H3-15 and H-1α in compound 2, and by the coupling
in “M” between H3-15 and H-3α observed in the COSY
experiment of 3. Therefore the absolute configuration of
compounds 2 and 3 should be 4S, 6R and 4R, 6R, respectively. Compound 4, obtained as a white amorphous powder,
exhibited in the IR spectrum bands of hydroxyl groups (3300 cm-1) and aromatic rings (1630, 1478, 1317,
1113, 961 cm-1). The molecular formula C
30H34O5 was
deduced from HRESIMS and in the EIMS, besides the molecular ion peak at m/z 474, two fragments at m/z 230 [C15H18O2]+ and 245 [C
15H17O3]+ indicated the presence
of two sesquiterpene moieties. The NMR spectroscopy (Tables 1 and 2) indicated that 4 had the same structure as
adenostin B21 (7) but bearing an additional hydroxyl group
Table 1. 1H NMR (500 MHz) spectroscopic data of compounds 1-4 in CDCl
3.d(m, J/Hz)
Positiona 1 2 3 4
1α [1a’] 3.08 (dd J 18.0, 6.0 ) 2.44 (ddd J 19.0, 8.0, 4.5) 2.52 (m) [2.67 (br, d J 17.0)] 1β [1b’] 2.43 (ddd J 18.0, 5.0, 1.5) 2.63 (dt J 19.0, 8.0) 2.52 (m) 3.80 (dd J 9.0, 3.0) [2.35 (br, dd J 17.0, 9.0)] 2a [2a’] 5.13 (tt J 6.0, 5.0) 1.86 (m) 1.95 (m) 4.78 (td J 9.0, 7.0) [1.66 (m)]
2b [2b’] 1.86 (m) 1.83 (m) [1.66 (m)]
3α [3a’] 1.99 (ddd J 14.0, 6.0, 5.5) 1.81 (m) 1.93 (m) 2.06 (m) [1.66 (m)] 3β [3b’] 1.84 (ddd J 14.0, 6.0, 5.0) 1.91 (m) 1.81 (m) 2.06 (m) [1.66 (m)] 4 [4’] 3.01 (qdd J 7.0, 5.5, 5.0) 3.26 (dqd J 11.0, 7.0, 3.5) [3.01 (dqd J 10.5, 7.0, 4.0)] 12 [12’] 7.38 (q J 1.0) 7.37 (q J 1.5) 7.35 (q J 1.0) 7.50 (q J 1.5) [5.34 (d J 3.0)] 13 [13’] 2.25 (d J 1.0) 2.25 (d J 1.5) 2.24 (d J 1.0) 2.28 (d J 1.5) 2.03 (s)
14 [14’] 1.67 (s) 1.91 (s) 1.85 (s) 2.46 (s) 2.50 (s)
15 [15’] 1.42 (d J 7.0) 1.70 (s) 1.59 (s) 1.25 d (7.0) [0.92 (d J 7.0)]
−OAc 2.05 (s)
aArbitrary atom numbering used in the literature.21
Table 2.13C NMR (125 MHz) spectroscopic data of compounds 1-4 in CDCl 3 d (m)
Positiona 1 2 3 4
1 [1’] 27.8 (t) 21.2 (t) 21.0 (t) 36.9 (d) [22.9 (t)]
2 [2’] 68.3 (d) 17.8 (t) 18.4 (t) 61.5 (d) [16.3 (t)]
3 [3’] 36.6 (t) 41.0 (t) 39.3 (t) 38.9 (t) [29.6 (t)]
4 [4’] 29.8 (d) 75.5 (s) 74.6 (s) 30.0 (d) [28.5 (d)]
5 [5’] 160.0 (s) 155.2 (s) 160.9 (s) 137.8 (s) [134.7 (s)]
6 [6’] 72.1 (s) 72.7 (s) 74.3 (s) 121.7 (s) [125.0 (s)]
7 [7’] 140.6 (s) 141.5 (s) 141.7 (s) 127.7 (s) [124.2 (s)]
8 [8’] 144.9 (s) 144.6 (s) 144.8 (s) 144.3 (s) [144.6 (s)]
9 [9’] 173.8 (s) 174.6 (s) 174.7 (s) 134.2 (s) [134.2 (s)]
10 [10’] 128.8 (s) 132.2 (s) 130.2 (s) 118.7 (s) [124.5 (s)]
11 [11’] 120.3 (s) 120.3 (s) 120.0 (s) 116.3 (s) [89.1 (s)]
12 [12’] 144.8 (d) 145.0 (d) 144.8 (d) 141.5 (d) [90.8 (d)]
13 [13’] 8.8 (q) 9.0 (q) 8.8 (q) 11.2 (q) [26.3 (q)]
14 [14’] 26.4 (q) 28.5 (q) 32.2 (q) 13.7 (q) [12.5 (q)]
15 [15’] 21.8 (q) 29.6 (q) 29.7 (q) 20.3 (q) [20.8 (q)]
−OAc 170.5 (s)
21.4 (q)
whose gem proton appeared at dH 4.78. This proton was
identified as H-2 by its correlations with H-1 and H2-3 in the COSY experiment and by its cross peaks observed in the HMBC experiment, with C-3 and C-12'. The position of the hydroxyl group was also supported by the deshielding effect in C-1 (Dd 6.44) and C-3 (Dd 10.14), as well as the shielding in C-12' (Dd −5.61), as compared to the corresponding carbon resonances in adenostin B.21
The NOESY experiment showed interactions of H-12' with H-1 and H3-13', and of H-2 with H3-15 and H-1, suggesting that they are in the β side of the molecule as H3-15, and therefore being indicative of an α-orientation the hydroxyl group at C-2.
Structures of the known compounds cacalone (5),6 epi-cacalone (6),6 adenostin B (7),21 cacalol (8),21 cacalol
acetate (9),22 cacalohastine (10),23 adenostylide (11),24
radulifolin C (12),10 radulifolin D (13),9 epi-radulifolin F (14),9 hyperin (15),25 β-caryophyllene-(8R,9R)-oxide (16),26
spathulenol (17),27 and caryolane-1,9β-diol (18),26
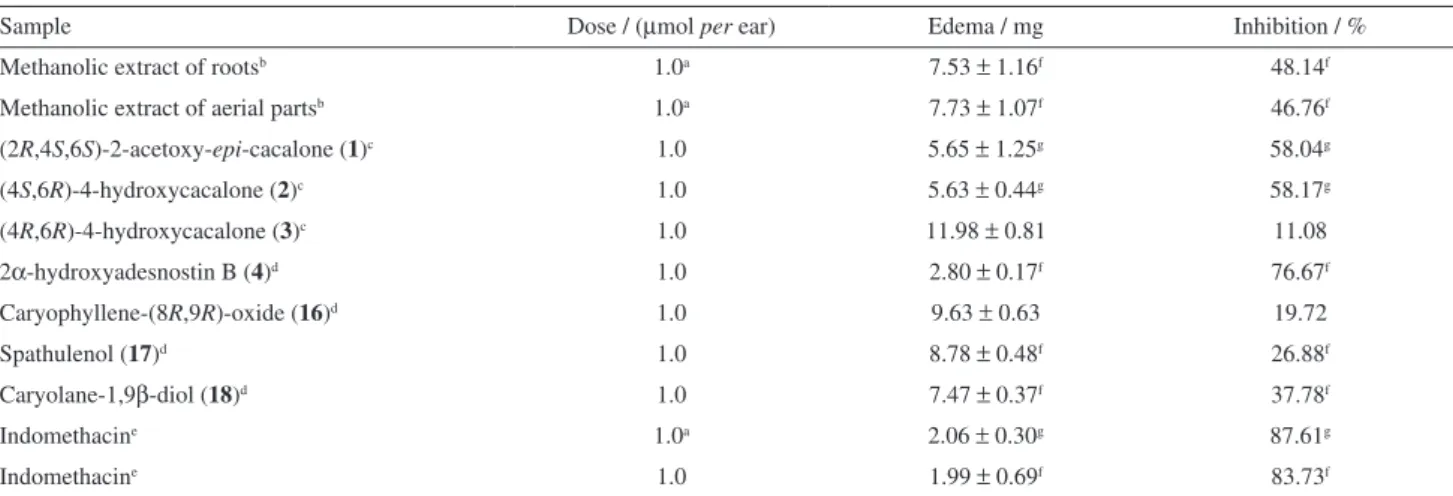
Table 3. Effect of extracts and compounds 1-4, 16-18 on TPA-induced mouse edema
Sample Dose / (µmol per ear) Edema / mg Inhibition / %
Methanolic extract of rootsb 1.0a 7.53 ± 1.16f 48.14f
Methanolic extract of aerial partsb 1.0a 7.73 ± 1.07f 46.76f
(2R,4S,6S)-2-acetoxy-epi-cacalone (1)c 1.0 5.65 ± 1.25g 58.04g
(4S,6R)-4-hydroxycacalone (2)c 1.0 5.63 ± 0.44g 58.17g
(4R,6R)-4-hydroxycacalone (3)c 1.0 11.98 ± 0.81 11.08
2α-hydroxyadesnostin B (4)d 1.0 2.80 ± 0.17f 76.67f
Caryophyllene-(8R,9R)-oxide (16)d 1.0 9.63 ± 0.63 19.72
Spathulenol (17)d 1.0 8.78 ± 0.48f 26.88f
Caryolane-1,9β-diol (18)d 1.0 7.47 ± 0.37f 37.78f
Indomethacine 1.0a 2.06 ± 0.30g 87.61g
Indomethacine 1.0 1.99 ± 0.69f 83.73f
Each value represents the mean of three animals ± standard error; adose: mg per ear; control: bmethanol, 14.53 ± 0.38, cacetone-CH
2Cl2 1:1, 13.47 ± 0.38, dacetone-CH
2Cl2 1:1, 12.00 ± 1.50, eethanol-acetone 1:1, 15.00 ± 0.47; fp ≤ 0.05; gp ≤ 0.01.
Table 4. Dose response evaluation of 2α-hydroxyadesnostin B (4)
Sample Dose / (µmol per ear) Edema / mg Inhibition / % IC50 / (µmol per ear)
Control 16.54 ± 0.34
2α-hydroxyadesnostin B (4) 0.031 15.74 ± 0.68 4.84 0.41
0.1 13.34 ± 0.83a 19.35a r = 0.99
0.31 9.34 ± 1.14b 43.53b
1.0 5.12 ± 0.55b 69.04b
Indomethacinc 0.031 12.78 ± 1.21 13.36 0.24
0.1 10.74 ± 1.13a 27.19a r = 0.983
0.31 5.62 ± 0.89b 61.90b
1.0 2.88 ± 0.73b 78.76b
Each value represents the mean of five animals ± standard error; ap ≤ 0.05; bp ≤ 0.01; ccontrol 14.75 ± 1.13.
were determined by comparison of their physical and spectroscopic features with those reported in the literature. The absolute stereochemistry of cacalone (5) and
epi-cacalone(6) has been determined6 but, since their CD
data were not available in literature, they were obtained in the present work.
The anti-inflammatory activity of the methanolic extracts of roots and aerial parts, and that of compounds
1-4, and 16-18 was evaluated using the TPA model of
induced acute inflammation.11 Since the anti-inflammatory
properties of compounds 5-15 had been previously
reported,11,17,18 they were not tested in the present work.
As shown in Table 3, the extracts exhibited moderate activities (48.14 and 46.76% for roots and aerial parts, respectively). Compound 4, with 76.67% of edema
inhibition, was the most active compound showing a dose dependent activity with IC500.41 µmol per ear while that
Myeloperoxidase (MPO) is a biochemical marker for tissue content of polymorphonuclear leukocytes because MPO activity is well correlated with the number of infiltrated cells in inflamed regions.28,29 In the MPO activity
test compound 4 attenuated, in a dose-dependent manner,
the activity of MPO and showed a similar effect to that of indomethacin at 0.31 and 1.0 µmol per ear (Figure 2). The
Pearson’s correlation analysis between skin weight and the MPO activity of all biopsies of 4 showed a positive
correlation (r = 0.83, p < 0.001), indicating that edema inhibition of 4 is associated with the inhibition of infiltrated
neutrophils in the ear biopsy.
Experimental
General procedures
Melting points were determined on a Fisher-Johns melting point apparatus and are uncorrected. Optical rotations were determined on a Perkin-Elmer 343 polarimeter. Circular dichroism was obtained on a Jasco J-720 spectropolarimeter. UV and IR spectra were recorded on a Shimadzu UV 160U and a Bruker Tensor 27 spectrometer, respectively. 1D and 2D NMR spectra were obtained on a Varian-Unity Inova 500 MHz spectrometer with tetramethylsilane (TMS) as internal standard. EIMS were determined on a Bruker Daltonics Analysis 3.2 mass spectrometer. HRESIMS were performed on a Bruker micrOTOF II mass spectrometer with mass resolution of 16.500 FWHM, mass interval 50-20,000 m/z, and speed 40 Hz. Column chromatography was carried out under vacuum (VCC) on silica gel G 60 (Merck,
Darmstadt, Germany). Flash column chromatography (FCC) was performed on silica gel 230-400 (Macherey-Nagel, Germany). Sephadex column chromatography was developed with Sephadex LH 20 (Amersham Pharmacia Biotech AB, Sweden). Analytical TLC was carried out on silica gel 60 GF254 or RP-18W/UV254 (Macherey-Nagel, Germany) and preparative TLC on Si gel GF254 layer
thickness 2.0 mm or RP-18W/UV254 layer thickness 1.0 mm.
Plant material
Psacalium cirsiifolium (Zucc.) H. Rob. & Brettell was collected in Coatepec Harinas, Estado de México, México, in July 2008. A voucher specimen (MEXU 954570) was identified by Dr. José Luis Villaseñor and deposited at the Herbario del Instituto de Biología, Universidad Nacional Autónoma de México.
Extraction and isolation
Dried and ground roots (130 g) and aerial parts (180 g) were macerated separately with MeOH (three times a day for seven days each) at room temperature. The extract of roots (15 g) was fractioned by VCC eluted with a hexane-EtOAc-MeOH gradient system. The hexane eluates afforded fraction A. Fraction B was obtained with EtOAc-MeOH 19:1 and fraction C grouped the mixtures obtained with EtOAc-MeOH 9:1 and 4:1. Purification of fraction A (8.5 g) by VCC eluted with hexane-EtOAc gradient system afforded fractions A1 (hexane-EtOAc 19:1), A2 (hexane-(hexane-EtOAc 9:1), A3 (hexane-(hexane-EtOAc 4:1) and A4 (hexane-EtOAc 7:3). Fraction A1 (1.5 g) was purified by VCC, eluted with hexane-EtOAc 49:1, to give cacalol21 (8, 220 mg), cacalol acetate22 (9, 205 mg)
and cacalohastine23 (10, 18 mg). Fraction A2 (900 mg)
produced, after a FCC eluted with hexane-EtOAc 9:1, adenostylide24 (11, 350 mg) and 252 mg of a mixture which
(50 mg) was purified by preparative RPTLC (MeOH-H2O 2:3 × 4) to obtain cacalone6 (5, 12 mg) and epi-cacalone6
(6, 9 mg). Fraction A3 (380 mg) was purified by FCC
eluted with hexane-acetone 7:3 to obtain fractions A31 and A32. Purification of A31 (100 mg) by preparative RPTLC (MeOH-H2O 1:1) produced compounds 1 (12 mg)
and radulifolin C10 (12, 8 mg). Fraction A32 (48 mg)
by preparative RPTLC (MeOH-H2O 3:2 × 4) produced
compounds 2 (10 mg) and 3 (8 mg). Fraction A4 (466 mg)
purified by FCC (30 × 2 cm) eluted with hexane-acetone 7:3 followed by preparative RPTLC (MeOH-H2O 1:1 × 3) produced radulifolin D9 (13, 6 mg), adenostin B21 (7, 10 mg)
and compound 4 (12 mg). Fraction B (2.2 g) purified by
VCC eluted with CH2Cl2-MeOH gradient system produced
a fraction (150 mg obtained with CH2Cl2-MeOH 9:1
mixture) which was submitted to a preparative RPTLC (MeOH-H2O 1:1) to give epi-radulifolin F9(14, 58 mg).
Fraction C (1.2 g) was purified through a sephadex LH 20 column eluted with MeOH-H2O 1:1 to afford hyperin25 (15,
30 mg).The methanolic extract of the aerial parts (28 g) was worked out by VCC (30 × 10 cm) eluted with EtOAc-MeOH gradient system. Fractions eluted with EtOAc (4.5 g) were purified by VCC eluted with hexane-EtOAc gradient system to yield, from the hexane factions, β -caryophyllene-(8R,9R)-oxide26 (16, 45 mg) and from the hexane-EtOAc
19:1 eluates a mixture (800 mg) which by FCC eluted with hexane-EtOAc 9:1, produced spathulenol27(17, 12 mg),
caryolane-1,9β-diol26 (18, 10 mg), cacalol (8, 180 mg),
cacalone-epi-cacalone mixture (5 and 6, 250 mg), 1 (5 mg),
and 4 (9 mg). Fractions eluted with EtOAc-MeOH 4:1 (1.0 g)
afforded hyperin(15, 25 mg), by purification through a
sephadex LH 20 column eluted with MeOH-H2O 1:1.
Evaluation of anti-inflammatory activity
Animals
Male NIH mice weighing 25-30 g were maintained in standard laboratory conditions in the animal house (temperature 27 ± 1 °C) in a 12/12 h light-dark cycle, being fed laboratory diet and water ad libitum, following the Mexican official norm MON-062-Z00-1999.
TPA-induced edema model
The TPA-induced ear edema assay in mice was performed as previously reported,11 Tables 3 and 4.
Myeloperoxidase assay
Tissue MPO activity was measured in biopsies taken from ears 4 h after TPA administration using an adapted method of Bradley et al.28 and Suzuki et al.29 Each
mouse ear biopsy was placed in 1 mL of 80 mmol L-1
phosphate-buffered saline (PBS) pH 5.4 containing 0.5% hexadecyltrimethylammonium bromide (HTAB). Each sample was homogenized for 30 s at 4 °C with a small sample laboratory Tissue Tearor Homogenizer (OMNI International, model 125). The homogenate was freeze-thawed at room temperature 3 times, sonicated 20 s and centrifuged at 12,000 rpm for 15 min at 4 °C. The resulting supernatants (10 µL in quadruplicate) were poured into 96 well microplate and 180 µL of 80 mmol L-1
PBS (pH 5.4) without HTAB were added. Microplate was heated at 37 °C then, 20 µL of 0.017% hydrogen peroxide were added to each well. For the MPO assay, 20 µL of 18.4 mmol L-1 3,3’,5,5’-tetramethylbenzidine
in 50% aqueous dimethylformamide were added to start
the reaction. Microliter plates were incubated at 37 °C for 5 min. The reaction was stopped with 20 µL of 2 mol L-1
H2SO4. MPO enzyme activity was assessed colorimetrically
using a BioTekMicroplate Reader (EL × 808) at an absorbance wavelength of 450 nm. MPO activity test results were expressed as percent of the maximal activity, Figure 2.
Statistical analysis
All data were represented as percentage mean ±
standard error of mean (SEM). The statistical analysis was done by means of Student’s t-test, whereas analysis of variance ANOVA followed by Dunnett test were used to compare several groups with a control. P values p ≤ 0.05 and p ≤ 0.01 were considered to be significant. Pearson’s correlation coefficient was calculated for the edema and MPO results of compound 4.
(2R,4S,6S)-2-Acetoxy-epi-cacalone (1)
Colorless oil; [α]D25 +40.0° (c 0.08, CHCl 3); UV
(MeOH) λmax (log ε) 209 (4.35), 262 (3.06) nm; CD (c 6.6 × 10⁻⁵ mol L-1, MeOH) ∆ε
210 nm −838, ∆ε226 nm +593, ∆ε263 nm −134; IR (CHCl3) νmax /cm-1:3390, 1743, 1661; 1H NMR (CDCl
3, 500 MHz) see Table 1; 13C NMR (CDCl3,
125 MHz) see Table 2; EIMS m/z 244 [M-CH3COOH]+.
(100), 229 (75), 215 (70); HRESIMS m/z 327.1202 [M + Na]+ (calcd. for C
17H20NaO5, 327.1202).
(4S,6R)-4-Hydroxycacalone (2)
Colorless oil; [α]D25−6.6° (c 0.09, CHCl
3); UV (MeOH) λmax (log ε) 209 (3.53), 286 (2.97), 318 (3.23) nm; CD (c 2.7 × 10⁻⁴ mol L−1, MeOH) ∆ε
227 nm −31, ∆ε254 nm +41, ∆ε280 nm −0.02, ∆ε316 nm +8; IR (CHCl3) νmax/cm−1: 3400,
1660; 1H NMR (CDCl
3, 500 MHz) see Table 1; 13C NMR
(CDCl3, 125 MHz) see Table 2; EIMS m/z 262 [M]+. (8),
244 (12), 229 (100); HRESIMS m/z 269.1356 [M + Li]+
(calcd. for C15H18LiO4, 269.1360).
(4R,6R)-4-Hydroxycacalone (3)
Colorless oil; [α]D25 −18.7° (c 0.08, MeOH); UV
(MeOH) λmax (log ε) 209 (3.45), 293 (2.83), 317 (2.91) nm; CD (c 6.9 × 10⁻³ mol L-1, MeOH) ∆ε
220 nm−26, ∆ε254 nm +0.03, ∆ε273 nm −11; IR (CHCl3) νmax /cm -1:3400, 1660; 1H NMR
(CDCl3, 500 MHz) see Table 1; 13C NMR (CDCl 3, 125
MHz) see Table 2; EIMS m/z 262 [M]+. (5), 244 (15),
229 (100); HRESIMS m/z 269.1366 [M + Li]+ (calcd. for
C15H18LiO4, 269.1360).
2α-Hydroxyadenostin B (4)
White amorphous powder; [α]D25 −158.3° (c 0.13,
CD (c 3.8 × 10⁻⁵ mol L-1, MeOH) ∆ε212 nm −838, ∆ε230 nm
+578, ∆ε267 nm−111; IR (CHCl3) νmax/cm−1:3300, 1630,
1478, 1317, 1113, 961; 1H NMR (CDCl
3, 500 MHz) see
Table 1; 13C NMR (CDCl
3, 125 MHz) see Table 2; EIMS m/z
474 [M]+. (15), 245 (40), 230 (100), 215 (45); HRESIMS
m/z 497.2294 [M + Na]+ (calcd. for C
30H34NaO5, 497.2298).
Cacalone(5)
CD (c 8.1 × 10⁻⁵ mol L-1, MeOH) ∆ε227nm −175, ∆ε251 nm
+116, ∆ε275 nm −54, ∆ε319 nm +68.
Epi-cacalone (6)
CD (c 9.8 × 10⁻⁵ mol L-1, MeOH) ∆ε234 nm +845, ∆ε254 nm −16, ∆ε275 nm+38, ∆ε310 nm −5.
Conclusions
This study shows that the modified eremophilanes are the main secondary metabolites in Psacalium cirsiifolium in agreement with the chemotaxonomy of the genus Psacalium reported so far. The study of the anti-inflammatory properties of seven of the isolated metabolites, using the TPA-induced mouse edema model, revealed that the new eremophilane derivative 2α-hydroxyadenostin B (4)
was the most active compound and that this activity is associated with the inhibition of infiltrated neutrophils in the ear biopsy.
Supplementary Information
Comparative CD of epi-cacalone (6) and compound 1, and of cacalone (5) and compounds 2 and 3, 1H NMR
spectra of compounds 1-7, 13C and 2D NMR experiments
of compounds 1-4 are available free of charge at
http://jbcs.sbq.org.br as PDF file.
Acknowledgments
We are indebted to Rubén Gaviño, María Isabel Chávez, Héctor Ríos, Beatriz Quiroz, Ángeles Peña, Elizabeth Huerta, Rocío Patiño, Javier Pérez, Carmen Márquez, Eréndira García and Lizbeth Triana, for technical assistance.
References
1. Robinson, H.; Brettell, R. D.; Phytologia 1973, 27, 254. 2. Martínez, M.; Las Plantas Medicinales de México, 4a. ed.;
Botas: México, 1959, pp. 217-221.
3. Linares, E.; Bye, R.; J. Ethnopharmacol. 1987, 19, 153.
4. Alarcón-Aguilar, F. J.; Jiménez-Estrada, M.; Reyes-Chilpa, R.; González-Paredes, B.; Contreras-Weber, C. C.; Román-Ramos, R.; J. Ethnopharmacol. 2000, 69, 207.
5. Campos, M. G.; Oropeza, M.; Torres-Sosa, C.; Jiménez-Estrada, M.; Reyes-Chilpa, R.; J. Ethnopharmacol. 2009, 123, 489. 6. Inman, W. D.; Luo, J.; Jolad, S. D.; King, S. R.; Cooper, R. J.;
J. Nat. Prod. 1999, 62, 1088.
7. Contreras, C.; Román, R.; Pérez, C.; Alarcón, F.; Zavala, M.; Pérez, S.; Chem. Pharm. Bull. 2005, 53, 1408.
8. Alarcón-Aguilar, F. J.; Fortis-Barrera, A.; Angeles-Mejía, S.; Banderas-Dorantes, T. R.; Jasso-Villagómez, E. I.; Almanza-Pérez, J. C.; Blancas-Flores, G.; Zamilpa, A.; Díaz-Flores, M.; Román-Ramos, R.; J. Ethnopharmacol. 2010, 132, 400. 9. Garduño-Ramírez, M. L.; Delgado, G.; Rev. Soc. Quim. Mex.
2003, 47, 160.
10. Garduño-Ramírez, M. L.; Trejo, A.; Navarro, V.; Bye, R.; Linares, E.; Delgado, G.; J. Nat. Prod. 2001, 64, 432. 11. Arciniegas, A.; Pérez-Castorena, A. L.; Nieto-Camacho, A.;
Villaseñor, J. L.; Romo de Vivar, A.; J. Mex. Chem. Soc. 2009, 53, 229.
12. Correa, J.; Romo, J.; Tetrahedron 1966, 22, 685.
13. Joseph-Nathan, P.; Negrete, M. C.; González, M. P.; Phytochemistry 1970, 9, 1623.
14. Burgueño-Tapia, E.; Hernández-Carlos, B.; Joseph-Nathan, P.; J. Mol. Struct. 2006, 825, 115.
15. Pérez-Castorena, A. L.; Castro, A.; Romo de Vivar, A.; Phytochemistry 1997, 46, 1297.
16. Pérez-Castorena, A. L.; Arciniegas, A.; Villaseñor, J. L.; Romo de Vivar, A.; Rev. Soc. Quim. Mex. 2004, 48, 21. 17. Jiménez-Estrada, M.; Reyes, C. R.; Ramírez, A. T.; Leidas, F.;
Hansberg, W.; Arrieta, D.; Alarcon, A. F.; J. Ethnopharmacol.
2006, 105, 34.
18. Acevedo-Quiroz, N.; Domínguez-Villegas, V.; Garduño-Ramírez, M. L.; Nat. Prod. Comm. 2008, 3, 313.
19. Richards, J.; Hendrickson, J.; Biosynthesis of Steroids, Terpenes, and Acetogenins, WA Benjamin, Inc.: New York, 1964, pp. 225-237.
20. Kalinowski, H.-O.; Berger, S.; Braun, S.; Carbon-13 NMR Spectroscopy, John Wiley & Sons: New York, Singapore, 1988, pp. 118-122.
21. Sun, X.-B.; Xu, Y.-J.; Qiu, D.-F.; Yuan, C.-S.; Helv. Chim. Acta
2007, 90, 1705.
22. Bohlmann, F.; Zdero, C.; Phytochemistry 1978, 17, 1135. 23. Hayashi, K.; Nakamura, H.; Mitsuhashi, H.; Phytochemistry
1973, 12, 2931.
24. Kuroyanagi, M.; Naito, H.; Noro, T.; Ueno, A.; Fukushima, S.; Chem. Pharm. Bull. 1985, 33, 4792.
26. Heymann, H.; Tezuka, Y.; Kikuchi, T.; Supriyatna, S.; Chem. Pharm. Bull. 1994, 42, 138.
27. Juell, S. M.-K.; Hansen, R.; Jork, H.; Arch. Pharm. 1976, 309, 458.
28. Bradley, P. P.; Priebat, D. A.; Christensen, R. D.; Rothstein, G.; J. Invest. Dermatol. 1982, 78, 206.
29. Suzuki, K.; Ota, H.; Sasagawa, S.; Sakatani, T.; Fujikura, T.; Anal. Biochem. 1983, 132, 345.
Submitted: June 28, 2012