Exhaustive Exploration of Prisoner’s Dilemma Parameter
Space in One-Dimensional Cellular Automata
Marcelo Alves Pereira†, Alexandre Souto Martinez‡ Departamento de F´ısica e Matem´atica - FFCLRP - USP
Av. Bandeirantes, 3900, 14040-901 Ribeir˜ao Preto, SP, Brazil † [email protected]
Aquino Lauri Esp´ındola
Departamento de Medicina Social - FMRP - USP Departamento de F´ısica e Matem´atica - FFCLRP - USP
Av. Bandeirantes, 3900, 14040-901 Ribeir˜ao Preto, SP, Brazil
Received on 29 October, 2007
The Prisoner’s Dilemma (PD) is one of the most popular games of the Game Theory due to the emergence of cooperation among competitive rational players. In this paper, we present the PD played in cells of
one-dimension cellular automata, where the number of possible neighbors that each cell interacts,z, can vary. This
makes possible to retrieve results obtained previously in regular lattices. Exhaustive exploration of the parame-ters space is presented. We show that the final state of the system is governed mainly by the number of neighbors
zand there is a drastic difference if it is even or odd.
Keywords: Prisoner Dilemma; Emergence of Cooperation; Game Theory; One-dimensional cellular automata; Non-equilibrium phase transition
I. INTRODUCTION
Due to the emergence of cooperation between competitive rational players [1–4], the Prisoner’s Dilemma (PD) [5, 6] is one of the most popular games of the Game Theory [7]. When it is played repeatedly, one has the Iterated Prisoner’s Dilemma [8, 9]. If the PD is played in a group of players with spatial structure, this version is known as Spatial Prisoner’s Dilemma (SPD) [10]. These spatial structures may generate chaotically changing spatio-temporal patterns. Cooperators and defectors coexist, and cooperator proportion oscillates in-definitely. This occurs when each player interacts with the nearest neighbors, for instance, in a square lattice. Moreover, adding the interaction with the next nearest neighbors (corre-sponding to the chess king possible moves) the spatial patterns are smoother. During the game, cooperators and defectors or-ganize themselves in clusters. The most interesting dynamics occurs on the borders of these clusters, causing the oscillating behavior of the proportion of cooperators.
The final proportion of cooperators and defectors in the chaotic phase depends on the initial configuration and the magnitude of the parameter T (temptation). Moreover, the connectivity among players also plays an important role in the dynamics of the clusters [11]. Studies about PD had been carried out in different topologies such as square lattice [10], graphs [12] and also in complex networks as random graphs [11], scale-free networks [13], small-word networks [14]. We have used the simplest lattice topology, i.e. one-dimensional lattice to represent regular lattices at any dimen-sionality [15]. The computational implementation of PD in the one-dimensional case is simpler than in other topologies,
and it requires less computational time to run the numerical codes. In one-dimensional cellular automata, it is simpler to understand the way that oscillations in the cooperator propor-tion take place [15]. Beyond the topologies, it is also possible to consider the mobility of players [16].
In this paper we present an exhaustive exploration of the parameter space for the IPD in the one-dimensional cellular automata with a variable number of interacting neighbors. Af-ter introducing the model in Section II, we show the results in Section III. Final remarks are presented in the Section IV.
II. THE MODEL
Consider a cellular automaton in a one-dimensional lattice, withLcells, where each cell represents one player, who has two possible states: θ=1 (θ=0) for cooperator (defector). The automaton has no empty cells, so the cooperator propor-tions,ρc(t), and defectors,ρd(t), leads toρc(t) +ρd(t) =1. The initial proportion of cooperators,ρc(0) =ρ0, 0≤ρ0≤1,
is an important parameter. The state ofLρ0 players, which
are chosen randomly by a uniform distribution, are set as co-operators and the remaining ones are set as defectors. The neighborhood of thei-th player is defined byz= (1,2, . . . ,L). Ifzis even, there areα=z/2 adjacent interacting players to the right and to the left hand side of this player. Ifzis odd, each side hasα= (z−1)/2 players and playeriinteracts with his/her own state (self-interaction) [15, 19, 20]. In addition to
ρ0andzthe other free parameter in this model is the
tempta-tionT in the conflict range 1≤T ≤2.
of playeridue to interaction with player jis given bygθi,θj=
θiθj+T(1−θiθj)θj, whereθjis the state of playerj, withj= (1,2, . . . ,L). The total payoff,Pi, of playeriis:Pi=∑Vigθi,θj, , where
V
i is the neighborhood of the i-th agent. Since the payoff of each player depends onz, the macroscopic regime,ρc, also depends on it. Playeriwill comparePitoPk, where Pkis the payoff ofk= (1,2, . . . ,z)set of players. IfPi<Pk, playericopies the state of the player with the highest payoff, otherwise playeridoes not change his/her current state. The dynamics of the model is totally deterministic. This strategy of copying the state of the neighbor that had the highest payoff is the Darwinian Evolutionary Strategy. Others evolutionary strategies can be adopted, like the Pavlovian one [21]. The states of the players are updated synchronously and they play until the system reaches a stationary or dynamical equilibrium regime.
The cooperator proportion,ρc(t,T,ρ0,z), depends on time,
temptation, initial proportion of cooperators, and the number of interacting players. The dependence of ρc as a function ofρ0andzis commonly neglected, possibly due to the fixed
lattice restriction in ad-dimensional space.
The asymptotic cooperator proportion, ρ∞(T,ρ0,z), is
ob-tained when the system reaches the steady state, which repre-sents the final phase for the set of parameters(T,ρ0,z). The
dependence ofρ∞onzcan be understood due to the number of interacting cooperators,c, with 0≤c≤z, in the neighborhood of each player. When playeriinteracts withcicooperators out ofzneighbors, his/her payoff is [11, 19]:P(ci)
i (θi) = [T−(T− 1)θi]ci. Some useful relations follow immediately: for a co-operatorP(ci)
i (1) =c, while for a defectorP (ci)
i (0) =cT. For T>1,P(ci)
i (0)>P (ci)
i (1)andP (c) i (θ)≥P
(c−1)
i (θ). Transitions inρ∞(T)occur when temptation crosses threshold values. In the conflict range, 1<T <2, these transitions are controlled by [11]:Tc(n,m) = (z−n)/(z−n−m), where 0≤n<zand 1≤m≤int[(z−n−1)/2)]are integers.
III. RESULTS
We have used a one-dimensional cellular automaton with L=1,000 cells, withLρ0cells set as cooperators and the
re-maining ones as defectors. The asymptotic cooperator propor-tion,ρ∞, is obtained from the mean values of an ensemble of 1,000 configurations for the same initial parameters. The pa-rameterT increases in steps∆T=0.01 in the range 1<T<2 andρ0increases in steps∆ρ0=0.1 and the intermediate
val-ues are linearly interpolated.
It could seem meaningless to considerT =1.00, as the co-operators and defectors have the same payoff, when one plays against the other. However, the total payoff of each player de-pends on the neighborhood, then, if the player belongs to a cooperative cluster he/she has a higher payoff than the player from a defective one. In the cooperative/defective clusters border, the differences among payoffs are essential to deter-mine the system dynamics [15].
Results for ρ0=0 andρ0=1 are the trivial cases due to
the Darwinian Evolutionary Strategy. In a population of
co-operators (defectors) it is not possible to emerge a defector (cooperator), because the players only can copy the states of their neighbors. Mutations are not allowed in our model, i.e. the noise of the system is null [22].
Our results are equivalent to those obtained in the square lattices, which are briefly reviewed in the following. Con-sider four scenarios. First, defectors can dominate the system and determine the complete extinction of cooperators, lead-ing the system to a defective phase (ρ∞=0). Second, de-fectors can increase and domain the system, but cooperators are not extinguished, resulting in a defective phase as well (0<ρ∞<0.5). Third, cooperators may domain the system forming a cooperative phase (0.5<ρ∞<1.0). And finally, cooperators can extinguish the defectors determining a coop-erative phase (ρ∞=1.0).
Figures 1a and 1b show the surface ofρ∞plotted as a func-tion ofT andρ0, forz=8 (without self-interaction) andz=9
(with self-interaction), respectively. Differences between the presence/absence of self-interaction are clear. The region of low values ofT and high values ofρ0is a cooperative phase.
The region of high values ofT and low values ofρ0is a
de-fective phase. The other two regions, lowT and lowρ0 or
highT and highρ0, the value ofρ∞is different and depends strongly whetherzis even or odd. The valleys forρ0∼0.9
are due to the system dynamics. For higher values ofρ0, the
defective clusters formed are tiny in comparison to the coop-erative ones. These defectors exploit theirs cooperator neigh-bors, but they neither do not invade the cooperative cluster nor are extinguished by the cooperative neighborhood during time evolution.
Another visualization ofρ∞ forz=8 is given in Figures 2a and 2b, and forz=9 in Figures 2c and 2d. It is equiva-lent to observe the phase diagram plotted as surface in Figures 1a and 1b from the top view. The images 2b and 2d are the standard deviation ofρ∞ due to statistics to avoid the initial configuration dependence. Figures 2b and 2d, show very high values of standard deviation. In these regions, small changes in the initial configuration drastically modifyρ∞from a co-operative phase, ρ∞>0.5, to a defective phase, ρ∞<0.5. Thus, in this region, it is not possible to define the system as cooperative or defective, and this region is considered as the coexistence of cooperative/defective phases. In other words, the chaotic phase. The inclusion of self-interaction implies in larger cooperation area in the phase diagram as shown in Figures 2a and 2c. This means that cooperation prevails when self-interaction is included. In Figure 2a,ρ∞drops abruptly forT >1.7, this rapid decay does not occur in Figure 2c, be-cause self-interaction shiftsTcto higher values. In Figure 2d, the higher values of standard deviation fulfill a larger area, especially for T >1.7, for the same reasons. When Tc is shifted, a region that should be cooperative, when the self-interaction is present, becomes defective in the absence of the self-interaction.
The sliceρ∞ρ0of Figure 1 showsρ∞as a function ofρ0.
(a)
1
1.5
2 0
0.5 1 0
0.5 1
ρ0
T
ρ∞
(b)
1
1.5
2 0
0.5 1 0
0.5 1
ρ 0
T
ρ ∞
FIG. 1: Phase diagram,ρ∞(asymptotic proportion of cooperators) as
function ofT(temptation),ρ0(initial proportion of cooperators) and
z(number of interacting players of each player) plotted as a surface.
(a)z=8 (without self-interaction); (b)z=9 (with self-interaction).
T ρ0
(a)
1 1.2 1.4 1.6 1.8 2
0 0.2 0.4 0.6 0.8 1
0 0.2 0.4 0.6 0.8 1
T ρ0
(b)
1 1.2 1.4 1.6 1.8 2
0 0.2 0.4 0.6 0.8 1
0.05 0.1 0.15 0.2 0.25 0.3 0.35 0.4 0.45
T ρ0
(c)
1 1.2 1.4 1.6 1.8 2
0 0.2 0.4 0.6 0.8 1
0 0.2 0.4 0.6 0.8 1
T ρ0
(d)
1 1.2 1.4 1.6 1.8 2
0 0.2 0.4 0.6 0.8 1
0 0.05 0.1 0.15 0.2 0.25 0.3 0.35 0.4 0.45
FIG. 2: (a) Top view of Figure 1a, ρ∞ as function ofT and ρ0
forz=8 (without self-interaction); (b) standard deviation ofρ∞ as
function of T and ρ0 forz=8 (without self-interaction); (c) Top
view of Figure 1b,ρ∞as function ofT andρ0forz=9 (with
self-interaction); (d) standard deviation ofρ∞as function ofT andρ0for
z=9 (with self-interaction).
emergence of cooperation to lower values ofρ0, when
com-pared to a system without self-interaction. In Table I, one sees the values ofρ0, whereρ∞>0.5 occurs for the first time for different values ofT. Notice the strong difference concerning the parity ofz.
T z=8 z=9
1.0 0.3 0.1
1.2 0.5 0.2
1.4 0.6 0.5
1.6 0.7 0.6
1.8 1.0 0.7
2.0 1.0 1.0
TABLE I: Values ofρ0, when occurs ρ∞ >0.5 for the first time,
for different values of T, for a system with z=8 (without
self-interaction) andz=9 (with self-interaction).
Theρ∞ non-monotonous behavior for intermediate values ofρ0presented in Figures 1 and 3, in the region 1.3<T <
1.5 and 0<ρ0<0.5 are due to the coexistence phases. In
this region, the standard deviation ofρ∞is higher than in the remaining regions.
(a)
0 0.2 0.4 0.6 0.8 1
0 0.1 0.2 0.3 0.4 0.5 0.6 0.7 0.8 0.9 1
ρ0
ρ∞
(b)
0 0.2 0.4 0.6 0.8 1
0 0.1 0.2 0.3 0.4 0.5 0.6 0.7 0.8 0.9 1
ρ0
ρ∞
FIG. 3: Slice of the planeρ∞(T,ρ0,z)ρ0of the surfaces. Asymptotic
proportion of cooperators (ρ∞) as function of initial proportion of
cooperators (ρ0) for (a)z=8 (without self-interaction) and (b)z=9
(with self-interaction). Asterisks: 2.0; Stars: T =1.8; Diamonds:
T=1.6; Squares:T=1.4; Triangles:T=1.2; Circles:T=1.0.
To observe the behavior ofρ∞, whenzincreases, see the surfaces ofρ∞for z=20, in Figures 4a, andz=19, Figure 4b. Comparing Figures 1a and 1b, one observes that ifzis increased, the surfaces become more similar.
stan-(a) 1 1.5 2 0 0.5 1 0 0.5 1 ρ 0 T ρ∞ (b) 1 1.5 2 0 0.5 1 0 0.5 1 ρ0 T ρ∞
FIG. 4: Phase diagram,ρ∞(asymptotic proportion of cooperators)
as function ofT (temptation),ρ0(initial proportion of cooperators)
and z (number of interacting players of each player) plotted as a
surface. (a)z=20 (without self-interaction); (b)z=19 (with
self-interaction).
dard deviation for z=20 andz=19, respectively. A rele-vant difference between even and oddzis that the cooperative phase persists forT<1.1 in the range of 0.1<ρ0<0.5 in the
presence of self-interaction (see Figure 5c). If self-interaction is present the shift inTc to higher values remains in higher values ofz.
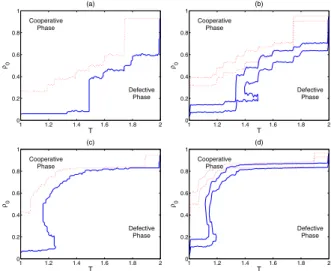
A slice of the plane Tρ0 of the ρ∞ surface in Figures 1a and 1b atρ∞=0.5, may represent a phase diagram. In Fig-ures 6a and 6c, the contours separate the cooperative/defective phases, i.e. the phase-diagram. Figures 6b and 6d are the con-tours that take into account the standard deviation. Since there is the phase coexistence, these contours separate the coopera-tive/coexistence/defective phases.
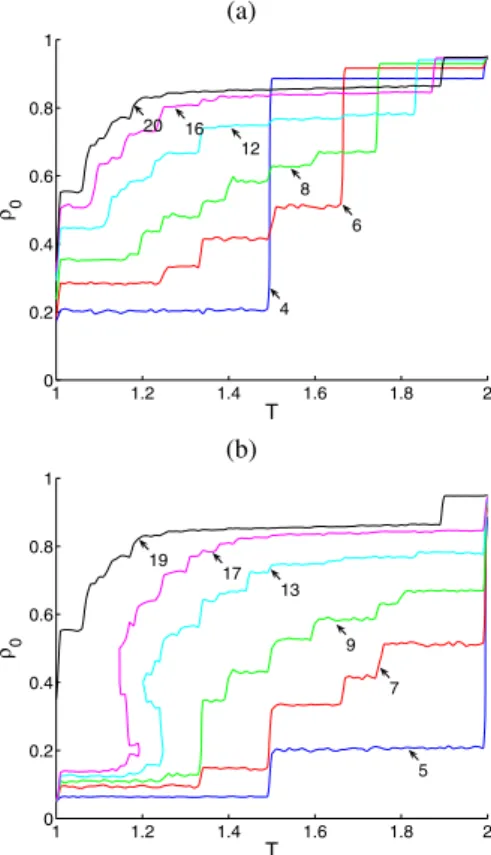
In Figures 7a and 7b, there are the contours of the cooper-ative/defective phase for differentzvalues. Whenzincreases the contours converge to the same pattern independently ifzis even or odd as shown in Figure 6c and 6d. For smallzvalues, thezparity generates remarkable differences in the contours, ifzincreases, the contours converge and present a similar form and the phase coexistence region is narrower than for smallz values.
IV. CONCLUSION
The Prisoner’s Dilemma in the one-dimensional cellular au-tomata yields results according to the results obtained
previ-T ρ0
(a)
1 1.2 1.4 1.6 1.8 2
0 0.2 0.4 0.6 0.8 1 0 0.2 0.4 0.6 0.8 1 T ρ0 (b)
1 1.2 1.4 1.6 1.8 2
0 0.2 0.4 0.6 0.8 1 0 0.05 0.1 0.15 0.2 0.25 0.3 0.35 0.4 0.45 T ρ0 (c)
1 1.2 1.4 1.6 1.8 2
0 0.2 0.4 0.6 0.8 1 0 0.2 0.4 0.6 0.8 1 T ρ0 (d)
1 1.2 1.4 1.6 1.8 2
0 0.2 0.4 0.6 0.8 1 0 0.05 0.1 0.15 0.2 0.25 0.3 0.35 0.4 0.45
FIG. 5: (a) Top view of Figure 4a,ρ∞ as function ofT andρ0 for
z=20 (without self-interaction); (b) standard deviation of ρ∞ as
function ofT andρ0 forz=20 (without self-interaction); (c) Top
view of Figure 4b,ρ∞as function ofT andρ0forz=19 (with
self-interaction); (d) standard deviation ofρ∞as function ofTandρ0for
z=19 (with self-interaction).
T ρ0
(a)
1 1.2 1.4 1.6 1.8 2
0 0.2 0.4 0.6 0.8 1 Cooperative Phase Defective Phase T ρ0 (b)
1 1.2 1.4 1.6 1.8 2
0 0.2 0.4 0.6 0.8 1 Cooperative Phase Defective Phase T ρ0 (c)
1 1.2 1.4 1.6 1.8 2
0 0.2 0.4 0.6 0.8 1 Cooperative Phase Defective Phase T ρ0 (d)
1 1.2 1.4 1.6 1.8 2
0 0.2 0.4 0.6 0.8 1 Cooperative Phase Defective Phase
FIG. 6: Phase diagram ofρ∞in the parameter space. (a)z=8 and
z=9, contours of the cooperative/defective phase; (b)z=8 andz=
9, contours of the cooperative/coexistence/defective phase; (c)z=20
andz=19, contours of the cooperative/defective phase; (d)z=20
andz=19, contours of the cooperative/coexistence/defective phase.
The coexistence phase the phase is the space between the first and
the second contours of the samez.
(a)
1 1.2 1.4 1.6 1.8 2
0 0.2 0.4 0.6 0.8 1
T
ρ 0
4 6 8 12 16 20
(b)
1 1.2 1.4 1.6 1.8 2
0 0.2 0.4 0.6 0.8 1
T
ρ 0
5 7 9 13 17 19
FIG. 7: Phase diagram ofρ∞ in the parameter space. (a) contours
of the cooperative/defective phase for even z= (4,6,8,12,16,20)
(without self-interaction); (b) contours of the cooperative/defective phase for oddz= (5,7,9,13,17,19)(with self-interaction). Notice
the difference due to the parity ofzis not so important forz≫1
comparison to these studies is that the state update of the play-ers is asynchronous [25, 26], but in our case is synchronous. Despite these differences, the main features due to thez vari-ation remain, such as the dependence on the asymptotic co-operator proportion on the neighborhood size. Our results are similar to those obtained by Dur´an and Mulet [11] consider-ing the neighboorhood with self-interaction (oddz). Compar-ing our results to those found in the literature, it is possible to see that the way the connection among the players is settled plays another important role in this problem independently of the space dimensionality or network structure.
For intermediate values ofT andρ0the chaotic phase
oc-curs. In the chaotic phase the outcomeρ∞can belong to the cooperative or defective phase due to only a small change in the initial distribution of the cooperators.
Acknowledgments
M. A. P. would like to thank CAPES for the fellowship. A. S. M. acknowledges the agencies CNPq (305527/2004-5) and FAPESP (2005/02408-0) for support. A. L. E. would like to thank CNPq for the fellowship and FAPESP and MCT/CNPq Fundo Setorial de Infra-Estrutura (06/60333-0) for the finan-cial support.
[1] D. Stauffer Physica A336, 1 (2004).
[2] J. P. Bouchaud Physica A313, 238 (2002).
[3] C. Anteneodo, C. Tsallis, and A. S. Martinez Europhys. Lett.
59 5, 635 (2002).
[4] P. E. Turner, L. Chao Nature398, 441 (1999).
[5] M. Dresher, The Mathematics of Games of Strategy: Theory
and Applications(Prentice-Hall, Englewood Cliffs, NJ, 1961).
[6] W. Poundstone,Prisoner’s Dilemma(Doubleday, New York,
1992).
[7] J. Neumann and O. Morgenstern,Theory of Games and
Eco-nomic Behavior(Princeton University Press, New York, 1947).
[8] R. Axelrod and W. D. Hamilton, Science211, 1390 (1981).
[9] R. Axelrod,The evolution of cooperation(Basic Books, New
York, 1984).
[10] M. A. Nowak and R. M. May, Nature359, 826 (1992).
[11] O. Dur´an and R. Mulet, Physica D208, 257 (2005).
[12] E. Lieberman, C. Hauert, and M. A. Nowak, Nature433, 312
(2005).
[13] Z. Wu, J. Guan, X. Xu, and Y. Wang, Physica A379, 672
(2007).
[14] G. Abramson and M. Kuperman, Phys. Rev. E 63, 030901
(2001).
[15] M. A. Pereira, A. S. Martinez, and A. L. Esp´ındola, arXiv:0708.3520v1 [physics.comp-ph] to appear in Int. J. of Modern Phys. C.
[16] M. H. Vainstein, A. T. C. Silva, and J. J. Arenzon J. Theor.
Biol.244 (4), 722 (2007)
[17] S. Wolfram, Science9, 2 (1983).
[18] M. A. Nowak and R. M. May, Int. J. Bifurcat. Chaos3, 35
(1993).
[19] R. O. S. Soares and A. S. Martinez, Physica A369, 823 (2006).
[20] D. Alves, P. R. A. Campos, A. T. C. Silva, and J. F. Fontanari,
Phys. Rev. E63, 011911 (2000)
[21] H. Fort, S. Viola J. Stat. Mech.1, P01010 (2005).
[22] A. Mukherji, V. Rajan, and J. R. Slagle, Nature 379, 125
(1996).
[23] G. Hardin Science162, 1243 (1968).
[24] M. Gardner Scientific American223, 120 (1970).
[25] M. Ifti, T. Killingback, and M. Doebeli J. Theor. Biol.231, 97
(2004).
[26] F. C. Santos and J. M. Pacheco Phys. Rev. Lett.95, 098104