A Work Project, presented as part of the requirements for the Award of a Master Degree in Finance from the NOVA – School of Business and Economics.
The Impact of Corporate Environmental Management on the Cost of Debt Financing: Evidence from Europe, Japan and Australia.
Florian Hansen 29376
A Project carried out on the Master in Finance Program, under the supervision of: Francisco Queiró
1 Abstract:
This study investigates the impact of the corporate environmental management on firms’ cost of debt financing. Using environmental scores issued by Thomas Reuters on 138 firms in Europe from 2007 to 2016, I find that environmental performance has a negative relationship
with the cost of debt financing. This relationship holds in Europe and for bonds whose maturity is higher than five years. However, the economic significance of this relationship is modest, suggesting that the environmental management has a minor influence on firms’ risk.
2 1. Introduction
A recent survey published by the CFA (2017) reveals that 73% of investors take the environmental, social and governance (ESG) factors into account in their investment
decisions. Moreover, this survey found that the relevance of each of the three ESG factors has increased between 2015 and 2017. This increased awareness of ESG factors has developed in response to events such as the BP oil spill in 2010 and the Volkswagen Diesel scandal in 2015. These two events clearly demonstrated the influence that environmental performance (EP) can have on firms’ stock price and credit ratings. Indeed, the stock price of Volkswagen fell dramatically after admitting the creation of a deception mechanism and issuing a public apology on 18th September 2015. Shortly after this public announcement of wrongdoings, Standard and Poor’s downgraded the long-term credit rating of Volkswagen from A to A- and then BBB+ later that year. The strength of the market reaction after the BP oil spill and the Volkswagen scandal implies that the environmental factors are of particular importance. While the effects of the environmental performance (EP) in the equity market have been studied extensively, little is known about its influence in the bond market. This study provides some insight into this relationship.
In this paper, I investigate the relationship between the cost of debt financing and EP in Europe, Australia and Japan. In particular, I examine the conditions under which this relationship holds. I attempt to answer the following questions: Is there a relationship between the cost of debt financing and the EP? How does this relationship change across bond maturities and how does this relationship change across industries and regions? This research is based on the theory that EP can lower reputational, legal and regulatory firms’ risks. This lower risk is translated into lower risk premium in the bond market. To answer those questions, I used the environmental scores (ES) provided by Thomas Reuters as proxy for EP. I hypothesize that the firms with higher ES show lower risk and hence risk premium.
3
Better understanding of the environmental risk could provide investors with further information about their risk exposure and assist them in making investment decision. This could also help managers make decisions about improving their EP as they could better judge whether their environmental investments will bring about financial benefits.
I also include the Social and Governance Score in the analysis. However, it is not the purpose of the paper to give a comprehensive analysis of their relationship with the cost of debt financing. The primary focus of this paper is the EP.
Consistent with the theory, this study documents a statistically significant negative relationship between the cost of debt financing and the environmental management. Firms’ commitment and effectiveness towards reducing emissions and firms’ ability to create innovative products and innovative way to reduce environmental cost are the two factors leading to a lower cost of debt. However, the results are not economically significant with a maximum reduction of 2.27 basis point. Furthermore, the study finds that the negative relationship between the cost of debt financing and the EP holds especially for bonds issued in Europe and bonds whose maturity is higher than 5 years. Finally, my analysis did not provide evidence about a consistent stronger relationship in high risk industries. However, the difference in cost of debt between the best environmentally performing firms and the worst ones is higher in high-risk industries.
This paper contributes to the literature in many ways. First, it confirms the existence of a negative relationship between EP and the cost of debt in Europe, whereas most of the studies had been focused in the U.S. (e.g. Schneider, 2010; Bauer and Hann, 2010; Chava, 2014). Second, it provides evidence that EP have incremental explanatory power on the cost of debt financing when controlling for the social and governance performances. Earlier literature describes the relationship between the ESG factors and the cost of debt financing but does not provide a detailed description of the effects of each of the ESG factors on the cost of debt
4
financing (Goss and Roberts, 2009). Lastly, this paper examines the strength of the relationship across bonds maturity, which has never been previously investigated.
This paper is organized as follows. Section 2 describes the framework and the theory used to explain the relationship between the EP and the cost of debt financing. Section 3 provides a description of the finding of the recent literature on this topic. Section 4 provides
background for further hypothesis formulation and formulates hypotheses. Section 5
describes the data sample and the methodology used to test the different hypotheses. Section 6 shows the empirical evidence. Section 7 explains the tests performed to ensure the
robustness of the results. Section 8 discusses alternative explanation. Section 9 summarizes the results and discusses the potential limitations.
2. Theory
Firms’ cost of debt financing is influenced by the default risk on their bonds. This default risk is the probability that the firms do not pay back entirely the principal or the interests on a bond and mainly depends on the uncertainty of their futures activities (Orlitzky and Benjamin, 2001). Therefore, the EP can influence firms’ cost of debt financing if it influences their default risk.
Sharfman and Fernando (2008) argue that EP affects the riskiness of firms in different ways. First, firms have an environmental liability, damages to the environment caused by a firm can give rise to substantial clean-up costs, increasing tail risk (Husted, 2005). Second, EP also influences the reputational risk. Customers and investors can turn away from a brand due to firms’ involvement in environmentally irresponsible practice (Garber and Hammitt, 1998). Third, regulatory risk is also impacted by EP as firms have to make investment to comply to new regulation (Testa, Iraldo, Frey, 2011). By mitigating clean-up cost, reputational and regulatory risks, the EP decreases the risk premium paid on bonds.
5
Prior literature already investigated the relationship between those risk and the cost of debt. Barth and McNichols (1994) found that environmental liabilities, which is a clean-up cost risk, have incremental explanatory power to recognized liabilities and assets in
determining the equity value of a firm and Graham and Maher (2006) reports that both bond yields and ratings are influenced by firm’s potential environmental liability. Other studies also found that debt market takes into consideration the potential impact of the environmental liability on borrowers’ solvency (Pitchford, 2001; Boyer and Laffont, 1995; Heyes, 1996; Kroszner and Strahan, 2001). Regarding the reputation risk, Albuquerque, Durnev and Koskinen (2014) found that firms with better CSR performances show lower risk due to a higher customer loyalty. The literature is sparser when it comes to the regulatory risk as it is difficult to measure.
To conclude, I explain the negative relationship between the cost of debt financing and the EP through lower risks. Indeed, firms with strong EP will have lower clean-up cost,
reputational and regulatory risks, leading to lower default risks and hence to lower risk premium on their bonds.
3. Recent literature
Previous studies on the relationship between environmental management and the cost of debt financing mainly proxied environmental management using two databases: The Toxic Release Inventory (TRI), which requires firms to release toxic chemicals above a certain threshold, and Kinder, Lydenberg, Domini & Co., Inc (KLD), a financial advisor providing social screening of firms to clients through its reports and socially screened mutual funds.
Using the KLD database to screen firms showing concerns in terms of hazardous chemical, substantial emissions, and climate change, Chava (2014) shows that firms with these environmental concerns are charged a higher interest rate on bank loans and have lower institutional ownership in the United States. He found that a firm with environmental
6
concerns in all categories of the KLD database pays 25 basis point more per annum than a firm that has no environmental concerns. Goss and Roberts (2009) also uses the KLD database to examine the relationship between CSR performance and a sample of bank loans to U.S. firms. They found a 5 to 11 basis points lower risk premium for best CSR performer but argue that the difference is not economically significant. Bauer and Hann (2010)
investigate the relationship between the credit risk and firms’ environmental management using the KLD database. They find that in the US market, EP is negatively related to cost of debt and positively related to credit rating. Moreover, they find that this relationship has strengthened over the last decade. They report a maximum reduction of 64 basis points per annum. Schneider (2010) uses the Toxic Release Inventory (TRI) to assess firms’
environmental management in the pulp and paper or chemicals industry in the United States. He finds respectively a 10.98 and 11.34 basis points increase per pound of toxic chemicals released for the pulp and paper and chemical industries, with an average of 2.86 pounds of toxic chemicals releases. However, TRI data had been criticized for, among other things, inaccuracy in firm reporting (Toffel and Marshall, 2004). Sharfman and Fernando (2008), on the other hand, investigated the relationship between the firms’ EP and weighted average cost of capital in the US market using both TRI and KLD database and found a 5-basis point increase in the firms’ cost of debt financing with better environmental risk management. However, they attribute this increase to an increase in leverage.
In addition to these two datasets, Chen and Gao (2012) use carbon emission rates from the Emissions and Generation Resource Integrated Database (EGRID), issued by the Environmental Protection Agency, to test whether corporate climate risk was priced in the capital markets for the U.S. electric company. They conclude that the cost of equity and the cost of debt increases with the level of exposure to climate risk.
7
The literature is sparse when it comes to the relationship between the environmental management and the cost of debt financing outside the United States. Clarkson et al (2014) uses a voluntary Carbon Emissions survey to test the relationship between firms’ exposure to carbon-related risk and cost of debt in Australia. They find a 73 basis point increase in the cost of debt per 1 standard deviation increase in the carbon-related risk.
Other studies also observe that the Chinese financial market reacts weakly on
environmental news (Xu, Zeng and Tam, 2011). Using the Asset4 database, Feng et al (2015) found a decrease in the cost of equity for firms with better CSR management in North
America, Europe and Africa. However, there was no such relationship in Asia.
To conclude, most of the previous literature has found a negative relationship between the cost of debt financing and the EP in the United States. However, mixed results have been found outside of the U.S., indicating that the strength relationship depends on the region in question.
4. Hypothesis Development
Building on the previous literature, this section formulates hypothesis about the relationship between EP and the cost of debt financing. If these hypotheses are true empirically, there is a relationship between the two factors. Moreover, testing these
hypotheses will also prove that EP influences the cost of debt by reducing firms’ riskiness. 4.1. Environmental management
As explained in the previous section, firms with strong EP will have lower clean-up cost, reputational and regulatory risks, leading to lower default risks and hence to lower risk premium on their bonds.
8 4.2. Time to maturity
Earlier literature has already shown that the time to maturity has a positive relationship with the cost of debt financing (Chava, 2014; Bauer and Hann, 2010). The concern here is different; I will be examining the relationship between the cost of debt financing and the environmental factors across bonds time to maturity.
Bonds with longer time to maturity present higher interest and business risk (Chen et al., 2007). In particular, the longer the maturity, the higher the probability of environmental scandals. Therefore, reducing those risks should therefore be more beneficial for bonds with higher maturity.
“Hypothesis 2: The negative relationship between EP and the cost of debt financing is stronger for bonds with a longer maturity.”
4.3. High-risk Industries
Barth and McNichols (1994) found that firms listed as potentially responsible parties for Superfund liabilities had an implicit environmental liability, which they concluded was incremental to the one already existing in the balance sheet. The literature also found that those firms had lower bonds ratings and higher yields. (Graham, Maher, and Northcut ,2001; Graham and Maher, 2006). There is therefore a misreported environmental liability that influences the bond yield and rating. As practices and environmental risk vary across industries, the misreported environmental liability may also differ across industries.
Another possible source of differences across industries is legislation. Schneider (2010) suggested that some industries were more affected than other by the Toxic Release Inventory. In particular, he found that the cost of debt of firms operating in the chemicals and pulp and paper industries was influenced by the EP. Bauer and Hann (2010) also found that firm in the pulp and paper industry were penalized at a higher rate for environmental concerns.
9
“Hypothesis 3: Firms in certain industries will show a stronger relationship between environmental management and the cost of debt financing”.
5. Methodology
5.1. ESG Performance Data
I extracted the ESG scores from Thomas Reuteurs Eikon ESG Database. Eikon is a software launched in 2010 giving access to several databases from Thomas Reuters,
including bonds, equity and ESG data. Thomas Reuteurs is a firm that provides intelligence, technology and human expertise to professionals in the financial market. Their ESG database covers over 6000 public companies all over the world. Thomas Reuters has data on
environmental, social and governance performances and issues scores each year for each category based on annual reports, company websites, NGO websites, stock exchange filings, CSR reports and news sources. The exact definitions of the ESG scores and their
decompositions are described in table 1 in the Appendix. Each score ranges from 0 to 100 and is relative to peers in the industry.
5.2. Credit Risk Data
I use two different risk measures to assert the importance of EP for investors in the bond market: the spread between the yield to maturity of bonds and the yield to maturity of the corresponding government bonds of the same maturity and the credit rating of the issuer issued by Standard and Poor’s and Moody’s.
The spread between the offering yield to maturity of bonds and the yield to maturity of the corresponding government bonds of the same maturity is the first independent variable and proxy for the cost of debt financing. As this cost of debt is a value from the market, the spread represents the premium that investors in the bond market charge to compensate for the default risk of the bond. I use the natural logarithm form due to the positive skewness in the
10
yield to maturity distribution. (Bauer and Hann, 2010; Chava, 2014; Goss and Roberts, 2009). The second independent variable of this paper is the long-term Bond Issuer credit rating, which takes the value 1 for firms rated AAA, 2 for AA+ and so on.
The necessary information was collected on Thomas Reuters Eikon and Bloomberg. Bloomberg is a private company who provides financial software, data, and media services. Their database covers 35 million instruments across all asset classes traded in more than 330 exchanges. Some screens have been performed in order to obtain to accurate data.
First, only firms whose countries of incorporation were Australia, Japan or in the Europe that traded respectively in the ASX200, Nikkei 225 and EuroStoxx600 were included. Firms operating in financial industries (Banking, life insurance, property and casualty
insurance, securities and financial other) were excluded. I focus on corporate bonds with fixed coupons payment and classified as senior or junior unsecured. Finally bonds whose maturity was longer than 50 years were excluded.
After matching the ESG data with the different control variables, there remains 1377 bonds from 138 firms between the 1st January 2010 and the 31st December 2016.
5.3. Control Variables
5.3.1. Financial control variable
This section reviews variables included in order to control for differences in firm characteristics that could also impact the cost of debt financing. This is in line with earlier studies which identify determinants of the cost of debt financing. (Bharath et al., 2008; Gray et al., 2009; Goss and Roberts, 2011; Schneider, 2011; Bauer and Hann, 2010, Ashbaugh-Skaife et al., 2006; Clarkson et al., 2014; Bradley, Chen, Dallas, and Snyderwine, 2008; Bhojraj and Sengupta, 2003; Sharfman and Fernando, 2010; Cremers, Nair, and Wei, 2007; Chen and Gao, 2012). Table 2 in the Appendix summarizes the different control variables and their expected correlation with the cost of debt financing. Firm_Size is defined as the
11
natural logarithm of the value of firms’ total asset. Larger firms are likely to have access to more and cheaper debt. Moreover, large firms have a larger equity buffer which decreases their vulnerability to negative shocks (Gebhardt, Lee, and Swaminathan, 2001). Some reputation effects also increase with firm size (Diamond, 1991). Therefore, I expect larger firm to have a lower cost of debt financing. Leverage is defined as the ratio of total liabilities on total assets. A higher level of liabilities or debt increases the probability of default. I expect firm with higher leverage to have a higher cost of debt financing. A dummy variable
Loss that equals one when the firm’s net income before extraordinary items is negative in the
current and prior year to the issue of the bond is included. As losses and profit tend to be persistent (Hayn, 1995), I expect the coefficient of the variable Loss to be positive. CapInt,
IntCov and ROA are respectively defined as the net income before extraordinary items
divided by total assets, EBITDA divided by interest expense and the ratio of fixed asset on total asset. Earlier studies have shown that those variables were positively related to the credit ratings of the firms, as they are signs of financial strength (Gray et al., 2009). I expect those variables to have a negative relationship with the cost of debt financing. VOL is defined as the natural logarithm of the standard deviation of the returns during the year prior the issue of the bond. Campbell and Taksler (2003) showed that firms with more volatile equity had a higher default probability. I expect VOL to show a positive relationship with the cost of debt financing. M_t_B corresponds to the ratio of the Market value of equity and the Book value of equity. Firms with higher market-to-book ratio show a higher risk as it represents higher expectation for the future (Pennman, 2006). Therefore, I expect higher market-to-book ratio to lead to higher cost of debt financing. I also included the firms’ 5-year Beta and Return_t1, defined as the returns on the stock of the firm in the month prior to the bond issue. As beta is the systematic risk of a firm, a higher beta will imply a higher risk. I predict the sign of the beta coefficient to be positive. Return_t1 is defined as the returns on the stock of the firm the
12
month prior to the bond issue. Chava and Purnanandam (2010) argued that the past stock return is a significant predictor of the expected return on the stock. As a stock expected return is positively correlated with its risk, I expect the past returns to have a positive relationship with the cost of debt financing. Lastly, Institutional Ownership has an influence on the cost of capital through a reduction of information asymmetries. (Lev and Nissim, 2003). As
institutional investors exert influence on the board and even attend some meetings, they can ensure that managers do not make decisions in their interests instead of the interest of the firm. By reducing the agency cost, institutional investors should therefore lower the external cost of funding. When it comes to the cost of debt however, this relationship might not hold due to wealth transfers between equity and debt (Wang and Zhang, 2009). Therefore, I have no expectations about the coefficient of the institutional ownership variable.
In addition to firm characteristics, I control for bonds characteristic to mitigate potential endogeneity problems. Issue_Size corresponds to the amount issued by the firm through the bond. Larger issues are more liquid and thus incur a lower yield spread (Ortiz-Molina, 2006). I therefore expect the effect of Issue_Size on cost of debt financing to be negative. Maturity_Years is defined as the number of years before the bonds reach their maturity. Chen et al. (2007) argues that bonds with shorter maturity show higher liquidity and hence incur a lower cost of debt financing. Furthermore, the interest-rate risk and business risk is higher with longer maturity bonds. However, Schneider (2011) also argues that bonds with different maturities can attract different investors and then behave differently. Therefore, I have no expectations about the influence of years to maturity on the cost of debt financing. Callable_Dummy and Puttable_Dummy are respectively variables that equal one when the bonds are callable or puttable. I expect the coefficient of Puttable_Dummy and
13
equals to one when the bond issuer has a non-investment rating. I expect that the coefficient of Speculative to be positive because of lower liquidity.
5.3.2. Social and Governance Performance
Corporate governance is “concerned with the resolution of collective action problems among dispersed investors and the reconciliation of conflicts of interest between various corporate claimholders” (Becht, Bolton and Röell, 2005). Corporate governance broadly defined and its relationship with the cost of debt financing has been the topic of earlier studies (Sengupta, 1998; Anderson et al.,2004; Cremers et al, 2007; Klock et al. 2005, Yu 2005; Bradley et al, 2008; Bhojraj and Sengupta, 2003).
Theoretically, there are two channels through which corporate governance can have an impact on the cost of debt financing: Agency risk and information risk.
Agency risk represents the possibility that management acts in its own interests and make decision that do not maximize shareholder value. This agency cost takes the form of wealth expropriation (Jensen and Meckling 1976), short-term bias (Dechow and Sloan, 1991) and unprofitable investment to increase the size of the firm (Murphy, 1985).
Information risk is the possibility that managers do not disclose information that would increase the probability of default of the bond. Investors are unable to properly assess properly the risk that they are exposed to in buying the bond. Good corporate governance mitigates this risk by requiring firms to disclose all required information when it comes due.
Good corporate governance enables management of information and agency risk, thereby reducing the risk premium of bonds.
Social performance comprises a wide range of factors including workforce satisfaction, workforce diversity and equal opportunities, human rights, public health, citizenship and product quality. Oikonomou et al (2014) suggest that equivalent logic applies for
14
higher risk of social scandal that can trigger damages to reputation. Moreover, new social regulations can increase costs for firms that did not act proactively in that area. Finally, social incidents may lead to substantial legal costs. These higher risks will subsequently translate into a higher risk premium and cost of debt financing.
5.4. Empirical method
In order to test the relationship between the cost of debt and the environmental management, I regress the EP measure of firms on their cost of debt financing. The regressions are as follows:
𝐿𝑛(𝑆𝑝𝑟𝑒𝑎𝑑) = 𝛼 + 𝛽 ∗ 𝐸𝑛𝑣. 𝑃𝑒𝑟𝑓𝑜𝑟𝑚𝑎𝑛𝑐𝑒 + 𝛿 ∗ 𝐶𝑜𝑛𝑡𝑟𝑜𝑙 𝑣𝑎𝑟𝑖𝑎𝑏𝑙𝑒𝑠 + 𝜀 The Ln(Spread) is defined earlier in the paper as the difference between the offering yield to maturity of bonds and the yield to maturity of the corresponding government bonds of the same maturity. I use three different EP measures: The ES, the three decompositions of the ES, and the decomposition of the ES in tercile and quartile.
The analysis using the ES allows to investigate incremental change in the EP. If the coefficient is significant, it means that the market values even small environmental
differences across firms. This approach has two weakness. First, the ES is broadly defined and does not allow perception of whether the market values one aspect of the environmental management more than the other. Second, the absence of a significant coefficient does not mean absence of relationship as a change of one in the ES might be too small to be
meaningful in the market.
To solve the first weakness, I use the decomposition of the ES (namely Emissions, Innovation and Resource use score) as independent variable. As those scores are more precisely defined, this approach gives more insight about what investors value most as EP. However, the 1-point change might still not be large enough for the market to notice. Therefore, I include the decomposition of the ES in tercile and quartiles as independent
15
variables. This approach shows the results of larger changes in EP and is therefore more likely to identify a potential relationship.
All the regressions include fixed year and industry effects (4-Digit GICS code) to rule out the influence of a particular year of industry on the cost of debt. Moreover, the robust standard errors are clustered at the firm level to take into account the potential correlation between bonds from the same firm (Abadie et al, 2017).
6. Empirical results
6.1. Descriptive Statistics
All the complete tables can be found in the Appendix. I have only included in the text the important part of the tables necessary for the understanding of this paper.
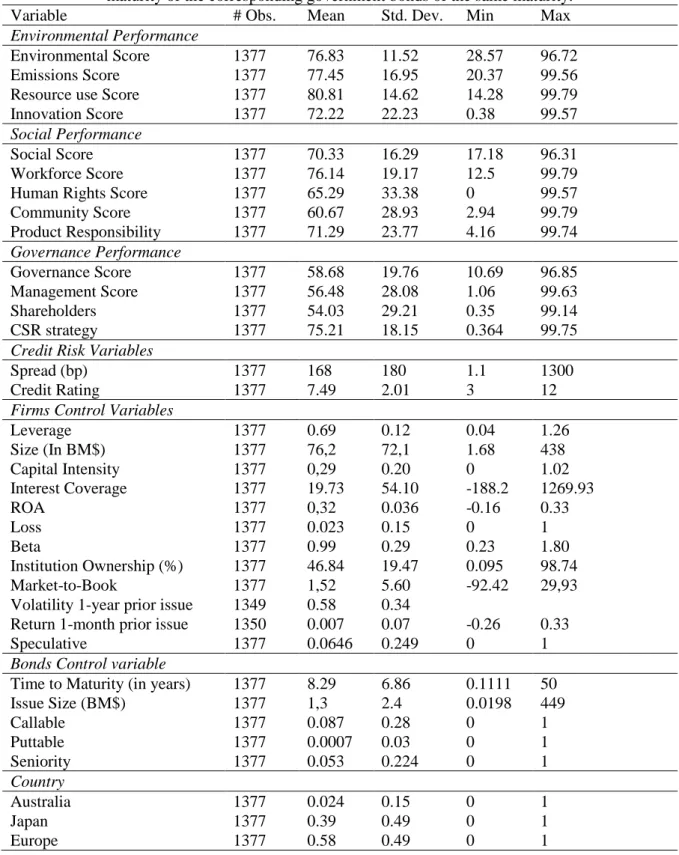
Summary statistics of the variables are presented in Table 2 (Table 1 is shown in the Appendix). Spread, Size, Issue Size and Volatility have been transformed to their non-logarithm form for interpretation purposes. The credit risk variables are economically significant and similar to previous literature. Table 2 documents an average spread of 168 basis points and an average credit rating of A-/A3. Spread also shows a relatively large variation with a Standard Deviation of 180 and a range of 1299.89 basis points. With regards to the credit ratings, the distribution is less volatile with a standard deviation of 2.
Furthermore, the credit rating of the sample extends from AA/A2 to D and around 7% of the bonds have a speculative rating. The Beta is very close to 1, indicating that our sample is well diversified and the variance inflation factor (VIF) do not indicate multicollinearity (See Table 3 in Appendix).
Finally, one could notice that the ES average is higher than the social and governance score average while keeping a lower volatility than the two other categories. The range of the ES is also lower than the range of the social and governance score.
16
Table 2: Descriptive Statistics
This table provides a summary statistic of the dependent and independent variables for a sample of 1377 bonds covering the 2007-2017 period. Spread, Size, Issue Size and Volatility have been transformed back to their non-logarithm form for interpretation purpose. Spread is the yield to maturity at issue, defined as the difference between the yield to maturity of bond and the yield to
maturity of the corresponding government bonds of the same maturity.
Variable # Obs. Mean Std. Dev. Min Max
Environmental Performance
Environmental Score 1377 76.83 11.52 28.57 96.72
Emissions Score 1377 77.45 16.95 20.37 99.56
Resource use Score 1377 80.81 14.62 14.28 99.79
Innovation Score 1377 72.22 22.23 0.38 99.57
Social Performance
Social Score 1377 70.33 16.29 17.18 96.31
Workforce Score 1377 76.14 19.17 12.5 99.79
Human Rights Score 1377 65.29 33.38 0 99.57
Community Score 1377 60.67 28.93 2.94 99.79 Product Responsibility 1377 71.29 23.77 4.16 99.74 Governance Performance Governance Score 1377 58.68 19.76 10.69 96.85 Management Score 1377 56.48 28.08 1.06 99.63 Shareholders 1377 54.03 29.21 0.35 99.14 CSR strategy 1377 75.21 18.15 0.364 99.75
Credit Risk Variables
Spread (bp) 1377 168 180 1.1 1300
Credit Rating 1377 7.49 2.01 3 12
Firms Control Variables
Leverage 1377 0.69 0.12 0.04 1.26 Size (In BM$) 1377 76,2 72,1 1.68 438 Capital Intensity 1377 0,29 0.20 0 1.02 Interest Coverage 1377 19.73 54.10 -188.2 1269.93 ROA 1377 0,32 0.036 -0.16 0.33 Loss 1377 0.023 0.15 0 1 Beta 1377 0.99 0.29 0.23 1.80 Institution Ownership (%) 1377 46.84 19.47 0.095 98.74 Market-to-Book 1377 1,52 5.60 -92.42 29,93
Volatility 1-year prior issue 1349 0.58 0.34
Return 1-month prior issue 1350 0.007 0.07 -0.26 0.33
Speculative 1377 0.0646 0.249 0 1
Bonds Control variable
Time to Maturity (in years) 1377 8.29 6.86 0.1111 50
Issue Size (BM$) 1377 1,3 2.4 0.0198 449 Callable 1377 0.087 0.28 0 1 Puttable 1377 0.0007 0.03 0 1 Seniority 1377 0.053 0.224 0 1 Country Australia 1377 0.024 0.15 0 1 Japan 1377 0.39 0.49 0 1 Europe 1377 0.58 0.49 0 1
17
6.2. The cost of debt and the environmental management
This section examines the general relationship between the cost of debt financing and the EP using the model outlined in the methodology section.
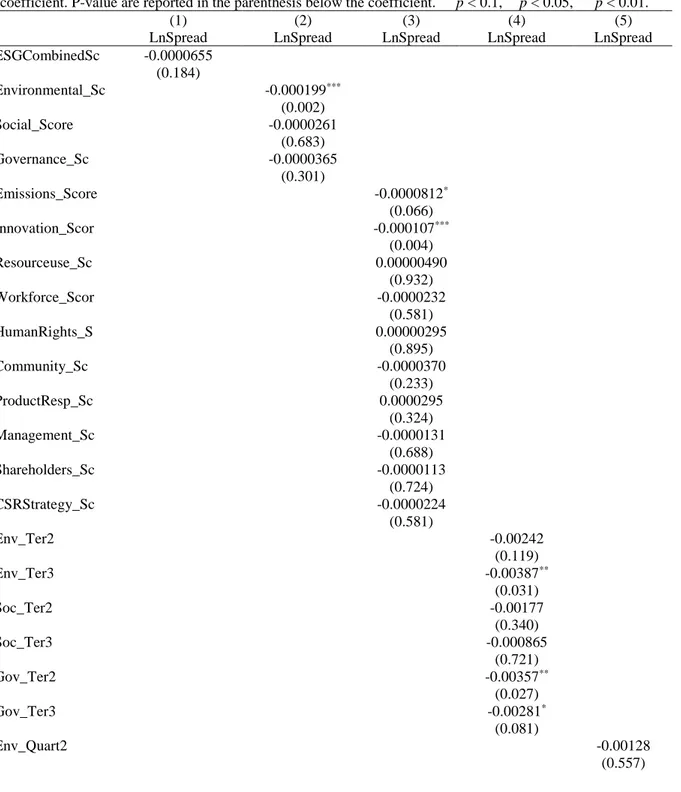
First, this paper looks at the ESG combined score to see if those scores have any power in predicting the cost of debt financing. The first regression of Table 3 indicates that this is not the case. This could be due to an absence of correlation between the variables or because the three ESG factors put together blur the relationship.
In order to test which possibility prevails, Column 2 presents the regression between the each ESG factors separately and the cost of debt financing. One could observe that only the coefficient of the ES is statistically significant, indicating a negative relationship between the two variables. On average, one-point increase in the ES decreases the cost of debt financing by 0.0199%. Using the mean Spread as reference, that corresponds to less than one basis point decrease on the spread paid. As the ES ranges from 28.57 to 96.72, the maximum effect corresponds to a 1,356% reduction or 2.27 basis point reduction. This effect is modest and comparable to the reduction in cost of debt financing found by Goss and Roberts (2009). Surprisingly, the social and governance performances are not significant even though their coefficients have the predicted sign.
Once again, I divided the ESG factors into their subsections in order to understand which parts carry the relationship. Regression (3) shows that the Innovation and Emissions performance drive the ES coefficient significantly. A possible explanation is that Greenhouse gas emissions have been a long-known environmental concern, the database about firms’ emissions are easily accessible and give a simple picture of the pollution emitted by the firm. The Innovation score importance can be related to the proactive environmental practice. Indeed, by innovating continuously, firms can gain competitive advantage and increase firm performance (Torusga et al, 2013). Furthermore, this decomposition shows further that
18
governance and social performance do not influence the cost of debt. Even though only the ES seems to be correlated with the cost of debt financing even for a 1-point score change, this might not be the case for larger differences in scores.
Table 3: Relationship between EP and the cost of debt
This table summarizes the relationship between firms’ environmental management and the cost of debt financing. I regress the logarithm of the spread between the yield maturity of a bond and the corresponding
government rate of the same maturity on the environmental management measure and an array of control variables. All models include year and industry fixed effects. The robust Standard Errors are cluster at the firm level. (1) uses the ESG combined scores. (2) uses the decomposition of the ESG combined scores. (3) uses the decomposition of the each ESG scores. (4) sorts the firms in terciles according to their ESG scores. (5) sorts the firms in quartiles according to ESG scores. P-value are reported in the parenthesis below the coefficient. P-value are reported in the parenthesis below the coefficient. * p < 0.1, ** p < 0.05, *** p < 0.01.
(1) (2) (3) (4) (5)
LnSpread LnSpread LnSpread LnSpread LnSpread ESGCombinedSc -0.0000655 (0.184) Environmental_Sc -0.000199*** (0.002) Social_Score -0.0000261 (0.683) Governance_Sc -0.0000365 (0.301) Emissions_Score -0.0000812* (0.066) Innovation_Scor -0.000107*** (0.004) Resourceuse_Sc 0.00000490 (0.932) Workforce_Scor -0.0000232 (0.581) HumanRights_S 0.00000295 (0.895) Community_Sc -0.0000370 (0.233) ProductResp_Sc 0.0000295 (0.324) Management_Sc -0.0000131 (0.688) Shareholders_Sc -0.0000113 (0.724) CSRStrategy_Sc -0.0000224 (0.581) Env_Ter2 -0.00242 (0.119) Env_Ter3 -0.00387** (0.031) Soc_Ter2 -0.00177 (0.340) Soc_Ter3 -0.000865 (0.721) Gov_Ter2 -0.00357** (0.027) Gov_Ter3 -0.00281* (0.081) Env_Quart2 -0.00128 (0.557)
19 Env_Quart3 -0.00548*** (0.004) Env_Quart4 -0.00674*** (0.001) Soc_Quart2 -0.00104 (0.558) Soc_Quart3 -0.00292 (0.242) Soc_Quart4 -0.0000220 (0.994) Gov_Quart2 -0.00380* (0.052) Gov_Quart3 -0.00227 (0.255) Gov_Quart4 -0.00247 (0.217) Maturity_Years 0.000844*** 0.000820*** 0.000814*** 0.000835*** 0.000826*** (0.000) (0.000) (0.000) (0.000) (0.000) Issue_Size 0.000156 0.000103 0.0000883 0.000151 0.0000245 (0.859) (0.907) (0.916) (0.863) (0.977) Callable_Dumm 0.00716* 0.00718* 0.00749* 0.00752* 0.00699* (0.076) (0.071) (0.055) (0.060) (0.081) (0.801) (0.766) (0.484) (0.798) (0.714) Putable_Dummy 0.0198 0.0201* 0.0199* 0.0197* 0.0220* (0.106) (0.086) (0.076) (0.089) (0.059) Speculative 0.0142*** 0.0121*** 0.0124*** 0.0128*** 0.0107*** (0.004) (0.009) (0.005) (0.003) (0.009) Firm_Size 0.00336*** 0.00411*** 0.00411*** 0.00391*** 0.00396*** (0.006) (0.003) (0.002) (0.003) (0.003) Credit_Rating 0.00221*** 0.00216*** 0.00224*** 0.00220*** 0.00233*** (0.001) (0.001) (0.001) (0.001) (0.001) Lev -0.00147 -0.00163 -0.00361 -0.00245 -0.00258 (0.854) (0.840) (0.663) (0.759) (0.754) CapInt 0.00356 0.00289 0.00184 0.00257 0.00379 (0.358) (0.498) (0.679) (0.518) (0.402) Loss 0.00782** 0.00783** 0.00737** 0.00725** 0.00739** (0.033) (0.030) (0.041) (0.047) (0.046) ROA 0.0316 0.0299 0.0268 0.0266 0.0245 (0.185) (0.192) (0.244) (0.245) (0.265) IntCov 0.00000335 0.00000472 0.0000037 0.00000682 0.00000649 (0.581) (0.434) (0.522) (0.288) (0.304) VOL 0.00259 0.00308 0.00326 0.00358 0.00281 (0.446) (0.331) (0.257) (0.239) (0.338) M_t_B -0.000173* -0.000170* -0.000163 -0.000209** -0.000197** (0.054) (0.070) (0.136) (0.027) (0.037) Return_t1 0.00154 0.000152 0.000513 0.000567 -0.000331 (0.814) (0.981) (0.931) (0.929) (0.960) Beta -0.00655* -0.00465 -0.00457 -0.00582 -0.00457 (0.098) (0.219) (0.244) (0.130) (0.210) Inst_Own_Per 0.0000415 0.0000549* 0.0000515* 0.0000529* 0.0000723** (0.187) (0.065) (0.090) (0.088) (0.018) Australia 0.0422*** 0.0442*** 0.0439*** 0.0450*** 0.0440*** (0.000) (0.000) (0.000) (0.000) (0.000) Europe 0.00364 0.00414 0.00422 0.00431 0.00310 (0.18) (0.419) (0.264) (0.150) (0.410) _cons -0.0773** -0.0787** -0.0775** -0.0849*** -0.0868*** (0.026) (0.015) (0.017) (0.009) (0.008) R2 0.375 0.387 0.394 0.388 0.401 N 1348 1348 1348 1348 1348
20
In order to verify the evolution of the relationship as the difference in scores increases, Regression (4) and (5) uses dummy variables that take the value 1 when the bond issuer belongs in the corresponding tercile or quartile respectively. Tercile and Quartile 1, the base in this regression, are the worst environmentally performing firms. The benefit from higher EP seems to be concentrated at the upper level of the distribution. Indeed, bonds whose issuers have an ES in the highest tercile pay on average 0.387% less for their debt financing than the one at the lowest tercile. While social scores do not show relationship with the cost of debt financing, firms with better governance performance pay less on their debt than those at the bottom of the governance score distribution. However, this effect disappears somewhat with quartiles decomposition.
Regarding the general validity of the model, the R-squared of about 40% is lower than in the literature but still satisfying for such a diversified sample (See Chava (2014) and Bauer and Hann (2010) for comparison) and most of control variables show the predicted sign. Time to Maturity appears to have a positive correlation with the risk premium, which could be a sign of lower liquidity and higher interest and business risk for longer maturities bonds. The natural logarithm of the asset value Firm size shows a positive relationship with the cost of debt financing, contrary to what was expected. A 1% increase in the size of the assets increases the spread by around 0,004%. A possible explanation for this counter-intuitive result is that bigger firms take on more leverage in this sample. Loss, Speculative, Credit_Rating and
Putable_Dummy all have a positive influence on the Spread as expected. The institutional
Ownership has a positive relationship with the cost of debt financing when decomposing the ESG performances in quartiles. However, this relationship is not economically significant as one additional percent in the Institutional Ownership increases by 0.007% the cost of debt financing (the whole range does not even reach 0.1% increase). The same logic goes for the Market-to-Book ratio. Australia shows a higher level of Spread, which could also be explained
21
by the relative small size of the Australian bonds sample or the more illiquid character of the bond market in Australia.
To conclude, Table 3 supports hypothesis 1. ES has incremental power to explain the cost of debt financing when controlling for firms characteristic and social and governance performance. Furthermore, most of the relationship is carried by the Emissions and the Innovation score. Table 3 also indicates that most of the benefit are concentrated in the upper half of the ES distribution. However, the magnitude of the spread reduction is probably not economically significant.
6.3. The cost of debt and the environmental management across different maturities The previous sections showed that there is a relationship between the cost of debt and the EP on the whole sample. However, this paper also argues that the relationship between the cost of debt financing and the EP is stronger for bonds with longer maturity due to the clean-up costs, reputational loss, regulatory pressures and the potential risk of climate change. In order to investigate this hypothesis, the dataset has been divided into 4 sub-datasets: (1) Bonds with a maturity of less than 3 years, (2) bonds with a maturity between 3 and 5 years, (3) bonds with a maturity between 5 and 10 years and (4) bonds with maturity longer than 10 years.
First, I investigate the general relation between the cost of debt financing and the ESG combined score across bonds maturity in Table 4. This table gives little support for
hypothesis 2. Although the relationship between ESG and cost of debt financing becomes more negative as maturities increase, the coefficients for bonds with time to maturity higher than 3 years are not significant and the coefficient for bonds with a maturity lower than 3 years is positive. As in the previous section, possible interaction between the components of the ESG combined score could blur the relationship.
22
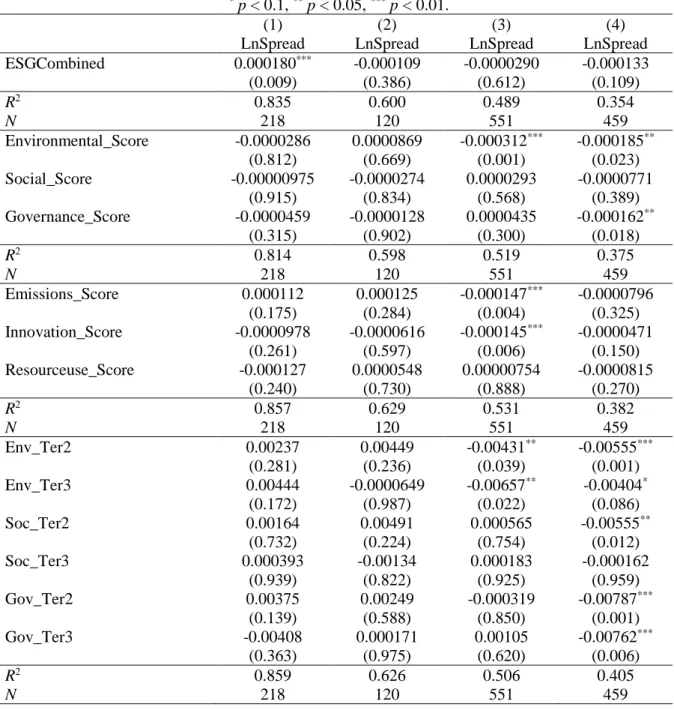
Table 4, 5, 6 and 7: Relationship between EP and the cost of debt across maturities This table summarizes the relationship between firms’ environmental management and the cost of debt financing across maturities. I regress the logarithm of the spread between the yield maturity of a bond and the corresponding government rate of the same maturity on the environmental
management measure and an array of control variables. All models include year and industry fixed effects. The robust Standard Errors are cluster at the firm level. This table uses the ESG combined scores. The dataset has been divided into 4 sub-datasets: (1) Bonds with a maturity of lES than 3 years, (2) bonds with a maturity between 3 and 5 years, (3) bonds with a maturity between 5 and 10 years and (4) bonds with maturity longer than 10 years. P-value are reported in the parenthesis below the coefficient. The control variables are not displayed.
* p < 0.1, ** p < 0.05, *** p < 0.01.
(1) (2) (3) (4)
LnSpread LnSpread LnSpread LnSpread
ESGCombined 0.000180*** -0.000109 -0.0000290 -0.000133 (0.009) (0.386) (0.612) (0.109) R2 0.835 0.600 0.489 0.354 N 218 120 551 459 Environmental_Score -0.0000286 0.0000869 -0.000312*** -0.000185** (0.812) (0.669) (0.001) (0.023) Social_Score -0.00000975 -0.0000274 0.0000293 -0.0000771 (0.915) (0.834) (0.568) (0.389) Governance_Score -0.0000459 -0.0000128 0.0000435 -0.000162** (0.315) (0.902) (0.300) (0.018) R2 0.814 0.598 0.519 0.375 N 218 120 551 459 Emissions_Score 0.000112 0.000125 -0.000147*** -0.0000796 (0.175) (0.284) (0.004) (0.325) Innovation_Score -0.0000978 -0.0000616 -0.000145*** -0.0000471 (0.261) (0.597) (0.006) (0.150) Resourceuse_Score -0.000127 0.0000548 0.00000754 -0.0000815 (0.240) (0.730) (0.888) (0.270) R2 0.857 0.629 0.531 0.382 N 218 120 551 459 Env_Ter2 0.00237 0.00449 -0.00431** -0.00555*** (0.281) (0.236) (0.039) (0.001) Env_Ter3 0.00444 -0.0000649 -0.00657** -0.00404* (0.172) (0.987) (0.022) (0.086) Soc_Ter2 0.00164 0.00491 0.000565 -0.00555** (0.732) (0.224) (0.754) (0.012) Soc_Ter3 0.000393 -0.00134 0.000183 -0.000162 (0.939) (0.822) (0.925) (0.959) Gov_Ter2 0.00375 0.00249 -0.000319 -0.00787*** (0.139) (0.588) (0.850) (0.001) Gov_Ter3 -0.00408 0.000171 0.00105 -0.00762*** (0.363) (0.975) (0.620) (0.006) R2 0.859 0.626 0.506 0.405 N 218 120 551 459
Table 4 confirms this hypothesis; the decomposition in separate ESG factors reveal the predicted pattern. As expected, there is no significant relationship between the environmental factor and the cost of debt financing for bonds with lower maturity (less than 5 years) while
23
the relationship becomes negative and significant for higher maturity bonds. The environmental risk seems to be priced only for longer than 5 years bonds maturity. The relationship is weaker for bonds with a maturity higher than 10 years, possibly indicating that the pricing of the environmental factor becomes more difficult for very long-term bonds. However, those results are still not impressive economically speaking. Another important feature of this table is the negative relationship between cost of debt financing and the governance performance for bonds longer than 10 years. A possible explanation is that investors think governance performance only brings benefit in the long-run.
Moreover, Table 6 confirms that this relationship is carried by the Emissions and Innovation performance as in the previous section even though the relationship fades for bonds with a maturity longer than 10 years. No other score is significant at a 5% level. Interestingly, by decomposing the data into tercile, Table 7 reveals that the hypothesis 2 actually works for the three ESG factors. For bonds with a maturity longer than 10 years, the upper and middle tercile of the ESG factors distribution pay less for their debt financing than the lower tercile. However, the EP is the only factor whose relationship with the cost of debt financing also holds for bonds with a maturity between 5 and 10 years. Once again, investors seem to think that the ESG factors are only important in the long-run.
Finally, the general validity of the models appears to be good with r-squared between around 35% and 80%. A feature shared by the 4 tables is the progressive decrease in r-squared as the bond maturities increases. This makes sense as the uncertainty about the risk and value of the bonds increase as maturity increases; the variables have a lesser power to explain its variation around the mean. Another interesting feature is the positive relationship between the cost of debt financing and the institutional ownership for bonds with maturity longer than 10 years. As explained earlier, by reducing the information asymmetries and agency costs, institutional ownership can reduce the cost of capital but wealth transfer
24
between equity and debt holder might lead to mixed results. Those results seem to indicate that bond markets believe that institutional investors have a long-term negative effect.
Even though the results look convincing, one could argue that the lack of significance stems from the lower number of observations for bonds belonging in the 0 to 3 years and 3 to 5 years maturity category. However, merging those two categories to have a comparable number of observations (as in the other categories) does not lead to different result, as could have been expected by the opposite sign of the coefficients in regression (1) and (2) in most tables.
To conclude, this section provides support for hypothesis 2. The negative relationship between the EP and the cost of debt financing is stronger for bonds with more than 5 years maturity. Moreover, the relationship is also present at the upper level of the ESG score distribution for the three ESG factors. This may indicate that investors consider ESG factors as a long-term risk reducer.
6.4. Relationship between environmental management across Industries
Earlier literature has shown that some industries might have a higher sensitivity to environmental factors (Cormier and Magnan,1997; Schneider, 2010; Bauer and Hann, 2010). However, firms in my sample have GICS classification while the industries risk classification has been performed using SIC. Therefore, I follow Bhojraj, Lee and Oler (2003) to translate SIC-2digits classification into GICS. Using Bauer and Hann (2010) classification, High_Risk is defined as a variable that takes the value one if the bonds issuer operates in one of the following industries: paper and allied products (SIC:2600; GICS: 151050), chemicals and allied products (SIC: 2800, 5160, 5161, 5169; GICS:151010, 351020), petroleum refining (SIC: 2910, 2911, 2900; GICS: 101020), primary metal (SIC: 3300; GICS : 151040), and mining (SIC: 1000, 1200; GICS: 151040).
25
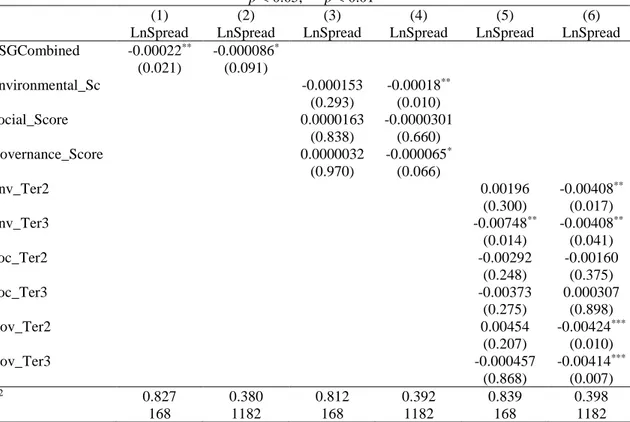
As in the previous sections, I first investigate if the ESG factors combined have an influence on the cost of debt financing by decomposing the dataset. It can be observed from the first two regressions in table 8 that both risky and non-risky firms show a negative relationship between the cost of debt financing and the ESG scores combined but the risky industries show a stronger relationship However, regressions (3) and (4) show that those results are not robust when decomposing the ESG factors. Indeed, the EP is not statistically significant. There could be no additional explanatory power due to industry specifics risk in Europe, Japan and Australia. One possible explanation is the difference of legislation between the U.S., Europe, Japan and Australia. Indeed, Schneider (2010) based his industry identification on the fact that the U.S. introduces the Toxic Release Inventory which allows clear identification of the largest polluting facilities. Another explanation is the heterogeneity among risky industries blurred the results (Cormier and Magnan,1997; Schneider, 2010). This absence of relationship could also come from a lack of data. Another data
decomposition could help prove the existence of a relationship or not. Therefore, I used terciles in regression (5) and (6) to further investigate the data sample. The regressions reveal that the higher part of the ES distribution pay less for its debt financing in both high-risk and non high-risk industry. However, this effect is stronger in the case of high-risk industry, giving some support to the hypothesis 3.
To conclude, table 8 does not confirm entirely hypothesis 3. There is no significant relationship between the cost of debt financing and the environmental management for one-point score change. However, the best environmentally performing firms pay less than the worst environmentally performing firms within risky industry. This effect exists as well for non-risky industry but is less strong. This pattern seems to indicate that there is more reward for having better environmental management in risky industries, but improvement is not
26
valued incrementally. Another point that could blur the relationship is the lack of data for risky industries.
Table 8: Relationship between EP and the cost of debt across industries
This table summarizes the relationship between firms’ environmental management and the cost of debt financing across industries. I regress the logarithm of the spread between the yield maturity of a bond and the corresponding government rate of the same maturity on the environmental management measure
and an array of control variables. All models include year and industry fixed effects. The robust Standard Errors are cluster at the firm level. (1), (3) and (5) use risky industries data while (2), (4) and (6) use the other industries data. P-value are reported in the parenthesis below the coefficient. * p < 0.1,
** p < 0.05, *** p < 0.01
(1) (2) (3) (4) (5) (6)
LnSpread LnSpread LnSpread LnSpread LnSpread LnSpread ESGCombined -0.00022** -0.000086* (0.021) (0.091) Environmental_Sc -0.000153 -0.00018** (0.293) (0.010) Social_Score 0.0000163 -0.0000301 (0.838) (0.660) Governance_Score 0.0000032 -0.000065* (0.970) (0.066) Env_Ter2 0.00196 -0.00408** (0.300) (0.017) Env_Ter3 -0.00748** -0.00408** (0.014) (0.041) Soc_Ter2 -0.00292 -0.00160 (0.248) (0.375) Soc_Ter3 -0.00373 0.000307 (0.275) (0.898) Gov_Ter2 0.00454 -0.00424*** (0.207) (0.010) Gov_Ter3 -0.000457 -0.00414*** (0.868) (0.007) R2 0.827 0.380 0.812 0.392 0.839 0.398 N 168 1182 168 1182 168 1182 7. Robustness checks
The complete version of this section can be found in the Appendix. I present herein the results of the robustness checks as well as their purpose. First, the relationship between the cost of debt and the EP only exists in Europe. No sign of this relationship has been found in Japan. Dividing the sample according to country of incorporation or country of issue leads to the same results.
Second, if the ES influences the firms’ risk, it should also influence firms’ credit rating. This paper does not find evidence of such influence. There are two possible
27
explanations for this phenomenon: the EP does not influence the cost of debt through risk or the Credit Rating agencies do not take the EP fully into account.
Third, I examined the significance of each ESG factors. Their correlation is relatively large, indicating that not including any one the ESG factor could lead to bias. Moreover, the environmental and governance score has an impact of the bond yields. The social score does not have such impact. However, due to its correlation with the other ESG factors, its
inclusion in the analysis is critical.
Fourth, Schneider (2010) stated that, as firms’ credit rating goes up, the importance of the EP in the bond pricing goes down. This paper finds the opposite. This effect is related to earlier findings of this paper. EP might not be fully considered by Credit Rating agencies.
Fifth, the results are robust to the inclusion of the ES from the year before and after the bond issue. This means that investors are using timely information in their bonds pricing. Moreover, this rule out the possibility of a reverse direction in the relationship. Indeed, if cheaper debt influenced the environmental management through easier access to capital, there would be a negative relationship between the cost of debt in the current period and the ES in the future period.
Sixth, to rule out endogeneity, I have performed a matched firm approach using the propensity score and Mahalanobis distance. I have also included firm fixed effect in the analysis. The results are robust to those different methodologies.
Seventh, I document decreasing returns to environmental scores with respect to the reduction of cost of debt. Only the first tercile of the environmental scores demonstrated a significant relationship.
Lastly, clustering the standard errors at the industry or the sector level does not alter the results. The results are also robust to the exclusion of year and industry fixed effect.
28 8. Discussion
The robustness checks have ruled out potential bias of this study. However, some alternatives theory could still explain or spur the results.
First, the ESG scores are issued once a year. Variations in the EP during the year is therefore not embedded in the scores. Moreover, how accurately the scores describe the ESG performance of the firm probably depends on the time difference between the ESG score update and the bond issue. The inaccuracies in reflecting the real ESG performance of the firms can spur the results. Second, this paper did not differentiate between intra-firm effect and sample effect. Indeed, there might be some difference between an improvement of the environmental factors at firm-level and at sample level. Third, investors may not be interested in the country of incorporation or country of bond issue but rather in the country from where the firm has most of its activities or revenues. If this is the case, the classification between Japan and Europe is biased and the results are not valid. Fourth, firms issuing bonds with different maturities may show differences. Those differences could influence the relationship between the cost of debt financing and the ES, spurring the results for hypothesis 2. Finally, there could also be an omitted variable bias even though the robustness checks tend to confirm that this is not the case.
9. Conclusion
This paper presents detailed evidence of a negative relationship between the cost of debt and EP. Basing the research on the hypothesis that EP reduces clean-up costs, reputation and regulatory risks, I regress the ES issued by Thomas Reuters on the cost of debt financing.
First, I found a robust negative relationship between ES and the bond spread. This relationship is robust to estimation method, firm-fixed effect and the inclusion of past and future ES. However, the size of the effect is modest with a maximum reduction of 2.27 basis point. Those results are similar to those found by Goss and Roberts (2009). Second, this
29
relationship is stronger for longer maturities. In particular, the correlation could be observed only for bonds with a maturity longer than 5 years. This is explained by a larger
environmental risk for longer maturity. Third, the relationship is not necessarily stronger in industries with environmental high-risk. However, the difference in Spread between the upper quartile and the lower quartile of the ES distribution is higher in those industries, suggesting that the market only values EP at its best. Fourth, the relationship between the cost of debt and EP only holds in Europe. This could come from difference in investors behaviour, legislation or difference in bond market. Finally, the relationship between the EP and the credit risk has not been confirmed. There is no particular relationship between the credit rating and the ES.
Those results have managerial implications. Investments to improve the EP of a firm can lead to a decrease in cost of debt – albeit they are modest. This is especially true if the firm issues long-term maturity bonds in Europe. Moreover, it only has a positive impact on credit rating for firms with a rating of BB+ or lower. Lastly, only the best quartile sees significant results in risky industries. By acknowledging those findings, managers can build a strategy to reduce firms’ cost of debt and ease their access to capital.
There are still a lot of unknowns about the relationship between the cost of debt and the environmental factors. Further studies should explore this relationship in other
geographical areas. Emerging countries are particularly interesting in this regard as they show a higher level of risk. Other ESG scores could also be used. This would test if the results are robust to a different database. Finally, little is known about the impact of the EP on the cost of debt for smaller companies. Deeper understanding of the strength of the relationship in those contexts would help generate a generalization of the theory.
30 10. References
Abadie, A., Athey,S., Imbens, G., Wooldridge, J. (2017). When Should You Adjust Standard Errors for Clustering? Retrieved from https://economics.mit.edu/files/13927 Albuquerque, Rui A., Art Durnev, Yrjo Koskinen. (2014). Corporate social responsibility and firm risk: Theory and empirical evidence. Working paper.
Alcock, J., Finn, F., Tan, K. J. K. (2012). The Determinants of Debt Maturity in Australian Firms. Accounting & Finance, 52(2), 313–341.
Ashbaugh-Skaife K., W. Collins D. and LaFond R. (2006). The effects of corporate governance on firms' credit ratings, Journal of Accounting and Economics, 42(1-2), 203-243.
Amel-Zadeh, A., Serafeim, G. (2017). Why and How Investors Use ESG Information: Evidence from a Global Survey. Working Paper.
Anderson, R., Mansi, S., Reeb, D. (2004). Board characteristics, accounting report integrity, and the cost of debt. Journal of Accounting and Economics,37(3), 315-342. Barclay, M., Holderness, C., Pontiff, J. (1993). Private benefits from block ownership and discounts on closed-end funds. Journal of Financial Economics, 33, 263-291.
Barth, M. E., McNichols, M. F., Wilson, P. (1997). Factors influencing firms' disclosures about environmental liabilities. Review of Accounting Studies, 2, 35-64.
Barth, M., McNichols, M. (1994). Estimation and market valuation of environmental liabilities relating to superfund sites. Journal of Accounting Research, 32, 177-209. Batten, A., Szilagyi, G. (2003). Impediments to Corporate Bond Market Development in Japan. Retrieved from
http://citeseerx.ist.psu.edu/viewdoc/download?doi=10.1.1.596.1921&rep=rep1&type=pdf Bauer, R., Hann, D. (2010). Corporate Environmental Management and Credit Risk. Retrieved from
https://www.responsible investor.com/images/uploads/Bauer__Hann_(2010).pdf Becht, M., Bolton, P., Röell, A. (2005). Corporate Governance and Control. Working Paper.
Bhojraj, S., Lee, C., Oler, Derek. (2003). What’s My Line? A Comparison of Industry Classification Schemes for Capital Market Research. Journal of Accounting Research,
41(5), 745–774.
Bhojraj, S., and Sengupta, P. (2003). Effect of Corporate Governance on Bond Ratings and Yields: The Role of Institutional Investors and Outside Directors. Journal of Business,
31
Boyer, M., Laffont, J. J. (1995). Environmental protection, producer insolvency, and lender liability. Economic policy for the environment and natural resources.
Bradley, M., Chen, D., Dallas, G., and Snyderwine, E. (2008). The Effects of Corporate Governance Attributes on Credit Ratings and Bond Yields. Working Paper.
Caliendo, M., Kopeinig, S. (2005). Some Practical Guidance for the Implementation of Propensity Score Matching. IZA Discussion Paper 1588.
Campbell, J., Taksler, G. (2003). Equity Volatility and Corporate Bond Yields. The
Journal of Finance, 58(6), 2321-2350.
Capelle-Blancard G. and Laguna, M. A. (2010). How does the stock market respond to chemical disasters? Journal of environmental economics and management, 59(2), 192-205 CFA Institute. (2017). Global Perceptions of Environmental, Social and Governance (ESG) Investing. Retrieved from
https://www.cfainstitute.org/learning/future/Documents/ESG_Survey_Report_July_2017. pdf
Chava, S. 2014. Environmental externalities and cost of capital. Management Science,
60(9), 2223 – 2247.
Chava, S., Purnanandam, A. (2010). Is Default Risk Negatively Related to Stock Returns?
The Review of Financial Studies, 23(6), 2523–2559.
Chen, L.H., Gao, L.S. (2012). The pricing of climate risk. Journal of Financial
Economics, 12(2), 130–146.
Chen, L., Lesmond, D., Wei, J. (2007). Corporate Yield Spreads and Bond Liquidity. The
Journal of Finance, 62(1), 119–149.
Cormier, D., and Magnan, M. (1997). Investors’ Assessment of Implicit Environmental Liabilities: An Empirical Investigation. Journal of Accounting and Public Policy, 16, 215-241.
Cotter, J. (1998). Utilisation and restrictiveness of covenants in Australian private debt contracts. Accounting and Finance, 38(2), 181-196.
Cremers, K. J. M., Nair, V. B., Wei, C. (2007). Governance Mechanisms and Bond Prices.
Review of Financial Studies, 20(5), 1359-1388.
Dechow, P., Sloan, R. (1991). Executive incentives and the horizon problem: An empirical investigation. Journal of Accounting and Economics, 14(1), 51-89.
Diamond, D. (1991). Monitoring and Reputation: The Choice between Bank Loans and Directly Placed Debt. The Journal of Political Economy, 99(4), 689-721.
European Central Bank (2004). The Euro Bond market study. European Central Bank
32
Feng, Z., Wang, M., Huang, H. (2015). Equity Financing and Social Responsibility: Further International Evidence. The International Journal of Accounting, 50(3), 247-280. Garber, S., Hammitt, J. K. (1998). Risk premiums for environmental liability: Does Superfund Increase the Cost of Capital? Journal of Environmental Economics and
Management, 36, 267-294.
Gaspar, V., Hartmann, P., Sleijpen, O. (2002). The transformation of the European financial system. European Central Bank Paper.
Gebhardt, W., Lee, C., Swaminathan, B. (2001). Toward an implied Cost of Capital.
Journal of Accounting Research, 39(1), 135-176.
Goss, A., Roberts, S.G. (2011). The impact of corporate social responsibility on the cost of bank loans. Journal of Banking and Finance, 35(7), 1794–1810.
Graham, A., Maher, J. J. (2006). Environmental liabilities, bond ratings, and bond yields.
Advances in Environmental Accounting & Management, 3, 111-142.
Graham, A., Maher, J. J., Northcut, W. D. (2001). Environmental liability information and bond ratings. Journal of Accounting, Auditing and Finance, 15, 96-116.
Gray, P., Koh, P. S., Tong, Y. H. (2009). Accruals quality, information risk and cost of capital: Evidence from Australia. Journal of Business Finance and Accounting, 36, 51-72. Hayn, C. (1995). The information content of losses. Journal of Accounting and Economics
20, 125-153.
Heyes, A. G. (1996). Lender penalty for environmental damage and the equilibrium cost of capital. Economica, 63, 311-323.
Husted, B. W. (2005). Risk management, real options, and corporate social responsibility.
Journal of Business Ethics, 60, 175-183.
Jensen, M., Meckling, W. (1976). Theory of the firm: Managerial behavior, agency costs and ownership structure. Journal of Financial Economics, 3(4), 305-360.
Karpoff, J. M., Lott, J. R., Wehrly, E. W. (2005). The reputational penalties for environmental violations: Empirical Evidence. Journal of Law and Economics, 48(2), 653-675.
King, G., Nielsen, R. (2016). Why Propensity Scores Should Not Be Used for Matching. Working Paper. Retrieved from: https://gking.harvard.edu/files/gking/files/psnot.pdf Klock, M., Mansi, S., Maxwell, W. (2009). Does Corporate Governance Matter to Bondholders? Journal of Financial and Quantitative Analysis, 40(4), 693-719.
33
Kroszner, R. S., Strahan, P. E. (2001). Bankers on boards: monitoring, conflicts of interest, and lender liability. Journal of Financial Economics, 62, 415-452.
Lev, B., Nissim, D. (2003). Institutional Ownership, Cost of Capital, and Corporate Investment. Retrieved from
http://www.columbia.edu/~dn75/Institutional%20Ownership,%20Cost%20of%20Capital, %20and%20Corporate%20Investment.pdf
Murphy, K. (1985). Corporate performance and managerial remuneration: An empirical analysis. Journal of Accounting and Economics, 7(1-3), 11-42.
Oikonomou, I., Brooks, C., Pavelin. (2014). The Effects of Corporate Social Performance on the Cost of Corporate Debt and Credit Ratings. The Financial Review, 49, 49-75. Orlitzky, M., Benjamin, J.D. (2001). Corporate social performance and firm risk: a meta-analytic review. Business and Society, 40(4), 369–395.
Ortiz-Molina, H. (2006). Top Management Incentives and the Pricing of Corporate Public Debt. The Journal of Financial and Quantitative Analysis, 41(2), 317-340.
Pennman, S. (2006). Handling Valuation Models. Journal of Applied Corporate Finance,
18(2), 48-55.
Pitchford, R. (2001). How liable should a lender be? The case of judgment-proof firms and environmental risk: Reply. The American Economic Review, 91, 739-745.
Schneider, T. (2010). Is EP a determinant of bond pricing? Evidence from the U.S. pulp and paper and chemical industries. Working Paper: University of Alberta.
Sengupta, P. (1998). Corporate Disclosure Quality and the Cost of Debt. The Accounting
Review, 73(4), 459-474.
Sharfman, M. P., Fernando, C. S. (2008). Environmental risk management and the cost of capital. Strategic Management Journal, 29, 569-592.
Standard & Poor’s. (2017). Understanding Ratings. Retrieved from https://www.spratings.com/en_US/understanding-ratings
Subramaniam, N., Wahyuni, D., Cooper, B. J., Leung, P. and Wines, G. (2013). Integration of carbon risks and opportunities in enterprise risk management systems: Evidence from Australian firms. forthcoming, Journal of Cleaner Production.
Testa, F., Iraldo, F., Frey, M. (2011). The effect of environmental regulation on firms’ competitive performance: The case of the building and construction section in some EU regions. Journal of Environmental Management. 92(9), 2136-2144.
Toffel, M., Marshall,J. (2004). Improving EP Assessment: A Comparative Analysis of Weighting Methods Used to Evaluate Chemical Release Inventories. Journal of Industrial
34
Torugsa, N., O’Donohue, W., Hecker, R. (2013). Proactive CSR: An Empirical Analysis of the Role of its Economic, Social and Environmental Dimensions on the Association between Capabilities and Performance. Journal of Business Ethics, 115(2), 383-402. Wang, W. A., Zhang, G. (2009). Institutional ownership and credit spreads: An information asymmetry perspective. Journal of Empirical Finance, 16(4), 597-612. Xu, X., Zeng, S., Tam, C. (2012). Stock Market's Reaction to Disclosure of
Environmental Violations: Evidence from China, Journal of Business Ethics, 107(2) ,227-237.