Printed version ISSN 0001-3765 / Online version ISSN 1678-2690 http://dx.doi.org/10.1590/0001-3765201720170047
www.scielo.br/aabc | www.fb.com/aabcjournal
Predicting of biomass in Brazilian tropical dry forest: a
statistical evaluation of generic equations
ROBSON B. DE LIMA1
, FRANCISCO T. ALVES JÚNIOR1
, CINTHIA P. DE OLIVEIRA2, JOSÉ A.A. DA SILVA2 and RINALDO L.C. FERREIRA2
1
Laboratório de Manejo Florestal, Universidade do Estado do Amapá, Rua Presidente Vargas, 450, Centro, 68901-262 Macapá, AP, Brazil
2Laboratório de Manejo de Florestas Naturais “José Serafim Feitosa Ferraz”, Universidade Federal Rural
de Pernambuco, Rua Dom Manuel de Medeiros, s/n, Dois Irmãos, 52171-900 Recife, PE, Brazil
Manuscript received on January 26, 2017; accepted for publication on March 28, 2017
ABSTRACT
Dry tropical forests are a key component in the global carbon cycle and their biomass estimates depend almost exclusively of fitted equations for multi-species or individual species data. Therefore, a systematic evaluation of statistical models through validation of estimates of aboveground biomass stocks is justifiable. In this study was analyzed the capacity of generic and specific equations obtained from different locations in Mexico and Brazil, to estimate aboveground biomass at multi-species levels and for four different species. Generic equations developed in Mexico and Brazil performed better in estimating tree biomass for multi-species data. For Poincianella bracteosa and Mimosa ophthalmocentra, only the Sampaio and Silva (2005) generic equation was the most recommended. These equations indicate lower tendency and lower bias, and biomass estimates for these equations are similar. For the species Mimosa tenuiflora, Aspidosperma pyrifolium and for the genus Croton the specific regional equations are more recommended,
although the generic equation of Sampaio and Silva (2005) is not discarded for biomass estimates. Models considering gender, families, successional groups, climatic variables and wood specific gravity should be adjusted, tested and the resulting equations should be validated at both local and regional levels as well as on the scales of tropics with dry forest dominance.
Key words: above-ground biomass, allometric models, caatinga, forest management, statistical validation.
Correspondence to: Robson Borges de Lima E-mail: [email protected]
INTRODUCTION
Among the categories of tropical and subtropical
forests in the world, dry forests comprise just
under half (Murphy and Lugo 1986, Sabogal 1992,
Powers et al. 2009). Despite their importance, they
are among the most threatened and least studied
forest ecosystems and, as a result, may be at greater risk than humid forests (McLaren et al. 2005, Miles et al. 2006, Portillo-Quintero and Sánchez-Azofeifa 2010, Aide et al. 2012, Gillespie et al. 2012).
Nations (FAO) and IPCC (Intergovernmental Panel on Climate Change) generalize information about the carbon stock and aboveground biomass to wet forests, there is still a lot of uncertainty about the quantity and spatial variations in aboveground biomass and the existing carbon for dry forests in the tropics (Návar-Cháidez 2014).
Several research efforts are underway to fill this gap, but all of them ultimately rely almost exclusively on destructive biomass measurements of individual trees to fit local and/or global models (Gibbs et al. 2007, Návar-Cháidez 2014). Or, they rely on a combination of images remotely detected at different scales to calibrate or validate equations (Fayolle et al. 2013).
An allometric equation is the result of adjusting a tree biomass statistical model to a set of indicators, such as tree diameter and/or height, specific wood weight, or forest type (Chave et al. 2005). Information on the types of models, allometric relationships and applications to different sites are extensively documented in Rojas-García et al. (2015).
One of the problems to be solved that still generates a lot of discussion is about the validation of these equations. In multi-species biomass data, different dendrometric amplitudes can lead to biased predictions at local or global levels (Chave et al. 2005). In order to avoid this bias and to fill the lack of specific models in the dry forests located in Brazil, three large studies (Sampaio and Silva 2005, Sampaio et al. 2010, Alves Junior et al. 2013), generated generic equations for both community (multi-species) and for individual specimens, and exceeded those caveats in accounting for large datasets in those sites with the same morphoclimatic domain (Db> 3 cm). However, the statistical validation of global generic equations for dry forests (Návar-Cháidez 2009a, 2009b, 2014) should be verified and compared with local equations, as well as to measure errors in biomass stock estimates.
Statistical validation is a central aspect for the responsible application of equations for scientific problems, and its importance is recognized by
those who develop and/or use for inferences and
predictive generalizations. However, there is low
consensus about which is the best way to proceed, because there are still confusing affirmations and often mutually exclusive in the literature (Rykiel
1996, Robinson and Froese 2004).
A wide variety of methods have been proposed and used in many different fields of study. In many cases, the choice of technique is limited by the potential uses and tests of the model, the types of data that the equation generates, or the availability of actual data. Validation techniques can be grouped into four main categories, namely: subjective assessment, visual techniques (graphics), diversion measures and statistical tests (Mayer and Butler
1993).
Despite the interest for biomass accounting
in the region, few studies compare or validate biomass equations in Brazilian dry forests (Pereira Junior et al. 2016). Our research is divided into
two parts. First, it was performed a statistical
validation and comparison of global and/or local equations available for an initial destructive sample of 507 trees. Second, it was investigated how these equations generalize estimates of aboveground biomass stock in different species.
The objective of this work was to provide predictions of aboveground biomass for a dry forest
located in Pernambuco, Brazil, applying generic equations. Categorically, this work addresses: (1) whether site-specific equations for species and multi-species predict biomass better than generic equations; (2) if the generic equations of dry forests not located in Brazil generate reliable estimates for
MATERIALS AND METHODS
STUDY AREA
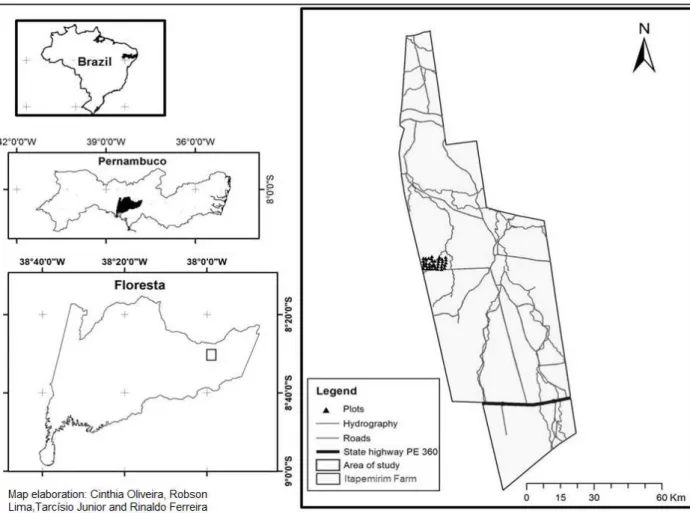
The study area is located in the Floresta city, a meso-region of São Francisco in Pernambuco, 433 km far from the capital Recife. The study was carried out with data from an area submitted to forest management for the production of wood destined to the steel industry, denominated Itapemirim farm, and belongs to Agroindustrial Excelsior S.A. The extremes included in the study were 8°30’37”S and 37°59’07”W (Figure 1).
The average annual rainfall is approximately 400 to 500 mm, with rainy season from January to April, and average annual temperature of 26.1°C.
The city has an area of 3,643.97 km² and an average altitude of 323 m. The soil of the region is classified as few deep chromic luvisoil, sandy surface texture to medium and superficial. On the valleys strands prevails gravel soils, but more fertile (EMBRAPA 2007). The vegetation is predominantly Caatinga - savannah, characterized by shrubby-arboreal vegetation, with cactus and herbaceous stratum (IBGE 2012).
SAMPLING
In this research, it was used data from 507 trees of sixteen different species. All species are native to the studied forest and are of economic importance, since they are harvested for production of charcoal, fence posts, furniture, etc. Species commonly
found according to the forest inventory are (Abreu et al. 2016): Poincianella bracteosa, Mimosa ophthalmocentra, Aspidosperma pyrifolium,
Mimosa tenuiflora, Anadenanthera colubrina,
Bauhinia cheilanta, Jatropha mollissima,
Piptadenia stipulacea, Croton rhamnifolius,
Croton blanchetianus, Cnidoscolus phyllacanthus,
Manihot glaziovii, Poincianella calycina, Sapium lanceolatum, Thiloa glaucocarpaand Commiphora leptophloeos. These species are also widely
distributed in the dry forests of the Brazilian northeast (Gariglio et al. 2010).
The biomass data were obtained from destructive sampling, which were collected the diameter measures at 0.30 m and 1.30m, above the ground level (base diameter and diameter at breast height), total height, number of branches, diameter of the base of the larger branch and weight of the green mass. The green mass of trees was obtained with a balance adding the weights of the shaft and the branches to form the total green weight per tree for all species (Abreu et al. 2016).
According to equations found in the literature, four database on species level (P. bracteosa, M. ophthalmocentra, M. tenuiflora and A. pyrifolium) and a database on gender level (Croton) were selected to compose the inputs along with all the weighed trees in the sample (multi-species) to validate the equations.
VALIDATION OF BIOMASS EQUATIONS
Despite the importance of dry forests in terms of carbon sequestration and distributed area in the tropics, only a few adequate equations were found in the literature (Table I). Two studies (Návar-Cháidez 2009a, 2014) proposed equations for dry forests in Mexico. Two others (Sampaio and Silva 2005, Sampaio et al. 2010) developed equations for dry forests located in Brazil, considering both multi-species and individual species data. Local equations developed by Abreu et al. (2016),
were also used in the validation of biomass only considering data of all species.
In this work, it was not validated equations that used as a predictor variable the basic wood density, as well as the generic pan-tropical equations developed by Brown (1997), updated by Chave et al. (2005). These equations do not encompass dendrometric amplitude for dry forests, although they are recommended by the IPCC guidelines (IPCC 2003, 2006) for estimating carbon stocks in tropical forests.
The validation analysis consisted in predicting the biomass above the soil for all trees and for the other cases analyzed based on the coefficients of the equations. For this task were computed the following statistics recommended by Mayer and Butler (1993) and Palahí et al. (2002):
Coefficient of determination:
2
SQR
R
SQT
=
(1)Where: R² is the coefficient of determination; SQR
is the covariance between observed and estimated biomass; SQT is the biomass covariance observed.
R² values indicate the total variation of the data explained by the validated equations.
Residual Standard Error (RSE):
(
)
21
n
i i
i
Breal Best RSE
n p
=
− =
−
∑
(2)
Where: RSE is the residual standard error or the standard error of the estimate; Breali is the actual individual biomass in kg; Besti is the individual biomass estimated in kg; n is the number of sampled trees; and, p is the number of parameters in the model. They represent the effective estimate of the biomass of a tree. High SRE values indicate inaccurate and biased equations in estimating biomass.
^ 1 ^ 1 / % .100 / n i i i n i i
Y Y n Bias Y n = = − =
∑
∑
(3)Where: Yi is the observed biomass value (Kg) of trees per unit area, Ŷi is the estimated biomass value (Kg) of trees per unit area, n is the number of observations. This statistic indicates a tendency of
under or overestimation, being a measure of error and quality measure of the validated equations, so the lower the error the greater the efficiency in the generalizations.
Akaike Information Criteria (AIC):
.ln SSE 2.
AIC n p
n
= +
(4) TABLE I
Allometric models generic and by species used for dry tropical forests.
Fitted equations Authors Local Models b
0 b1 b2 b3 R
2
All species
Návar-Cháidez (2009a) – (Mexico)
25°00′10″N;
107°30′10″O Ŷi= β0Db
β1ε
i 0.0841 2.4100 – – 0.79
Sampaio and Silva (2005) – (Brazil)
† 39°22’W;
11°15’S Ŷi= β0(DbH)
β1ε
i 0.0292 1.6731 – – 0.94
Návar-Cháidez (2014) – (Mexico)
*28° 48’ 51” N;
106° 26′ 22” W ... Ŷi= β0Db
β1ε
i 0.1028 2.2458 – – 0.65
Abreu et al. (2016) – (Brazil)
8°30´37” S;
37°59´07” W Ŷi= β0Db
β1Hβ2ε
i 0.6870 0.5854 0.6511 0.78
P. bracteosa
Sampaio and Silva
(2005) ... Ŷi= β0Db
β1ε
i 0.2804 1.9274 – – 0.90
Sampaio and Silva
(2005) – generic ... Ŷi= β0(DbH)
β1ε
i 0.0292 1.6731 – – 0.94
M. ophthalmocentra
Sampaio et al.
(2010) ... Ŷi= β0DAP
β1ε
i 0.4369 1.8493 – – 0.81
Sampaio and Silva
(2005) – generic ... Ŷi= β0(DbH)
β1ε
i 0.0292 1.6731 – – 0.94
M. tenuiflora
Sampaio et al.
(2010) – Serra Talhada city 38°17’20,0”W07°55’46,4”S; Ŷi= β0DAP
β1ε
i 0.3344 1.9648 – – 0.70
Sampaio et al. (2010) – Sertânia city
08°04’02,7”S;
37°12’33,1”W Ŷi= β0DAP
β1ε
i 0.4138 1.7718 – – 0.64
Sampaio and Silva
(2005) – generic ... Ŷi= β0(DbH)
β1ε 0.0292 1.6731 – – 0.94
A. pyrifolium
Sampaio and Silva
(2005) ... Ŷi= β0Db
β1ε
i 0.2455 1.7726 – – 0.93
Sampaio and Silva
(2005) – generic ... Ŷi= β0(DbH)
β1ε 0.0292 1.6731 – – 0.94
C. rhamnifolius/C.
blanchetianus
Sampaio et al.
(2010) ... Ŷi= β0DAP
β1ε
i 0.4171 1.5601 – – 0.62
Sampaio and Silva
(2005) ... Ŷi= β0Db
β1ε
i 0.1482 1.8741 – – 0.83
Sampaio and Silva
(2005) – generic Ŷi= β0(DbH)
β1ε
i 0.0292 1.6731 – – 0.94
†: inventory data from two different sites, one in Pernambuco and the other in Bahia; i = biomass (kg) aboveground; Db = base
diameter in centimeters (0.30 m above ground level); DAP = Diameter at breast height in centimeters (1.30 m above ground level); H = Height; βi = parameters of the models; bi = coefficients obtained after the model adjustments; and R
2 = coefficient of
Where: SSE is the sum of squares of the errors; P and n were already defined. This criterion penalizes the addition of parameters in the analyzed functions. The best validated model minimizes the AIC value.
The paired t-test was also used at the 99% confidence level (α = 0.01) to test the hypothesis that the observed biomass (actual weight) and the obtained biomass by the validated equations are statistically similar.
All computations and analyzes were carried out using R statistical software (R Core Team 2015).
RESULTS
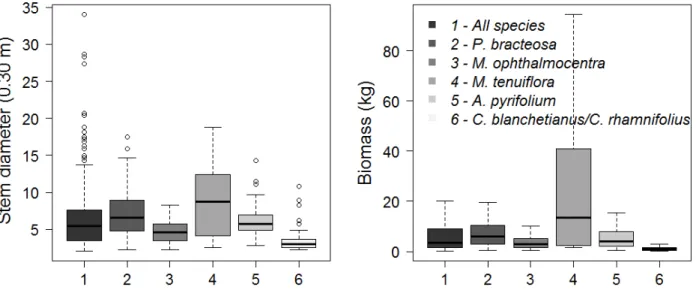
Figure 2 shows descriptive information about the base diameter and the biomass for the analyzed cases. Discrepant data were observed for the diameters, especially when considering all analyzed species. In relation to the biomass, there is for M. tenuiflora the greater variation found among the species and for the Croton genus the smaller dispersion. The average of aboveground biomass considering all species was 12.77 kg, with an average standard error of 1.95 kg. The lowest
biomass found was 0.15 kg and the highest was 559.5 kg. From a total of 507 weighted trees, 75% of the observations concentrated values around 9.0 kg, indicating the presence of discrepant data also for biomass (outliers not shown in the figure).
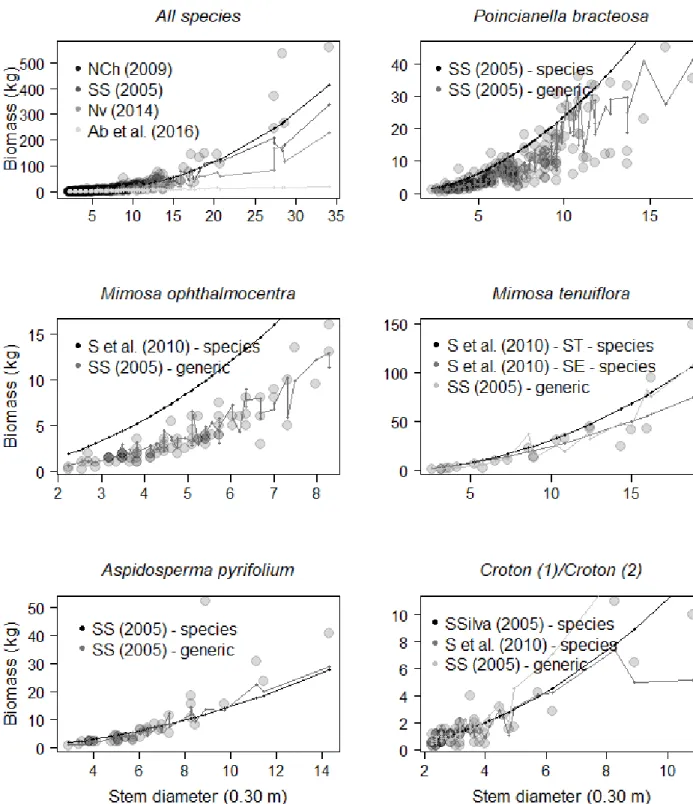
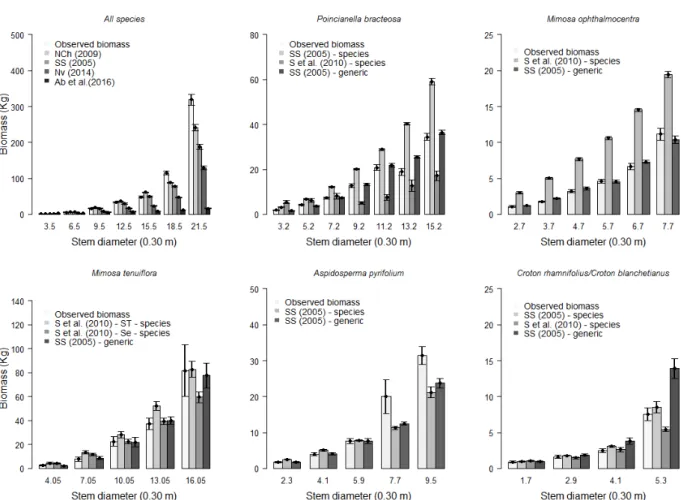
As for the estimates of aboveground biomass (Figure 3), it was observed that the validation was consistent when using the equations of Návar-Cháidez (2009a) and the local equation of Sampaio and Silva (2005) for all species. The equation of Abreu et al. (2016), although local, was not indicated to validate the biomass estimates. For the species P. bracteosa and M. ophthalmocentra, the specific equations of Sampaio and Silva (2005) and Sampaio et al. (2010), were biased and overestimated the biomass of these species. However, the general equation of Sampaio and Silva (2005) indicates reliable estimates as well as for the A. pyrifolium species, in other words, the parameters estimates of this equation are included in the 95% confidence interval of the local biomass estimates.
For the Croton genus, species-level equations were more reliable in estimating biomass. The general equation of Sampaio and Silva (2005)
Figure 2 - Box-plot for the base diameter and the biomass above ground. The boxes represent the 25th and 75th percentiles; the
estimates with precision the biomass for trees with diameters up to 5 cm and it has a tendency to overestimate trees with a diameter above 6 cm.
In five analyzed cases, both the diameters (at 0.30 m and 1.30 m above the soil) and the height of the trees (combined variable general equation of Sampaio and Silva (2005) were important
predictors of aboveground biomass. Species-specific equations derive from a simple nonlinear model (which does not include tree height and/ or wood base density as a predictor) and end up providing biased adjustments, as can be observed in the overestimation of biomass to P. Bracteosa
and M. ophthalmocentra (Figure 3).
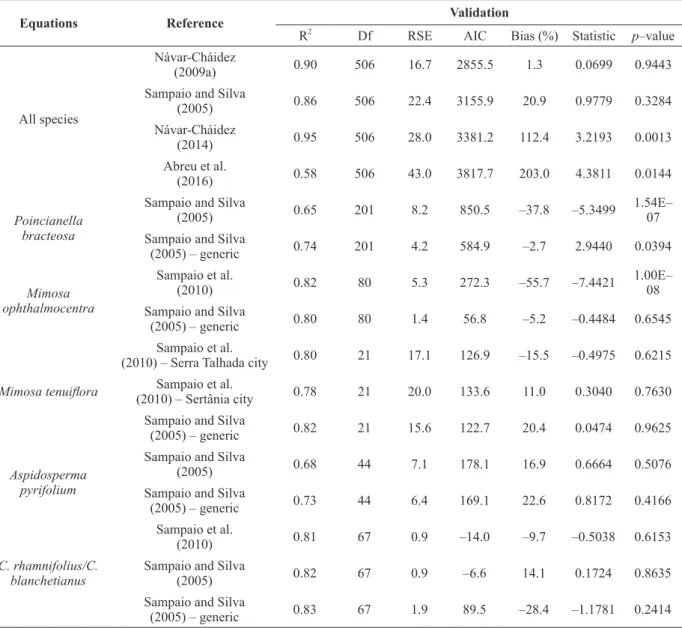
TABLE II
Errors, trends, qualities and paired t-test for aboveground biomass estimates of validated equations for multi-species and individual species data.
Equations Reference Validation
R2
Df RSE AIC Bias (%) Statistic p–value
All species
Návar-Cháidez
(2009a) 0.90 506 16.7 2855.5 1.3 0.0699 0.9443
Sampaio and Silva
(2005) 0.86 506 22.4 3155.9 20.9 0.9779 0.3284
Návar-Cháidez
(2014) 0.95 506 28.0 3381.2 112.4 3.2193 0.0013
Abreu et al.
(2016) 0.58 506 43.0 3817.7 203.0 4.3811 0.0144
Poincianella bracteosa
Sampaio and Silva
(2005) 0.65 201 8.2 850.5 –37.8 –5.3499
1.54E– 07 Sampaio and Silva
(2005) – generic 0.74 201 4.2 584.9 –2.7 2.9440 0.0394
Mimosa ophthalmocentra
Sampaio et al.
(2010) 0.82 80 5.3 272.3 –55.7 –7.4421
1.00E– 08 Sampaio and Silva
(2005) – generic 0.80 80 1.4 56.8 –5.2 –0.4484 0.6545
Mimosa tenuiflora
Sampaio et al.
(2010) – Serra Talhada city 0.80 21 17.1 126.9 –15.5 –0.4975 0.6215 Sampaio et al.
(2010) – Sertânia city 0.78 21 20.0 133.6 11.0 0.3040 0.7630 Sampaio and Silva
(2005) – generic 0.82 21 15.6 122.7 20.4 0.0474 0.9625
Aspidosperma pyrifolium
Sampaio and Silva
(2005) 0.68 44 7.1 178.1 16.9 0.6664 0.5076
Sampaio and Silva
(2005) – generic 0.73 44 6.4 169.1 22.6 0.8172 0.4166
C. rhamnifolius/C. blanchetianus
Sampaio et al.
(2010) 0.81 67 0.9 –14.0 –9.7 –0.5038 0.6153
Sampaio and Silva
(2005) 0.82 67 0.9 –6.6 14.1 0.1724 0.8635
Sampaio and Silva
(2005) – generic 0.83 67 1.9 89.5 –28.4 –1.1781 0.2414
Where: R2: is the coefficient of determination; Df: is the degree of freedom; RSE: is the standard error of the estimate; AIC: is
The results of the validation test show that the lowest values of Bias (%) are found in single entry equations for four cases Návar-Cháidez (2009a) – all species; Sampaio et al. (2010) – Sertânia – M. Tenuiflora; Sampaio and Silva (2005) – A. pyrifolium; Sampaio et al. (2010) – Croton) (Table
II).
Neither the estimates of the local equation developed by Abreu et al. (2016), both for all species in this study, tend to show a non-significant tendency, in other words, a non-significant tendency of underestimation. These higher values of Bias (tendency) corroborate the high values of the Akaike information criterion (AIC) and residual standard error (RSE), as well as values not significant for p-value (t-test paired with a = 0.01). The estimations obtained by the equations of Návar-Cháidez (2009a) and Sampaio and Silva (2005) did not show a significant difference when compared to the observed values of biomass for all species, in addition the validation of these equations explains more than 86% of the data.
Within species, the differences between the values observed and estimated by the specific equations were extremely high for P. bracteosa and
M. ophthalmocentra (Bias (%) = -37.7 and -55.7, respectively), evidencing overestimates by these equations. In this case, the values of AIC and RSE are lower for the general equation of Sampaio and Silva (2005), in which the paired t-test indicates that the compared biomass values are similar from the statistical point of view.
Although for M. tenuiflora, A. pyrifolium
and species of the Croton genus all validated equations were significant by the paired t-test, the highest AIC and RSE values are still shown by the specific equations mainly for M. tenuiflora and A. pyrifolium, although this does not invalidate the use of these equations, since the values of Bias (%) were inferior to those of the general equation of Sampaio and Silva (2005). For M. tenuiflora, the equations of both Serra Talhada and Sertânia cities
(Sampaio et al. 2010), present similar values of linear and angular coefficients, indicating that the dendrometric characteristics of this species do not differ of the species of this study at local scale. For A. pyrifolium, lower trend was found in the specific equation of Sampaio and Silva (2005), (Bias (%) = 16.8), being slightly inferior than that obtained by the general equation of Sampaio and Silva (2005). For the Croton genus the specific equation
of Sampaio et al. (2010) shows a lower tendency of overestimation (Bias (%) = -9.6). However, the values of AIC and RSE do not invalidate the use of the general equation of Sampaio and Silva (2005) for these species.
In relation to the biomass distribution by diameter class (Figure 4), it can be seen from the confidence interval that the general equation of Sampaio and Silva (2005) was more efficient in most cases. Considering all species, from the class of 18.5 cm in diameter, it was noticed a difference between the values of biomass observed and estimated by the equations. This result is due to the presence of discrepant data (outliers), where the biomass variability is higher than in the previous diameter classes. The validated equations were statistically satisfactory up to the diameter of 15.5 cm where the highest homogeneity of the data occurs. The exception was the Abreu et al. (2016) equation, which showed a difference in all classes for all analyzed cases.
For P. bracteosa and M. ophthalmocentra, in all diameter classes the general equation of Sampaio and Silva (2005) generalized the estimates more efficiently, except in the latter class for both species. The specific equations overestimated in all classes, corroborating with the validation results found, presenting statistical differences by the confidence intervals.
the confidence interval. The specific equations presented good performance except the Sampaio et al. (2010) – Serra Talhada equation for the class of 13.05 cm and Sampaio et al. (2010) – Sertânia equation for the class 16.05 cm. A. pyrifolium and
Croton genus species report good estimates for the validated equations up to the third diameter class, the other classes indicate greater variability resulting in differences by the confidence interval.
DISCUSSION
In order to reach accurate estimates of plant biomass stock, biomass validated equations to local, regional and global circumstances are mandatory (IPCC 2006, Sato et al. 2015). Although some
studies estimate aboveground biomass locally for the Floresta city (Abreu et al. 2016), the validated equations of other sites generalize with lower bias biomass values. For example, the Návar-Cháidez (2009a) equation explains ≥ 79% of the variation in aboveground biomass in a dry forest eco-region in Mexico, in the validation with dry forest biomass data in Brazil, the explained variation is higher than 90%. The general equation of Sampaio and Silva (2005) explains ≥ 94% for dry forests of Pernambuco and Bahia, for the biomass variation of this study, the equation explains 86% of the data variation. This total explained suggests that the ecological patterns of growth, development and establishment of the species are similar on a regional scale (Ceccon et al. 2006, Chidumayo and Figure 4 - Comparison of biomass stocks observed and validated by generic and specific equations by diameter class. The bars
Gumbo 2010). Thus, both the equation developed in Mexico and that developed in Brazil using local data sets may reduce the uncertainty in biomass estimation in the Floresta city.
These results confirm that the aboveground biomass of a tree can be obtained considering both the diameter and the product of the diameter with the height. In addition, the estimates of the parameters of local models by Sampaio and Silva (2005) for all species were not significantly different from the estimates of the parameters of the equations of Mexico. Models that include tree height improve biomass estimation in many tropical forests (Chave et al. 2005, Rutishauser et al. 2013).
Individually, for the species P. bracteosa
and M. ophthalmocentra these affirmations are corroborated, since better biomass estimates are obtained by the generic equation of Sampaio and Silva (2005), even considering the diametric distribution. The results of this work may suggest two considerations: (1) indicate that these species tend to present differences in ecological patterns of development, although the studied areas are from the same region but from different sites; or (2) the models were adjusted to estimate the biomass in trees with different dendrometric amplitudes (van Breugel et al. 2011), so the resulting equations tend to overestimate the biomass for these species in this study when considering only the diameter variable.
Although the height is an important variable in estimating the biomass for the studied dry forest, some studies show that estimates at individual or multi-species scales are more efficient when considering the basic density of wood (Deans et al. 1996, Baker et al. 2004, Chave et al. 2005, Vieilledent et al. 2012). This suggests a necessity for a revision of the IPCC guidelines (Aalde et al. 2006), since these guidelines recommend that allometric equations only depend of the tree diameter (Fayolle et al. 2013).
In regard to biomass estimates for M. tenuiflora,
A. pyrifolium and Croton genus, specific regional
equations are best indicated for the statistical validation test. This shows a similarity pattern between the biomass stocks of these species and the
Croton genus on a regional scale. Although these results are contrary to those obtained by equations validated for all species together with P. bracteosa
and M. ophthalmocentra, only the diameter variable is sufficient to estimate aboveground biomass, even at the level of diametric distribution.
There is a gap to be filled about the validity of equations globally (pan-tropical) validated across the tropics for dry forests, although some significant biases are reported by Kale (2004), Brandeis et al. (2006), Návar-Cháidez (2014), Sato et al. (2015) and Memiaghe et al. (2016). In tropical rainforests, the development of global models already provide significant evidence for estimates and global validations of biomass and carbon stock above the ground (Chave et al. 2005), although other studies suggest the correction of errors and the addition of variables in the models through different databases (Djomo et al. 2010, Henry et al. 2010, van Breugel et al. 2011, Vieilledent et al. 2012, Alvarez et al. 2012, Nogueira Lima et al. 2012).
The issue currently under discussion that is reported in this paper is if elsewhere in the tropics with dry forest dominance, where no equation of biomass of species or specific area is available, it would be better to use the generic equations or to develop local equations. Although the choice of the equation is an important source of uncertainty in biomass estimates (Chave et al. 2004, Fayolle et al. 2013), there is a lack of clear guidelines for the selection of existing models.
study, it can be observed that the specific equations for some species are not necessarily better than the generic equation (multi-species), which includes the total height of the tree as a predictive variable.
Contrary to the results of Basuki et al. (2009), the results of this work suggest the use of generic or site-specific equations with similar characteristics instead of the adjustment of models even considering only at the genus level (Croton). This
recommendation is indicated due to the fact that
the similarities of sites in tree biomass estimates are almost entirely driven by similarity in height and diameter patterns as observed in Sampaio and
Silva (2005), in this way, not only the diameter, but the tree height is an important factor that needs to be considered in order to improve forest biomass estimates (Feldpausch et al. 2011). Thus, it can be discarded the possibility of thinning trees to compose a significant sample to fit biomass generic and specific models.
The validation of generic equations, however, should be tested under particular environmental
conditions, for example in dry forests in water stress situations or at different precipitation scales, which may restrict the allometric relationship
between height and diameter (Nath et al. 2006). In addition, in order to avoid extrapolations above or below the confidence intervals, it should be also considered a compatible dendrometric amplitude of the data. A possible alternative to integrate biomass estimates based on forest inventory measurements would be the use of satellite
images or even LiDAR technology (Estornell et al. 2011, 2012, Almeida et al. 2014). Biomass models considering genus, families, successional groups,
climatic variables and specific density of wood should be adjusted, tested at both local and regional levels, as well as on tropics scales with dry forest
dominance.
ACKNOWLEDGMENTS
The authors are grateful for the help of the researchers José Serafim Feitosa Ferraz (in memoriam) and Cinthia Pereira de Oliveira who collaborated to the conclusion of this work. We also appreciate the forester German Hugo Gutiérrez Cespedez, who is responsible for Itampemirim farm management and conceded the area to the development of this work. The authors are thankful for the financial support provided by Conselho Nacional de Desenvolvimento Científico e Tecnológico (CNPq) and for the Fundação de Amparo à Ciência e Tecnologia de Pernambuco (FACEPE).
REFERENCES
AALDE H, GONZALEZ P, GYTARSKY M, KRUG T, KURZ WA, OGLE S, RAISON J, SCHOENE D, RAVINDRANATH NH AND ELHASSAN NG. 2006. Forest land. In: IPCC Guidelines for National Greenhouse Gas Inventories. Available at: <http://www.ipcc-nggip. iges.or.jp/public/2006gl/ > [accessed Sep 22 16].
ABREU JC, SILVA JAA, FERREIRA RLC AND ALVES JUNIOR FT. 2016. Ajuste de modelos matemáticos lineares e não lineares para estimativa de biomassa e nutrientes de Anadenanthera colubrina var. cebil no semiárido pernambucano. Sci For 111: 739-750.
AIDE TM, CLARK ML, GRAU HR, LÓPEZ-CARRD, LEVY MA, REDO D, BONILLA-MOHENO M, RINER G, ANDRADE-NÚÑE MJ AND MUÑIZ M. 2012. Deforestation and reforestation of Latin America and the Caribbean (2001–2010). Biotropica 45: 262-271.
ALMEIDA AQ ET AL. 2014. Relações empíricas entre características dendrométricas da Caatinga brasileira e dados TM Landsat 5. Pesqui Agropecu Bras 49: 306-315. ALVAREZ E, DUQUE A, SALDARRIAGA J, CABRERA K,
DE LAS SALAS G, DEL VALLE I, LEMA A, MORENO F, ORREGO S AND RODRÍGUEZ L. 2012. Tree above-ground biomass allometries for carbon stocks estimation in the natural forests of Colombia. For Ecol Manage 267: 297-308. ALVES JUNIOR FT, FERREIRA RLC, SILVA JAA,
BAKER TR, PHILLIPS OL, MALHI Y, ALMEIDA S, ARROYO L, DI FIORE A, ERWIN T, KILLEEN TJ, LAURANCE SG AND LAURANCE WF. 2004. Variation in wood density determines spatial patterns in Amazonian forest biomass. Glob Chang Biol 10: 545-562.
BASUKI TM, VAN LAAKE PE, SKIDMORE AK AND HUSSIN YA. 2009. Allometric equations for estimating the above-ground biomass in tropical lowland Dipterocarp forests. For Ecol Manage 257: 1684-1694.
BRANDEIS TJ, DELANEY M, PARRESOL BR AND ROYER L. 2006. Development of equations for predicting Puerto Rican subtropical dry forest biomass and volume. For Ecol Manage 233: 133-142.
BROWN S. 1997. Estimating Biomass and Biomass Change of Tropical Forests: a Primer. FAO Forestry Paper edition. UN FAO, Rome, Italy.
CECCON E, HUANTE P AND RINCÓN E. 2006. Abiotic factors influencing tropical dry forests regeneration. Braz Arch Biol Technol 49: 305-312.
CHAVE J ET AL. 2005. Tree allometry and improved estimation of carbon stocks and balance in tropical forests. Oecologia 145: 87-99.
CHAVE J, CONDIT R, AGUILAR S, HERNANDEZ A, LAO S AND PEREZ R. 2004. Error propagation and scaling for tropical forest biomass estimates. Philosophical transactions of the Royal Society of London. Series B. Biological Sciences 359: 409-420.
CHIDUMAYO EN AND GUMBO D. 2010. The Dry Forests and Woodlands of Africa Managing for Products and Services. Center for International Forestry Research, 2010, 288 p.
DEANS JD, MORAN J AND GRACE J. 1996. Biomass relationships for tree species in regenerating semi– deciduous tropical moist forest in Cameroon. For Ecol Manage 88: 215-225.
DJOMO AN, IBRAHIMA A, SABOROWSKI J AND GRAVENHORST G. 2010. Allometric equations for biomass estimations in Cameroon and pan moist tropical equations including biomass data from Africa. For Ecol Manage 260: 1873-1885.
EMBRAPA – EMPRESA BRASILEIRA DE PESQUISA AGROPECUÁRIA. 2007. Zoneamento Agroecológico do Estado de Pernambuco – ZAPE. Disponível em: <http:// www.uep.cnps.embrapa.br/zape>. [acesso 26 Set, 12]. ESTORNELL J, RUIZ LA, VELÁZQUEZ-MARTÍ B AND
FERNÁNDEZ-SARRÍA A. 2011. Estimation of shrub biomass by airborne LiDAR data in small forest stands. For Ecol Manage 262: 1697-1703.
ESTORNELL J, RUIZ LA, VELÁZQUEZ-MARTÍ B AND HERMOSILLA T. 2012. Estimation of biomass and volume of shrub vegetation using LiDAR and spectral data in a Mediterranean environment. Biomass and Bioenerg 46: 710-721.
FAYOLLE A, DOUCET JL, GILLET JF, BOURLAND N AND LEJEUNE P. 2013. Tree allometry in Central Africa: Testing the validity of pantropical multi-species allometric equations for estimating biomass and carbon stocks. For Ecol Manage 305: 29-37.
FELDPAUSCH TR ET AL. 2011. Height-diameter allometry of tropical forest trees. Biogeosciences 8: 1081-1106. GARIGLIO MA, SAMPAIO EVSB, CESTARO LA AND
KAGEYAMA PY. 2010. Uso sustentável e conservação dos recursos florestais da caatinga. Serviço Florestal Brasileiro, Brasília. 2010, 368 p.
GIBBS HK, BROWN S, NILES JO AND FOLEY JA. 2007. Monitoring and estimating tropical forest carbon stocks: making REDD a reality. Environ Res Lett 2: 1-13. GILLESPIE TW, LIPKIN B, SULLIVAN L, BENOWITZ
DR, PAU S AND KEPPEL G. 2012. The rarest and least protected forests in biodiversity hotspots. Biodivers Conserv 21: 3597-3611.
HENRY M, BESNARD A, ASANTE WA, ESHUN J, ADU-BREDU S, VALENTINI R, BERNOUX M AND SAINT-ANDRE L. 2010. Wood density, phytomass variations within and among trees, and allometric equations in a tropical rainforest of Africa. For Ecol Manage 260: 1375-1388.
IBGE - INSTITUTO BRASILEIRO DE GEOGRAFIA E ESTATÍSTICA. 2012. Manual Técnico da Vegetação Brasileira. 2ª ed., Rio de Janeiro, RJ – Brasil, 2012, 271 p. IPCC - THE INTERGOVERNMENTAL PANEL ON
CLIMATE CHANGE. Good practice guidance for land use, land-use change and forestry (GPGLULUCF). PCC– IGES, Kanagawa. 2003. Available at: <http://www.ipcc-nggip.iges.or.jp/public/gpglulucf/gpglulucf_files/GPG_ LULUCF_FULL.pdf> [accessed Sep 22, 16].
IPCC - THE INTERGOVERNMENTAL PANEL ON CLIMATE CHANGE. 2006. Guidelines for National Greenhouse Gas Inventories, vol. 4. In: Eggelstons S, Buendia L, Miwa K, Todd N and Tanabe K. Hayama, Japan: Institute for Global Environmental Strategies (IGES). Available at: <http://www.ipcc-nggip.iges.or.jp/ public/2006gl/> [accessed Sep 22, 16].
KALE M, SINGH S, ROY PS, DEOSTHALI V AND GHOLE VS. 2004. Biomass equations of dominant species of dry deciduous forest in Shivpuri district, Madhya Pradesh. Curr Sci 87: 683-686.
MAYER DG AND BUTLER DG. 1993. Statistical validation. Ecol Modell 68: 21-32.
MCLAREN KP, MCDONALD MA, HALL JB AND HEALEY JR. 2005. Predicting Species Response to disturbance from size class distributions of adults and Saplings in a Jamaican tropical dry forest. Plant Ecol 181: 69-84.
tropical evergreen forest at Rabi, Gabon. PLoS ONE 11: e0154988.
MILES L, NEWTON AC, DEFRIES RS, RAVILIOUS C, MAY I, BLYTH S, KAPOS V AND GORDON JE. 2006. A global overview of the conservation status of tropical dry forests. J Biogeogr 33: 491-505.
MURPHY P AND LUGO A. 1986. Ecology of tropical dry forest. Annu Rev Ecol Syst 17: 67-88.
NATH CD, DATTARAJA HS, SURESH HS, JOSHI NV AND SUKUMAR R. 2006. Patterns of tree growth in relation to environmental variability in the tropical dry deciduous forest at Mudumalai, southern India. J Biosci 31: 651-669. NÁVAR-CHÁIDEZ JJ. 2009a. Allometric equations for tree
species and carbon stocks for forests of northwestern Mexico. For Ecol Manage 257: 427-434.
NÁVAR-CHÁIDEZ JJ. 2009b. Biomass component equations for Latin American species and groups of species. Ann For Sci 66: 208-216.
NÁVAR-CHÁIDEZ JJ. 2014. Pan tropical biomass equations for Mexico’s dry forests. Agron Colomb 32: 367-376. NOGUEIRA LIMA AJ ET AL. 2012. Allometric models
for estimating above–and below–ground biomass in Amazonian forests at São Gabriel da Cachoeira in the upper Rio Negro, Brazil. For Ecol Manage 277: 163-172. PALAHÍ M, MIINA J, TOMÉ M AND MONTERO G. 2002.
Stand-level yield model for Scots pine (Pinus sylvestris
L.) in north–east Spain. Investig Agrar Sist Recur For 11: 409-424.
PEREIRA JUNIOR LR, ANDRADE EM, PALÁCIO HAQ, RAYMER PCL, RIBEIRO FILHO JC AND PEREIRA FJS. 2016. Carbon stocks in a tropical dry forest in Brazil. Rev Ciênc Agron 47: 32-40.
PORTILLO-QUINTERO C AND SÁNCHEZ-AZOFEIFA G. 2010. Extent and conservation of tropical dry forests in the Americas. Biol Conserv 143: 144-155.
POWERS JS, BECKNELL JM, IRVING J AND PÈREZAVILES D. 2009. Diversity and structure of regenerating tropical dry forests in Costa Rica: Geographic patterns and environmental drivers. Forest Ecol Manag 258: 959-970.
R CORE TEAM. 2015. R: A language and environment for statistical computing. R Foundation for Statistical Computing, Vienna, Austria. URL https://www.R–project.org/.
ROBINSON AP AND FROESE RE. 2004. Model validation using equivalence tests. Ecol Modell 176: 349-358. ROJAS-GARCÍA F, DE JONG BHJ,
MARTÍNEZ-ZURIMENDÍ P AND PAZ-PELLAT F. 2015. Database of 478 allometric equations to estimate biomass for Mexican trees and forests. Ann For Sci 72: 835-864.
RUTISHAUSER E, NOOR’AN F, LAUMONIER Y, HALPERIN J, RUFI’IE, HERGOUALC’H K AND VERCHOT L. 2013. Generic allometric models including height best estimate forest biomass and carbon stocks in Indonesia. For Ecol Manage 307: 219-225.
RYKIEL JUNIOR EJ. 1996. Testing ecological models: the meaning of validation. Ecol Modell 90: 229-244. SABOGAL C. 1992. Regeneration of tropical dry forests in
Central America, with examples from Nicaragua. J Veg Sci 3: 407-416.
SAMPAIO E, GASSON P, BARACAT A, CUTLER D, PAREYN F AND LIMA KC. 2010. Tree biomass estimation in regenerating areas of tropical dry vegetation in northeast Brazil. For Ecol Manage 259: 1135-1140. SAMPAIO EVSB AND SILVA GC. 2005. Biomass equations
for Brazilian semiarid caatinga plants. Acta Bot Brasilica 19: 935-943.
SATO T ET AL. 2015. Development of allometric equations for tree biomass in forest ecosystems in Paraguay. Jpn Agric Res Q 49: 281-291.
VAN BREUGEL M, RANSIJN J, CRAVEN D, BONGERS F AND HALL JS. 2011. Estimating carbon stock in secondary forests: decisions and uncertainties associated with allometric biomass models. For Ecol Manage 262: 1648-1657.