Esruoos DE EcoNOMIA, VOL. XVIII, N.0 4, OUTONO 1998
HUMAN CAPITAL STOCK: AN ESTIMATION
OF A TIME SERIES FOR PORTUGAL
Aurora Teixeira (*)
1 - Introduction
The rapid growth of research both theoretical and empirical in the area of human capital has been remarkable. This <<boomlet», however, had two distinct peaks: at the end of 50s, early 60s, with the theoretical works of Schultz (1961 ), Becker (1962), and Mincer (1962); then, in the middle of the eighties with the advent of the so-called new growth theories (endogenous growth theories) associated with Lucas (1988) and Romer (1986}'s contributions.
These latter theoretical works in particular have prompted a huge amount of empirical research, whose main general goal was to put forward some evidence for the widely accepted theoretical and common sense hypothesis that human capital investment is indeed an important engine of growth. However, paraphrasing De La Fuente et a/. (1996), this is a field <<Where theory seems to be well ahead of empirical measurement» (op. cit., 1). It is true that much of this empirical laggardliness can be explained by the limitations of available data, if they were available at all.
Recently, several attempts have been made to overcome those obstacles [Sarro and LEE (BL), 1993; Psacharoupoulos and Arriagada (PA), 1986; Kyriacou, 1991; Maddison, 1995; De La Fuente et a/., 1996]. These welcome contributions have made possible more accurate cross-country analysis within growth theory; however, its focus on international comparisons of estimated measures have not allowed detailed studies of single countries and, thus the direct testing of endogenous growth theory (Pack, 1994).
This paper tries to fill that gap. Based on the existing contributions, we estimate the stock of the human capital of the Portuguese economy. This estimate covers the period from 1960 to 1991 which, combined with other relevant variables, will allow long term analysis of Portuguese economic growth.
In the next section, we discuss and summarise the estimation procedures used by BL (1993), PA (1986) and Kyriacou (1991 ). Section 3 focuses on the application of a combined methodology to the Portuguese case, which gives rise to the estimate of Portuguese human capital, more precisely, the average years of education of the Portuguese population aged 25 and over. Here, we discuss
EsTuoos DE EcoNOMIA, voL. xvm, N.O 4, OuTONO 1998
underlying data and detail the procedure for filling in the missing observations; finally, we present several alternative estimates of human capital variables resulting from the methodology used, differentiated by basic assumptions related to schooling length. Section 4 provides a short comparison between our estimates and the available estimates given by some cross country data sets and attempts to explain potential discrepancies between them. Section 5 concludes by exposing the main limitations and potentialities of the estimates provided. The appendix includes all relevant estimations.
2 - Existing proxies for human capital: limitations and potentialities The last eleven years have seen renewed interest on the part of economists in search of an analysis of the determinants of growth (Romer, 1986; Lucas, 1988; Rebelo, 1991; Lains, 1995). In particular, new growth or endogenous theory has sought to establish a significant role for human capital in determining the rate of economic growth. This has led in turn to a renewal of efforts by economists to measure the human capital resources (1).
Development economists pioneered early efforts to construct education data sets which could be used to compare measures of education across countries. Lee and Psacharoupoulos (1979) give an account of these attempts and conclude that, especially in the case of developed countries, the lack of robustness of the link between enrolment rates (proxy of human capital) and economic growth was likely to result from the failure to measure and compare the quality of education outputs (2).
A large number of empirical studies concerned with the link between education and productivity have been widely using enrolment figures (namely, in international comparisons as in the UNESCO enrolment series). However, in the majority of cases this reflects more the easy availability and broad coverage of these data than their theoretical suitability for the purpose of the study. It is important to note that although we can consider enrolment rates an acceptable proxy for human capital investment (i. e., flow), they are not necessarily a good indicator of the existing stock of human capital. Thus, the main drawback of these rates is that they tend to reflect present flows of education, which constitute the accumulation of an element of human capital stock that will be available in the future; as the education process involves several years, lags between flows and stocks tend to be in general quite substantial. Furthermore, even given an appropriate time lag, human capital estimation requires an estimate of initial stock. (1) The widespread concern about the measurement of human capital is apparent in a recent document produced by the OECD (1996-b) which stresses the importance of human capital accounting to firms, individuals and governments.
(2) Steedman (1996) provides an extensive discussion of how measurement of the quality of
EsTUDOS DE ECONOMIA, VOL. XVIII, N.0 4, 0UTONO 1998
By the same token, using literacy rates as proxy for human capital [e. g., Romer (1990), and Nunes (1993) in Portuguese case] is far from the ideal in the sense that these only measure the current component of human capital and thus do not reflect obtained qualifications above basic levels of education. The literacy rate is only a first step in human capital formation; other elements of it exist which are equally or more important to productivity (namely, analytical, logical and numerical reasoning, as well as several technically based areas of knowledge). Therefore, using literacy rates to measure human capital stock implicitly assumes that education beyond basic levels does not contribute greatly to productivity.
In an attempt to overcome these shortcomings, data sets relating to education in a large number of countries over a continuous time span were subsequently constructed by PA (1986) e). Seeking to improve on the use of enrolment rate as an indicator of human capital, this study tried to measure directly the educational stock embodied in the population or labour force taking as unit of measurement the years of education. Two limitations to this data set are commonly pointed: its short coverage (in most cases there is only one observation per country) and the failure to differentiate between the value of years of education at different levels of the education system (Steedman, 1996). More recently, there have been several attempts (4) to construct more
com-plete data sets on human capital stocks which provide broader temporal coverage. Using UNESCO enrolment rates and PA's attainment figures, Kyriacou (1991) estimates an equation linking the years of schooling of the labour force and lagged enrolment rates. Then, assuming that this relationship is stable in time and across the country, he extrapolates values to other years and other countries; in this way, Kyriacou provides estimates of the average years of education of the workforce for a sample of 111 countries covering the period 1965-1985 (at five year intervals). However, temporal instability of the estimated relationship presents serious problems as regards the accuracy of human capi-tal estimates.
A more elaborated attempt to quantify at international level human capital stocks is that of BL (1993). Their data set on educational attainment has been constructed by combining the available data on attainment levels (gathered from each country's census) with the UNESCO enrolment figures to obtain a series of the average years of schooling and the educational composition of the adult population (25 years and over). In order to estimate attainment levels in years for which census data are not available, BL used a combination of extrapolation
(3) This study has drawn in earlier work by Kaneko (1986) and report data on the labour
force (and in some cases, some groups of population) in 99 countries.
(4) There are several studies which address this issue -see De La Fuente eta/. (1996) for
a careful comparative analysis of the databases most often used in empirical work on growth and human capital- however, we will only focus Sarro and Lee (1993)'s work. since our measure of human capital for the Portuguese case draws heavily on their methodology.
EsTUoos DE EcoNOMIA, VOL. xvm, N.0 4, OuroNo 1998
between available census figures and a perpetual inventory method which can be used to estimate changes from neighbouring (either forwards or backwards) benchmark observations. In short, enrolment data are transformed into attainment figures through this perpetual inventory method (which also takes into account groups' survival rates through data on the age composition of the population). This data set covers the period 1960-1985 at five-year intervals for 129 countries. Moreover, we can state that this work of BL (1993) represents an advance in mfinement in educational measurement across a large number of countries in that they do not merely estimate stocks of total years of education of the population but distinguish between years spent at different levels of the education system and, in the case of a subset of countries, between incomplete and com-plete primary and secondary education.
Nevertheless, it is not free of certain limitations, either derived from inconsistencies in the underlying primary statistics or from deficiencies in the methodology used to construct them. One of the main shortcomings of BL (1993)'s procedure is that it assumes that the mortality rate is the same for all generations aged 25 and over. Hence, the survival rates of the older generations, which are generally less educated than younger ones, will be overstated, and the figures obtained by the forward flow procedure are likely to underestimate attainment levels (De La Fuente
et
a/., 1996).BL (1993) make clear the limitations of their data arising from the funda-mental problems of missing or unreliable observations. They also stress the unreliability of data collection methods in a number of countries and problems derived from reliance on country data gathered by non-standardised methods. However, BL implicitly assume that the quality of education at the same level across countries can be considered comparable. This can be misleading in the sense that increasingly, «education and training in industrialised countries is characterised by diversification of the school population at around age 15/16 into different tracks with different goals and outputs.» (Steedman, 1996, p. 2).
Regardless of these limitations, we regard BL (1993)'s methodology as the one that provides a more accurate attempt to measure human capital stock. For this reason the construction of Portuguese human capital stock draws mainly on BL's work (though, some adaptations have been made, given our purpose of obtaining a continuous time series rather than five-year intervals estimates). An exposition· of the estimation procedure for Portuguese human capital stock is presented in the next section.
3 - Estimation of Portuguese human capital stock
In spite of important contributions of historian economists such as, Nunes, Valerio and Mata (1989), Reis (1989) and Lains (1995), there are few empirical studies on Portuguese economic growth and human capital, and the existing
Esruoos DE EcoNOMtA, voL. XVIII, N.0 4, OuToNo 1998 ones have been generally using data on literacy rates (e. g. Nunes, 1993) as a proxy to human capital variable. The main reason for this is the wider availability of this indicator, though we cannot reject its intended use given the fact that the Portuguese development level is still sufficiently low for illiteracy to remain a serious obstacle.
Therefore, measures of human capital based on education attainments are indeed a crucial need in the Portuguese context, not only to overcome the already mentioned deficiencies of more traditional measures but, most of all, to contribute to the enhancement of future empirical research in the area, as human capital has been recognised as an important engine of Portuguese development (Ne-ves, 1996)
The construction of Portuguese human capital stock revealed a very difficult and complex task. Pursued according to BL (1993) and Kyriacou (1991 )'s methodologies, and adding to conceptual problems inherent to the methodologies themselves, there were problems associated with the scarcity and quality of the existing statistical data (5). In this context, this measurement effort should be
considered as a very preliminary attempt subject to future improvements. In a first step we compiled the data on the educational attainment levels of the adult Portuguese population; this information was drawn from census statistics gathered by the National Statistical Institute (INE, 1960, 1970, 1981 and 1991).
Using the BL's perpetual inventory method it was possible to extrapolate, from the existing census figures, the fraction of Portuguese population (6) that
achieved each of the educational levels for intra-census adjacent years (see table A 1 of the appendix).
Thus, the main procedure (perpetual inventory method) starts with the census figures as a benchmark and then uses the school enrolment ratios (PRI, SEC and HIG) to estimate changes from the benchmarks.
Applying the formulas derived by BL (1993) we are able to estimate the proportion of adult population (25 years and over) from whom j
U
=
1 for total primary, j=
2 for total secondary and j=
3 for higher) is the highest level attained.(5) Related with this aspect, Domingos (1996) makes a critical assessment of existing relevant
sources, pointing out the differencies and pitfalls in the evolution reflected by the qualifications patent in the census data and those computed using education statistics -we acknowledge the contribution of one of the referees in supplying this information.
(6) We have present that the consideration of the adult population rather than the active
population constitutes a limitation of our human capital estimative, however, as Barra and Lee (1993) refer the former can be assumed as a reasonable approximation of the last - recent further investigations within human capital stocks estimation, at the international level, are trying to overcome this weakness, which would constitute an important issue to explore in future works.
Esruoos D£ EcoNOMIA, VOL. XVIII, N.0 4, OUTONO 1998
So, we have census-based values of hj,t for 1960, 1970, 1981 and 1991, and we seek to estimate the missing values.
where:
(
L25,J
L25, h1,t=
1 - -L,- .h1,t-5 +T
.(PRft-15 - SECt-10) (1)(
l25,J
L25, h2,t = 1 -T
.h2,t-5 +T
.(SECt-10 - HIGr-5) (2)(
L25,J
L25, hs,t=
1 - -L,- .hs,t-5 + -L,- .(HIGr-5) (3)Lf- population aged 25 and over at time t,
L25f- population aged [25, 29] at time t. This represents the people
who entered into the overall population aged 25 and above, during the last five years(?);
H.t
hj,t=
+ :
the proportion of the adult population for whom j is the thighest level of educational attainment
U:
total primary (1 ), total secondary (2) and higher (3)];PR/1 .... : the gross enrolment ratio for primary school observed at time
t-'t;
SEC
1
_~ : the gross enrolment ratio for secondary school observed attime t-'t;
HIG1 .... : the gross enrolment ratio for higher school observed at time t-'t.
For the period in question, 1960-1991, census data corresponded to 12.5% of the values for each education level. The perpetual inventory method allows us to fill in a further 25% of the values for primary education, 22% in case of secondary education and 12.5% for higher education.
To obtain the remaining missing values we use, similarly to Kyriacou (1991 ), a regression combining those two kind of information previously referred to (census and perpetual inventory-estimated attainment levels). Differently from Kyriacou, we introduce an additional explanatory variable to take into account population structure (and in this way to be closer to the perpetual inventory method).
h1,t = 0.131 + 0,346. (PRit-15- SECt-1o) + e1,t
(4)
(2.62) R= - 2 89,1%
(?) BL (1993) neglect here any mortality for persons aged 20-24 five years previously, and assume that the survival probability for persons who were 25 and over is independent of the level of educational attainment.
Esruoos DE EcoNOMIA, VOL. XVI/I, N.0 4, OuroNo 1998
(
1.25,)
1 nh2,t
=
-3.58 - 1.214.1 n-y;-
+ 0. 736.1 n( SEC1•10 - !!_IG1.s) + e2,1 (5)(-2.71) (13.04} R~ 97.1%
(
1.25,}
1 nh3,1
=
3.285 + 1.428-1 n -L,- 1.358.1 n (HIGt-s>:_ Bs,t(1.97) (12.46} R~ 95.7%
(6)
Given the problems of autocorrelation in the two first regressions, we corrected it using the likelihood estimation. As we can observe, all regressions present a good fit. The output of these estimations is presented in the appendix, table A2.
The next step was to estimate, although roughly, the fraction of adult population at more detailed education levels: incomplete and complete primary, secondary and higher education level. The starting point was once more census data concerning the individuals that achieved one of the three levels of education by degree of completeness. The resulting conclusion ratios are reported in table A3 (appendix). Subsequently, and in the same way as PA (1986) and BL (1993), the estimates of human capital stock were constructed from the formula:
where:
H
=
Dp (T·
h;p + hcp )+ (Dp + Ds1) h;s + (Dp + Ds1 + Ds2)• hce ++(Dp + Ds1 + Ds2 +
T
Dh;g) h;h;g + (Dp + Ds1 + DS2 + Dhig) hchig(7)
H. average years of schooling. Each percentage, hj, refers to the fraction of the population for which the fh level of schooling is the highest attained
U
= ip for incomplete primary, cp for complete primary, is for the first cycle of secondary, cs for the second cycle of secondary, ihig for incomplete higher, and chig for complete higher];0;: the duration in years of the ;th level of schooling [i = p for primary, s1 for the first cycle of secondary, s2 for the second cycle of secondary, and hig for higher].
For D; we consider the official length for each level of education as it is reported by INE (1979/80}: four years for primary, 6 years first cycle of lower secondary, 9 years for second cycle of lower secondary, 12 years for upper secondary and 18 years for higher school.
The estimates for Portuguese human capital stock are reported in the appendix, table A4. We constructed four measures of the average years of Portuguese adult population; for the first one (H) we consider only the three main levels of education without distinguishing between complete and incomplete levels; the remaining three estimates differ from each other relative to the length of the first cycle of secondary school (H' referring to the individuals who do not
Eswoos DE EcoNoMIA, VOL. XVIII, N.0 4, OUTONo 1998
complete any of the three education levels but at least achieved half of the years officially required; H" the same as H' but referring to the individuals who do not go further than the first cycle of lower secondary school as incomplete secondary;
H"' the same as H" but now the relevant length is the second cycle of lower secondary school, which it happens to be the compulsory education level in the Portuguese system).
To give an idea of the evolution of the proxy of the Portuguese human capital stock we depict below the plot for H"'.
FIGURE 1
Average years of education of Portuguese adult population (individuals aged 25 and over), 1960-1991
Source: See table A4 of the appendix.
Although is beyond the scope of this paper to analyse and interpret human capital stock evolution, we think that might be interesting to make a few comments on some aspects.
It is apparent that, in spite of the very low levels of human capital, during these last three decades the adult Portuguese population has been gradually raising its average level of education attainment, departing from a meanest value of 1.2 years of education in 1960 to 5.5 years in 1991. This represents a fairly reasonable average annual growth rate of roughly 5%. This might reflect an effort undertaken since the 1960s by the Portuguese authorities in the development of the education system. In spite of some improvements during the 60's, the broadening of the access to university ocurred mainly in the 70's (8).
(B) Particularly in 1973 with the reform of higher education (Veiga Simao reform) and with the democratic revolution of 1974- for more details see Carreira {1996).
Esruoos DE EcoNOMIA, VOL. xvm, N.0 4, OUTONO 1998
It is also worth stressing that the growth of human capital stock is particularly sharp after the second part of the eighties which is consistent with big increases in enrolment rates in higher education and the approach of secondary enrolment rates to 100% in this period. In spite of the Portuguese education performance remain far below the average of Western European countries, even those with similar levels of development (OECD, 1996-a}, education constitutes a priority of current development efforts. Our measurements can be further corroborated by studies of the Portuguese economy based on Mincerian earning functions. For 1985, Kiker and Santos (1991) find that the average rates of return to schooling in Portugal range from 9.4-10.4% as against 7.5-8.4% in 1977 (Psacharopoulos, 1981 ). This general rise in the rates of returns from 1977 to 1985 combined with the evolution of our indicator seem to indicate the important role of human capital in Portuguese development.
4 - Comparison with some international available estimates
In order to assess the main differences between our results and similar figures obtained in other commonly used cross-country data sets we compile the available estimates of human capital stock with reference to Portugal.
Year 1965 1973 1981 1985 1989 1991
Source (data sets)
Benhabib and Spiegel (1994) ... .. Maddison (1995) ... .. Psacharopoulos and Arriagada ( 1986) ... .. Barra and Lee (1993) (') ... .. Nehru, Swanson and Dubey (1995) (') ... . Benhabib and Spiegel (1994) ... .. OECD (1992) (') ... . OECD (1993) (2) ... .
Average years of education
Others Our estimate (3)
3.9 1.6 4.6 3.0 4.5 4.0 3.8 5.3 4.4 6.5 5.5 4.6 6.7 5.5
Notes.-Population groups vary as follows: BS (1994): active labour force [the methodology used by these authors is in line with that of Kyriacou (1991 )]; BL (1993): population aged 25 and over; Maddison (1995): population aged 15-64 (primary education was given a weight of 1, secondary 1.4, and higher 2, in line on the relative earnings associated with different levels of education). NSD (1995): population aged 15-64; OECD (1992, 1993): population aged 25-64 (as-sumes that average schooling of those educated to primary level is 6 years, lower secondary level 8 years, upper secondary level 11 years, non-university tertiary 14 years, university level 17 years); PA (1986): active labour force;
Source:
1) De Ia Fuente eta/. (1996); 2) Englander and Gurney (1994); 3) Teixeira (1996).
EsTUDOS DE EcoNOMtA, VOL. XVIII, N.0 4, OuTONO 1998
As we can see, in terms of levels, our estimates of average attainment are, in general, lower than ones presented by the international data sets, although its trajectory tends to be in the same direction. These discrepancies may be due mainly either to different groups of reference or to the different weight attributed to each schooling level. While we focus on the population aged 25 and over, BS (1994) and PA (1986) attempt to estimate the educational attainment of the active population (15 to 64 years), including in this way a broader and younger age group. If we take the reasonable assumption that younger generations tend to be more educated, we would expect that estimates to be lower [the same argument applies for the comparison with NSD (1995) and Maddison (1995)]. Another important aspect which can explain the larger differences between our measures and BS, Maddison and OECD' s measures, relates to the weight attributed to each educational level and, particularly, whether or not there is a discrimination between complete and incomplete attainments. This last aspect contributes significantly to an overestimation of human capital estimates in the three former studies since they assume that everybody who started a certain level has completed it.
In spite of these differences between our estimates and those gathered from the international data sets, we think that they can be somehow mitigated in the sense that, overall, they give us a consistent and reasonable picture of educational attainment levels and their evolution for the Portuguese population.
5 - Concluding comments
Because of data constraints the literature has often attempted to proxy the variables relevant to economic growth by those which are directly observable. This has been particularly common in empirical studies about human capital-economic growth relationship. Human capital has been proxied in several studies by enrolment ratios or literacy rates. At best, however, enrolment ratios represent investment levels in human capital. Literacy is a stock variable, but it involves important empirical problems; for instance, it does not account for the contribution of higher levels of education which tend to be crucial to productivity increases and, therefore, to aggregate economic growth.
The inadequacy of these indicators has motivated some researchers to construct more appropriate measurement of the stock of human capital. In section two we refer to the most widely diffused and accepted contributions. However, as we pointed out, all of them seek to construct international educational attainment databases. Alternatively, this paper describes the construction of educational attainment series to one single country (Portugal) for a continuous period of time, 1960 to 1991. The underlying information comes from census and enrolment figures provided by the Portuguese National Statistic Institute, INE.
Esruoos DE EcoNDMIA, VOL. xvm, N.O 4, OuroNo 1998
We follow closely Sarro and Lee (1993) methodology, and similarly focus on educational attainment for the population aged 25 and over, rather than for a younger age group or for a subgroup of the population such as the active labour population. Given the specificity of our procedure we resorted to Kyriacou (1991 )'s approach in order to complement Sarro and Lee's perpetual inventory method. As the main shortcomings of our human capital estimates (which derived, at least in part, from the underlying construction methodologies used), we may note:
The absence of any adjustment or correction for the quality of education, drop-outs or repeaters;
The assumption of equal survival probability for the population aged 25 and over; hence the survival rates of older generations, which are generally less educated than younger ones, will be overstated, and so the figures obtained are likely to underestimate human capital estimates;
The omission of the younger segments of the population (15-24 years of age) which tend to be much more educated than older generations (this will introduce a bias towards the underestimation of attainment levels);
The assumption that the relationship between census figures (educational stocks) and lagged enrolment data (educational flows) is stable over time (although, we tried to mitigate this assumption by taking into account potential changes in population structure). Notwithstanding these shortcomings and the necessity for future impro-vements, we reckon that the educational attainment estimates thus obtained will be a useful variable for studies related to Portuguese long term growth.
EsTuoos D£ EcoNoMtA, voL. XVIII, N." 4, OuToNo 1998
REFERENCES
SARRO, R. J., and LEE, J.-W. (1993), «International comparisons of educational attainment», .Journal of Monetary Economics, 32, pp. 363-394.
BECKER, G. S. (1962), «Investment in human capital: a theoretical analysis», Journal of Political Economy, val. 70, pp. 9-44.
BENHABIB, J., and SPIEGEL, M. M. (1994), «The role of human capital in economic development. Evidence from aggregate cross-country data», Journal of Monetary Economics, 34, pp. 143-173.
CARREIRA, H. M. (1996), As polfticas sociais em Portugal, Lisboa: Gradiva.
DE LA FUENTE, A., BOSCA, J., and DOMENECH, R. (1996), «Human capital and growth: theory ahead of measurement••, paper presented in the Third International Conference on Economic Theory, Santiago de Compostela, July, 12 to 14, 1996.
DOMINGOS, A. (1996), Educat;ao e crescimento econ6mico moderno- o caso portugues (perfo-do p6s II Guerra Mundial), Lisboa, ISEG.
ENGLANDER, A. S. and GURNEY, A. (1994), «Medium-term determinants of OECD productivity», OECD Economic Studies, no. 22, pp. 49-109.
INE (1979/1980), Estatfsticas de Educat;ao.
INE (1960, 1970, 1981 e 1991), XIXI/X/1/X/11 Recenseamento Geral da Populat;ao.
KANEKO, M. (1986), The education composition of the world population: a database, report no. EDT29, Education and Training Department, The World Bank, Washington, DC.
KIKER, F. B., and SANTOS, M.C. (1991), «Human capital and earnings in Portugal», Economics of Education Review, val. 10, no. 3, pp. 187-203.
KYRIACOU, G. A. (1991 ), Level and growth effects of human capital: a cross-country study of the convergence hypothesis, C. V. Starr Center for Applied Economics, New York University, New York.
LAINS, P. (1995), A economia Portuguesa no seculo XIX. Crescimento econ6mico e comercio externo 1851-1913, lmprensa Nacional Casa da Maeda.
LEE, K-H., and PSACHAROUPOLOS, G. (1979), «International comparisons of educational and economic indicators revisited», World Development, val. 7, pp. 995-1004.
LUCAS, R. E. (1988), «On the mechanics of economic development», Journal of Monetary Economics, 22, pp.3-42.
MADDISON, A. (1995), Monitoring the world economy 1820-1992, Development Centre Studies, Paris, OECD.
MINCER, J. (1962), «On-the-job training: costs, return and some implications», Journal of Political Economy, val. 70, no. 5, pp. 50-79.
NEVES, J. C. N. (1996), «Portuguese postwar growth: a global approach», in Crafts, N., and Toniolo, G. (eds.), Economic Growth in Europe since 1945, pp. 329-354, Centre for Economic Policy Research, Great Britain, Cambridge University Press.
NUNES, A. (1993), «Education and economic growth in Portugal: a simple regression approach», Estudos de Economia, val. XIII (2), Jan-Mar, pp. 181-205.
NUNES, A., MATA, E., and VALERIO, N. (1989), «Portuguese economic growth 1833-1985», The Journal of European Economic History, val. 18, no. 2, pp. 261-330.
PACK, H. (1994), «Endogenous growth theory: intellectual appeal and empirical shortcomings», Journal of Economic Perspectives, val. 8, no. 1, pp. 55-72.
PSACHAROPOULOS, G. (1981), «Returns to education: an update international comparison», Comparative Education, Vol. 17, pp. 321-341.
PSACHAROPOULOS, G., and ARRIAGADA, A. M. (1986), «La composition de Ia population ac-tive par niveau d'instruction: une comparaison internationale», Revue lnternationale du Travail, val. 125, Septembre-Octobre 1986, pp. 617-631.
OECD (1996a), Education at a glance. OECD indicators, Paris, OECD.
- - (1996b), Measuring what people know: human capital accounting for the knowledge economy, Paris, OECD.
Esruoos DE EcoNOMIA, VOL. xvm, N.0 4, OuroNo 1998
REBELO, S. T. (1991), «Long-run policy analysis and long-run growth», Journal of Political Economy, val. 99, no. 3, pp. 500-521.
REIS, J. (1989), «0 analfabetismo em Portugal no sEkulo XIX: uma interpretac;:ao», in Nova Eco-nomia em Portugal - Estudos de Homenagem a Antonio Manuel Pinto Barbosa, Lisboa, FE-UNL.
ROMER, P. M. (1990), «Human capital and growth: theory and evidence», Carnegie-Rochester Conference Series on Public Policy, 32, pp. 251-286.
SCHULTZ, T. (1961), «Investment in human capital», The American Economic Review, val. 51, no. 1, pp. 1-17.
STEEDMAN, H. (1996), «Measuring the quality of educational outputs: a note», Centre for Economic Performance, Discussion Paper no. 302, London School of Economics.
TEIXEIRA, A. (1996), «Capacidade de inovac;:ao e capital humano: contributes para o estudo do crescimento econ6mico portugues, 1960-1991••, Dissertation presented in Oporto Faculty of Economics as partial request for obtain the master degree in Economics.
ESTUDOS DE EcoNOMIA, VOL. XVIII, N.0 4, 0UTONO 1998
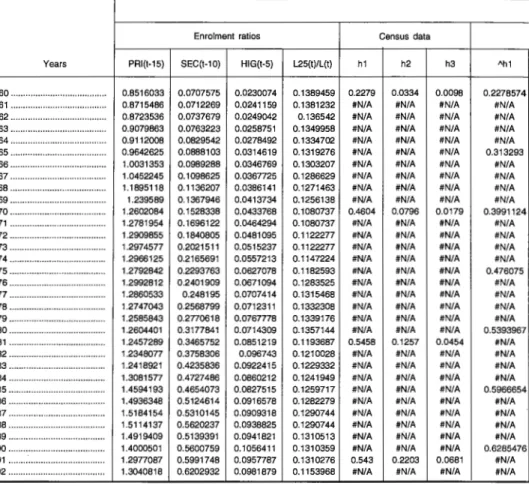
TABLE Estimation by the perpetual-inventory method (see Barro and Lee, 1993) of the proportion (h)
Enrolment ratios
Years PRI(t-15) SEC(t-10) HIG(t-5) L25(t)/L(t)
1960 ... 0.8516033 0.0707575 0.0230074 0.1389459 1961 ... 0.8715486 0.0712269 0.0241159 0.1381232 1962 ... 0.8723536 0.0737679 0.0249042 0.136542 1963 ... 0.9079863 0.0763223 0.0258751 0.1349958 1964 ... 0.9112008 0.0829542 0.0278492 0.1334702 1965 ... 0.9642625 0.0888103 0.0314619 0.1319276 1966 ... 1.0031353 0.0989288 0.0346769 0.1303207 1967 ··· 1.0452245 0.1098625 0.0367725 0.1286629 1968 ... 1.1895118 0.1136207 0.0386141 0.1271463 1969 ... 1.239589 0.1367946 0.0413734 0.1256138 1970 ... 1.2602084 0.1528338 0.0433768 0.1080737 1971 ··· 1.2781954 0.1696122 0.0464294 0.1080737 1972 ... 1.2909855 0.1840805 0.0481095 0.1122277 1973 ... 1.2974577 0.2021511 0.0515237 0.1122277 1974 ... 1.2966125 0.2165691 0.0557213 0.1147224 1975 ... 1.2792842 0.2293763 0.0627078 0.1182593 1976 ... 1.2992812 0.2401909 0.0671094 0.1283525 1977 ... 1.2860533 0.248195 0.0707414 0.1315468 1978 ... 1.2747043 0.2568799 0.0712311 0.1332308 1979 ... 1.2585843 0.2770618 0.0767778 0.1339176 1980 ... 1.2604401 0.3177841 0.0714309 0.1357144 1981 ... 1.2457289 0.3465752 0.0851219 0.1193687 1982 ... 1.2348077 0.3758306 0.096743 0.1210028 1983 ... 1.2418921 0.4235836 0.0922415 0.1229332 1984 ... 1.3081577 0.4727486 0.0860212 0.1241949 1985 ... 1.4594193 0.4654073 0.0827515 0.1259717 1986 ... 1.4936348 0.5124614 0.0916578 0.1282279 1987 ... 1.5184154 0.5310145 0.0909318 0.1290744 1988 ... 1.5114137 0.5620237 0.0938825 0.1290744 1989 ... 1.4919409 0.5139391 0.0941821 0.1310513 1990 ... 1.4000501 0.5600759 0.1056411 0.1310359 1991 ... 1.2977087 0.5991748 0.0957787 0.1310276 1992 ... 1.3040818 0.6202932 0.0981879 0.1153968 Notes:
PR/{t-15): enrolment ratio in primary 15 years ago; SEC(t-10): enrolment ratio in secondary 10 years ago; H/G(t-5): enrolment ratio in higher 5 years ago;
Census data
h1 h2 h3 "h1
0.2279 0.0334 0.0098 0.2278574
#N/A #N/A #N/A #N/A
#N/A #N/A #N/A #N/A
#N/A #N/A #N/A #N/A
#N/A #N/A #N/A #N/A
#N/A #N/A #N/A 0.313293
#N/A #N/A #N/A #N/A
#N/A #N/A #N/A #N/A
#N/A #N/A #N/A #N/A
#N/A #N/A #N/A #N/A
0.4604 0.0796 0.0179 0.3991124
#N/A #N/A #N/A #N/A
#N/A #N/A #N/A #N/A
#N/A #N/A #N/A #N/A
#N/A #N/A #N/A #N/A
#N/A #N/A #N/A 0.476075
#N/A #N/A #N/A #N/A
#N/A #N/A #N/A #N/A
#N/A #N/A #N/A #N/A
#N/A #N/A #N/A #N/A
#N/A #N/A #N/A 0.5393967
0.5458 0.1257 0.0454 #N/A
#N/A #N/A #N/A #N/A
#N/A #N/A #N/A #N/A
#N/A #N/A #N/A #N/A
#N/A #N/A #N/A 0.5966654
#N/A #N/A #N/A #N/A
#N/A #N/A #N/A #N/A
#N/A #N/A #N/A #N/A
#N/A #N/A #N/A #N/A
#N/A #N/A #N/A 0.6285476
0.543 0.2203 0.0681 #N/A
#N/A #N/A #N/A #N/A
L25(t)IL(t): proportion of population aged [25,29] in population group aged 25 and over; hi: proportion of adult population (aged 25 and over) which achieved the education level Ahi: estimate of hi by perpetual inventory method;
Ah1 = [1-L25(t)/L(Q]*h1 (t-5)+L25(Q/L(Q*[PRI(t-15)-SEC(t-1 0)]; Ah2 = [1-L25(t)/L(Q]*h2(t-5)+L25(Q/L(Q*[SEC(t-10)-H/G(t-5)]; Ah3 = [1-L25(t)/L(Q]*h3(t-5)+L25(Q/L(Q* HIG(t-5).
Esruoos DE EcoNOMIA, VOL. XVIII, N.0 4, OuroNo 1998 A1
of adult population that achieved the education level i (i = 1: primary; 2: secondary e 3: high)
Perpetual inventory method estimation
From 1960 From 1970 From 1981 From 1991
Ah2 Ah3 Ah1 Ah2 Ah3 Ah1 Ah2 Ah3 Ah1 Ah2 Ah3
0.0333 0.0097546 0.3070668 0.0788072 0.0121921 #N/A #N/A #N/A #N/A #N/A #N/A #N/A #N/A #N/A #N/A #N/A 0.2453616 0.0991116 0.0348224 0.0868 0.1263 0.05899
#N/A #N/A #N/A #N/A #N/A #N/A #N/A #N/A #N/A #N/A #N/A
#N/A #N/A #N/A #N/A #N/A #N/A #N/A #N/A #N/A #N/A #N/A
#N/A #N/A #N/A #N/A #N/A #N/A #N/A #N/A #N/A #N/A #N/A
0.0365 0.0126184 0.3820525 0.0759762 0.0147343 #N/A #N/A #N/A #N/A #N/A #N/A #N/A #N/A #N/A #N/A #N/A 0.3312227 0.0945687 0.0348035 0.1934 0.1182 0.05582
#N/A #N/A #N/A #N/A #N/A #N/A #N/A #N/A #N/A #N/A #N/A
#N/A #N/A #N/A #N/A #N/A #N/A #N/A #N/A #N/A #N/A #N/A
#N/A #N/A #N/A #N/A #N/A #N/A #N/A #N/A #N/A #N/A #N/A
0.0444 0.0159425 0.4604407 0.0795946 0.0178298 #N/A #N/A #N/A #N/A #N/A #N/A #N/A #N/A #N/A #N/A #N/A 0.415235 0.0976611 0.0360599 0.2923 0.1187 0.05480
#N/A #N/A #N/A #N/A #N/A #N/A #N/A liN/A liN/A #N/A #N/A
#N/A #N/A liN/A #N/A #N/A #N/A #N/A liN/A #N/A #N/A #N/A
#N/A liN/A #N/A #N/A #N/A #N/A liN/A #N/A #N/A #N/A #N/A
0.0588 0.021473 0.5301507 0.0898919 0.0231371 #N/A liN/A #N/A #N/A #N/A liN/A liN/A #N/A #N/A #N/A #N/A 0.4978754 0.1073415 0.0400452 0.3907 0.1257 0.05638
liN/A #N/A #N/A #N/A #N/A #N/A #N/A #N/A liN/A #N/A #N/A
liN/A #N/A #N/A #N/A #N/A #N/A #N/A #N/A liN/A #N/A #N/A
#N/A #N/A #N/A #N/A #N/A #N/A #N/A #N/A #N/A #N/A #N/A
0.0843 0.028253 0.5861336 0.1111259 0.0296912 #N/A #N/A liN/A #N/A #N/A #N/A #N/A #N/A #N/A #N/A #N/A 0.5457755 0.1257376 0.0454259 0.4514 0.1418 0.05981
#N/A liN/A #N/A liN/A #N/A #N/A #N/A liN/A liN/A #N/A #N/A
liN/A #N/A liN/A liN/A liN/A liN/A #N/A #N/A #N/A #N/A liN/A
liN/A #N/A liN/A #N/A #N/A #N/A #N/A #N/A liN/A #N/A #N/A
0.1219 0.0351182 0.6375147 0.145331 0.0363753 #N/A #N/A #N/A #N/A #N/A #N/A #N/A #N/A #N/A liN/A liN/A 0.6016056 0.1635733 0.0513542 0.5193 0.1777 0.06389
#N/A #N/A #N/A #N/A #N/A #N/A #N/A liN/A #N/A #N/A #N/A
#N/A #N/A #N/A #N/A #N/A #N/A #N/A #N/A liN/A #N/A #N/A
#N/A #N/A #N/A #N/A #N/A #N/A #N/A #N/A #N/A #N/A #N/A
0.1654 0.0443593 0.6640442 0.1858347 0.0454516 #N/A liN/A #N/A #N/A #N/A #N/A #N/A #N/A #N/A liN/A liN/A 0.6143059 0.2080995 0.057175 0.543 0.2203 0.06807
EsTUDOS DE EcoNOMIA, VOL. XVIII, N.0 4, OuroNo 1998 Constant h1=ct+~1 PS+ut ... 0.1308807 lnh2=<X+~11nSH+~21nLL+ut ... -3.5756518 lnh3=a+~11nH+~21nLL+ut ... 3.2845259 Year PS SH 1960 ... 0.7808458 0.0477501 1961 ··· 0.8003216 0.047111 1962 ... 0.7985856 0.0488638 1963 ... 0.831664 0.0504473 1964 ... 0.8282466 0.055105 1965 ... 0.8754522 0.0573484 1966 ... 0.9042065 0.0642518 1967 ... 0.9353619 0.0730901 1968 ... 1.075891 0.0750066 1969 ... 1.1027944 0.0954212 1970 ... 1.1073747 0.109457 1971 ... 1.1085832 0.1231828 1972 ... 1.1069051 0.135971 1973 ... 1.0953065 0.1506274 1974 ... 1.0800433 0.1608479 1975 ... 1.0499079 0.1666685 1976 ... 1.0590903 0.1730815 1977 ... 1.0378584 0.1774535 1978 ... 1.0178244 0.1856488 1979 ... 0.9815224 0.200284 1980 ... 0.942656 0.2463532 1981 ... 0.8991537 0.2614533 1982 ... 0.8589771 0.2790876 1983 ... 0.8183085 0.3313421 1984 ... 0.8354091 0.3867274 1985 ... 0.994012 0.3826559 1986 ... 0.9811733 0.4208036 1987 ... 0.9874009 0.4400827 1988 ... 0.94939 0.4681412 1989 ... 0.9780017 0.4197571 1990 ... 0.8399742 0.4544348 1991 ... 0.6985339 0.5033961 Source: Teixeira (1996). TABLE OLS/MAXL estimation ~1 ~2 0.3456789
-0.7355785 -1.2138744 1.3583933 1.4282055 Independent H LL lnPS 0.0230074 0.1389459 -0.2473776 0.0241159 0.1381232 -0.2227416 0.0249042 0.136542 ·0.2249131 0.0258751 0.1349958 -0.1843268 0.0278492 0.1334702 ·0.1884444 0.0314619 0.1319276 ·0.1330147 0.0346769 0.1303207 -0.1006975 0.0367725 0.1286629 -0.0668217 0.0386141 0.1271463 0.0731492 0.0413734 0.1256138 0.0978473 0.0433768 0.1080737 0.101992 0.0464294 0.1080737 0.1030828 0.0481095 0.1122277 0.1015679 0.0515237 0.1122277 0.0910343 0.0557213 0.1147224 0.0770012 0.0627078 0.1182593 0.0487024 0.0671094 0.1283525 0.0574104 0.0707414 0.1315468 0.0371593 0.0712311 0.1332308 0.0176674 0.0767778 0.1339176 -0.0186504 0.0714309 0.1357144 -0.0590539 0.0851219 0.1193687 -0.1063013 0.096743 0.1210028 ·0.152013 0.0922415 0.1229332 ·0.2005159 0.0860212 0.1241949 ·0.1798337 0.0827515 0.1259717 ·0.006006 0.0916578 0.1282279 -0.0190061 0.0909318 0.1290744 -0.0126791 0.0938825 0.1290744 -0.0519356 0.0941821 0.1310513 ·0.0222438 0.1056411 0.1310359 -0.1743842 0.0957787 0.1310276 ·0.3587716Esruoos D£ EcoNOMIA, voL. xvm, N.0 4, OuroNo 1998
A2
output of hs1
variables
lnSH lnH lnLL Ah1 Afnh2 Ah2 Afnh3 Ah3
·3.0417739 -3.7719392 -1.9736706 0.4008026 -3.417327 0.0328 -4.6580585 0.0094849 -3.0552482 -3.7248833 -1.9796089 0.407535 -3.42003 0.0327115 -4.6026191 0.0100255 -3.0187189 -3.6927204 -1.9911233 0.4069349 -3.3791828 0.0340753 -4.5753741 0.0103024 -2.9868264 -3.654476 -2.0025116 0.4183694 -3.3418995 0.0353697 -4.539688 0.0106767 -2.8985146 -3.5809505 -2.0138772 0.4171881 -3.2631428 0.0382679 -4.4560439 0.0116082 -2.85861 -3.458979 -2.0255023 0.4335061 -3.2196784 0.0399679 -4.3069617 . 0.0134744 -2.7449452 -3.3616803 -2.0377567 0.4434459 -3.1211937 0.0441045 -4.1922936 0.0151116 -2.6160628 -3.3030056 -2.0505593 0.4542156 -3.0108499 0.0492498 -4.1308749 0.0160688 -2.5901791 -3.2541372 -2.0624169 0.5027936 -2.9774167 0.0509242 -4.0814276 0.0168833 -2.3494545 -3.1851161 -2.074543 0.5120935 -2.7856253 0.0616905 -4.0049883 0.0182245 -2.2122235 -3.137831 -2.2249416 0.5136768 -2.5021162 0.0819115 -4.1555566 0.0156771 -2.0940862 -3.0698215 -2.2249416 0.5140946 -2.4152169 0.089348 -4.0631729 0.0171944 -1.9953138 -3.034276 -2.1872254 0.5135145 -2.3883447 0.0917815 -3.9610218 0.0190436 -1.8929459 -2.9657131 -2.1872254 0.5095051 -2.3130451 0.0989595 -3.8678864 0.0209025 -1.8272962 -2.8873936 -2.1652396 0.5042289 -2.2914426 0.1011205 -3.7300974 0.0239905 -1.7917486 -2.769269 -2.1348758 0.4938117 -2.3021524 0.1000433 -3.526272 0.0294144 -1.7539929 -2.7014309 -2.0529752 0.4969859 -2.3737972 0.0931264 -3.3171503 0.036256 -1.7290466 -2.6487237 -2.0283927 0.4896465 -2.3852872 .0.0920625 -3.2104445 0.0403387 -1.6838985 -2.6418261 -2.0156724 0.4827212 -2.3675182 0.093713 -3.1829074 0.0414649 -1.6080188 -2.5668395 -2.0105308 0.4701723 -2.317944 0.0984758 -3.0737028 0.0462496 -1.4009889 -2.6390251 -1.9972025 0.456737 -2.1818361 0.1128342 -3.1527239 0.0427356 -1.3414995 -2.4636708 -2.1255379 0.4416992 -1.9822938 0.1377529 -3.0978131 0.0451478 -1.2762295 -2.3356976 -2.1119412 0.427811 -1.9507873 0.1421621 -2.9045563 0.0547731 -1.1046039 -2.3833452 -2.0961138 0.4137527 -1.8437557 0.1582221 -2.9466756 0.052514 -0.9500353 -2.4531613 -2.0859035 0.4196641 -1.7424525 0.1750905 -3.0269308 0.0484642 -0.9606192 -2.4919135 -2.0716978 0.4744897 -1.7674817 0.1707625 -3.059283 0.0469213 -0.8655891 -2.3896929 -2.0539459 0.4700517 -1.7191282 0.1792223 -2.8950738 0.0552949 -0.8207925 -2.397646 -2.0473661 0.4722044 -1.6941638 0.1837528 -2.8964801 0.0552172 -0.7589853 -2.3657112 -2.0473661 0.4590648 -1.6486997 0.1922998 -2.8531 0.0576653 -0.8680792 -2.3625253 -2.0321667 0.4689553 -1.747397 0.1742269 -2.8270644 0.0591863 -0.7887009 -2.2477074 -2.0322836 0.4212421 -1.6888661 0.1847289 -2.6712635 0.0691648 ·0.6863779 -2.3457154 -2.0323474 0.3723492 -1.6135222 0.1991848 -2.804488 0.0605378
EsTUDOS DE EcoNOMIA, VOL. XVI/I, N.0 4, OuTONO 1998
TABLE A3
Conclusion ratios by educational level
Year RCp RCs RChig 1960 ··· 0.625 0.395 0.600 1961 ··· 0.625 0.395 0.600 1962 ··· 0.625 0.395 0.600 1963 ··· 0.625 0.395 0.600 1964 ... 0.625 0.395 0.600 1965 ··· 0.625 0.395 0.600 1966 ··· 0.625 0.395 0.600 1967 ··· 0.625 0.395 0.600 1968 ··· 0.625 0.395 0.600 1969 ··· 0.625 0.395 0.600 1970 ··· 0.625 0.395 0.600 1971 ··· 0.630 0.411 0.621 1972 ··· 0.635 0.428 0.642 1973 ··· 0.640 0.445 0.664 1974 ··· 0.645 0.464 0.687 1975 ··· 0.650 0.483 0.710 1976 ··· 0.655 0.502 0.734 1977 ··· 0.660 0.523 0.759 1978 ··· 0.665 0.544 0.786 1979 ··· 0.670 0.567 0.812 1980 ··· 0.676 0.590 0.840 1981 ··· 0.681 0.614 0.869 1982 ··· 0.685 0.618 0.872 1983 ··· 0.689 0.621 0.875 1984 ... 0.693 0.625 0.878 1985 ··· 0.697 0.629 0.881 1986 ··· 0.701 0.633 0.884 1987 ··· 0.705 0.637 0.887 1988 ··· 0.709 0.640 0.890 1989 ··· 0.714 0.644 0.893 1990 ··· 0.718 0.648 0.896 1991 ··· 0.722 0.652 0.899 1992 ··· 0.722 0.652 0.899 Notes:
1) RCp: Primary conclusion ratios; 2) RCs: Secondary conclusion ratios; 3) RChig: Higher education conclusion ratios;
4) Conclusion ratios calculation, for each level of education was based on the census figures of 1970, 1981 and 1991. We assumed that these ratios increased uniformly over time, i. e., for each year we apply average annual change rates calculated in table A9. The absence of data for 1960-1969, obliged us to assume that in this period conclusion ratios remained constant to 1970's levels.
Esruoos DE EcoNOMIA, VOL. XVIII, N.0 4, OuroNo 1998
Table A4
Portuguese human capital stock - average years of education of Portuguese adult population (aged 25 and over)
Year 1960 ... . 1961 ··· 1962 ··· 1963 ... . 1964 ... . 1965 ... . 1966 ... . 1967 ... . 1968 ... . 1969 ... . 1970 ... . 1971 ... . 1972 ... . 1973 ... . 1974 ··· 1975 ... . 1976 ... . 1977 ··· 1978 ··· 1979 ... . 1980 ... . 1981 ··· 1982 ... . 1983 ... . 1984 ... . 1985 ... . 1986 ... . 1987 ... . 1988 ... . 1989 ... . 1990 ... . 1991 ... . Notes: H 1.488 1.554 2.222 2.290 2.337 1.919 2.126 2.697 2.926 3.117 3.118 3.538 3.498 3.602 3.662 3.521 4.000 3.789 3.802 3.895 4.260 4.510 4.403 4.499 4.652 4.975 5.294 5.088 5.182 5.032 5.160 6.041 H' 1.224 1.279 1.822 1.878 1.917 1.580 1.753 2.218 2.406 2.561 2.558 2.908 2.893 2.994 3.065 2.961 3.411 3.252 3.281 3.388 3.708 3.949 3.895 3.982 4.114 4.381 4.676 4.524 4.619 4.496 4.639 5.412 H" 1.184 1.240 1.781 1.835 1.871 1.536 1.700 2.158 2.344 2.487 2.462 2.793 2.788 2.884 2.956 2.857 3.304 3.164 3.196 3.303 3.617 3.852 3.786 3.862 3.983 4.273 4.556 4.390 4.481 4.372 4.508 5.258
H: without differentiation between complete and incomplete education: H
=
4*h1+ (4+8)*h2 + (4+8+6)*h3 H"' 1.244 1.299 1.843 1.899 1.941 1.602 1.780 2.248 2.436 2.599 2.607 2.965 2.945 3.049 3.119 3.013 3.465 3.296 3.324 3.431 3.753 3.998 3.949 4.042 4.180 4.435 4.736 4.590 4.689 4.558 4.704 5.488H~ considering that individuals who do not complete secondary level achieved half of the schooling years required for this level:
H' = 4*(hpi/2 + hpc) + (4+8/2)*hsi + (4+8)*hsc + (4+8+612)*hhigi + (4+8+6)*hhigc H": considering as incomplete secondary level those individuals that only achieve the
. first cycle (six years of school):
H" = 4*(hpi/2 + hpc) + (4+2)*hsi + (4+8)*hsc + (4+8+612)*hhigi + (4+8+6)*hhigc
H"~ considering as if1complete secondary level those individuals that achieve the second
cycle (nine years of school):
H"'