“Molecular mechanisms triggering differentiation of the
embryonic endodermal stem cells”
Mestrado em Ciências Biomédicas
Declaração de autoria de trabalho
Declaro ser a autora deste trabalho, que é original e inédito. Autores e trabalhos consultados estão devidamente citados no texto e constam da listagem de referências incluída
______________________________________________ Eduarda Mazagão Guerreiro
Copyright: Eduarda Mazagão Guerreiro
A Universidade do Algarve tem o direito, perpétuo e sem limites geográficos, de arquivar e publicitar este trabalho através de exemplares impressos e reproduzidos em papel ou de forma digital, ou por qualquer outro meio conhecido ou que venha a ser inventado, de o divulgar através de repositórios científicos e de admitir a sua cópia e distribuição com objectivos educacionais ou de investigação, não comerciais, desde que seja dado crédito ao autor e editor.
Acknowledgements
This project was an opportunity that allowed me to grow professionally in a situation during which the experiences I had, the people I met,
First I have to express my gratitude to my supervisors, Dr. Natalia Soshnikova for giving me the opportunity to develop a project at her group, the group of Epigenetic Regulation of Transcription in Mouse Development and Disease - Institute of Molecular Biology (IMB), Mainz, Germany and guiding me through it; and Dr. José Bragança for having accepted to accompany me (although from far away) in this projet and for being available to help.
As this wouldn’t have been possible at all without the support from my parents, I have to express them my gratitude for continue to believe in me and for making this opportunity possible.
When I moved to Mainz to carry out this project Johannes, Jan and Henrik were the first people I met and received me at the house in a great way! Thank you for that guys and for just being there! Also very important during my stay, was the great group of people that received me in the lab – Christina, Stefi, Juri and Elif. They made my arrival very smooth, even though, at some moments, they started to communicate in a very strange language (german)… Until today I am still trying to understand how you guys manage to communicate.
It is also important to me to acknowledge the Institute of Molecular Biology for accepting me there to develop my work. Dr. Andreas Vonderheit, Dr. Malte Paulsen and Ina Schäfer, from IMB core facilities were also very important to the correct development of this project – Thank you.
To the lab neighbors – Thomas, Jonathan, Kat, Thaleia and Stephanos – thank you for the moments spent outside the IMB.
My adopted cousins Ana e Nelson (last, but not the least!), there are no words to thank you for just being there!
i.
Abstract
Mouse small intestine is a highly organized tissue with a three dimensional structure with finger-like protrusions – villi – surrounded at the base my multiple invaginations – crypts of Lieberkühn – making it the body largest interface. Due to the constant exposure to harsh conditions, the small intestine has a high cell renewal rate fuelled by stem cells present at the bottom of the crypts. In embryos, the structure that will give rise to the small intestine is formed around e8.5 to e9.0 and progressively acquires the characteristics of the small intestine with villus emerging at e15. At this time, cell proliferation is restricted to the intervillus region and will continue to be located there until the crypts develop in the postnatal period.
This work aimed to 1) validate the transcription profile of the ISCs previously obtained by performing in-situ hybridization analysis on paraffin sections of mouse embryos (e12.5, e13.5, e14.5 and e15.5) and adult small intestine and 2) understand in more detail the mechanisms involved in gene regulation by focusing in DNA methylation performing MBD-seq analysis. Bisulfite sequencing protocol was optimized for further DNA methylation analysis.
ISH analysis of Hes1, Notch2, Ascl2, Muc4, Dusp1, Cps1, Kcne3, Igfbp5 and Shh was indicative that the genetic program leading to the adult small intestine change, as target genes were detected to be expressed at different developmental stages. MBD-seq data allowed to detect also changes in DNA methylation in the genes Shh, Grb10, Foxa1, Id2, Ndufaf3, Nrp, Fz2, Meis1, Mdk, Efbn2, Lgr5, Vdr, Olfm4, Elf3, Ephb3 and Oct4. For the majority of the genes, an active transcription was associated with unmethylation of the DNA and methylation increased as the genes were inactive. In respect to the genes where this relation was not possible to establish, transcription regulation as result of other epigenetic markers should be investigated.
Key works: Small intestine, villi, crypt, intestinal stem cells, DNA methylation,
ii.
Resumo
O intestino delgado de ratinho é um tecido extremamente organizado, caracterizado por uma estrutura tridimensional. Esta estrutura apresenta protrusões em direcção ao lúmen – as vilosidades – rodeados na sua base por várias invaginações – as criptas de Lieberkühn. Como consequência desta estrutura, o intestino delgado é a maior superfície do corpo e está exposto constantemente a condições extremamente agressivas. Por este motivo, este tecido apresenta uma taxa de renovação celular extremamente elevada. A renovação do epitélio intestinal é assegurada pelas células estaminais presentes no fundo das criptas. A nível embrionário, a estrutura que irá dar origem ao intestino delgado forma-se no estadio e8.5 a e9.0, a partir da qual adquire progressivamente as características do intestino delgado funcional. As vilosidades surgem cerca de e15.0 e a região de proliferação celular restringe-se ao tecido entre as vilosidades onde permanecem até à formação das criptas após o nascimento.
Este trabalho propôs-se a 1) validar o perfil de transcrição das células estaminais intestinais que havia sido determinado previamente, recorrendo para o efeito a hibridação in-situ de secções de embriões de ratinho (e12.5, e13.5, e14.5 e e15.5) e de intestino delgado em parafina, bem como 2) compreender mais detalhadamente os mecanismos envolvidos na regulação da transcrição de genes focando-se na metilação do ADN através de análise por MBD-seq. O protocolo de sequenciação após tratamento com bissulfito de sódio foi optimizado para análises posteriores de metilação do ADN. A análise por hibridação in-situ de slides do genes Hes1, Notch2, Ascl2, Muc4, Dusp1, Cps1, Kcne3, Igfbp5 e Shh produziu resultados que indicam que o programa genético que conduz a um intestino delgado maduro é alterado. Isto é baseado nas alterações observadas na expressão dos genes cujos transcritos eram detectados em diferentes estadios de desenvolvimento. Relativamente aos dados de MBD-seq, estes permitiram detectar alterações na metilação dos genes Shh, Grb10, Foxa1, Id2, Ndufaf3, Nrp, Fz2, Meis1, Mdk, Efbn2, Lgr5, Vdr, Olfm4, Elf3, Ephb3 e Oct4. Para a maioria destes genes foi possível estabelecer uma relação entre o estado de transcrição e os níveis de metilação do ADN que os codifica – nos genes que estavam a ser transcritos a metilação do ADN era reduzida ou inexistente enquanto que os níveis de metilação aumentavam
consoante os genes estavam inactivos. Relativamente aos genes a respeito dos quais não foi possível manter esta relação, seria importante validar a hipótese de que outros marcadores epigenéticos possam estar envolvidos na regulação da expressão.
Palavras-chave: Intestino delgado, vilosidades, criptas, células estaminais do intestino,
iii. List of Abbreviation
A Adenine
aa Aminoacid
AE Adult enterocytes
AP Alkaline phosphatase
APC Adenomatous polyposis coli
APRO Antiproliferative
Ascl2 Achaete-scute complex homolog 2 BCIP 5-brom-4-chlor-3’-indolyl phosphatase
BMP Bone Morphogenetic Protein
Bp Base pair
Btg2 B-cell translocation gene 2
C Cytosine
CBC Crypt base columnar
ChIP Chromatin immunoprecipitation
CK1 Casein kinase 1
Co-Smads Common-mediator Smads
CpG Cytosine-phosphate-guanine
Cps1 Carbamoyl phosphate synthetase I
cRNA complementary RNA
DIG Digoxigenin
Disp Dispatched
Dll Delta
DNA Deoxyribonucleic Acid
DNMTs DNA methyltransferases
DNP Dinitrophenol
dNTPs Deoxyribonucleotide triphosphates
Dvl Dishevelled
DSL Delta, Serrate, Lag
Dusp1 Dual specificity phosphatase 1 ECM Extracellular matrix
E.coli Escherichia coli
EGFP Enhanced green fluorescent protein Eph Erythropoietin-producing hepatocellular Ephrin Eph receptor interacting proteins
ERK Extracellular signal-regulated kinase
ESC Embryonic stem cell
FACS Fluorescence activated cell sorting
FBS Fetal Bovine Serum
Fz Frizzled
Fw Forward
G Guanidine
gDNA Genomic DNA
GI Gastrointestinal
Gli Glioma-associated
GPI Glycosylphosphatidylinositol GSK3 Glycogen synthase kinase 3
Hh Hedgehog
IHC Immunohistochemical
Id2 Inhibitor of DNA binding 2
Ihh Indian hedgehog
IGF Insulin-like growth factor
Igfbp5 Insulin growth factor binding protein 5 IPTG Isopropyl--D-thiogalactopyranidose ISC Intestinal Stem Cell
ISH In-situ hybridization
Jag Jagged
JNK C-jun N-terminal kinase
KAc Potassium acetate
Kb Kilobase
kDa Kilodalton
LB Luria-Bertani
LEF Lymphoid enhancer factor
LRP Low-density lipoprotein receptor-related protein MBD-seq Methyl-CpG binding domain protein sequencing MBPs Methyl-binding proteins
MCS Multiple cloning site MgCl2 Magnesium cloride
min Minutes
mRNA Messenger RNA
Muc4 Mucin 4
NaOH Sodium hydroxide
NECD Notch extra-cellular domain NEXT Notch extracellular truncation NICD Notch Intracellular domain
Ngn3 Neurogenin 3
nt Nucleotides
O/N Overnight
PCR Polymerase Chain Reaction
pDNA Plasmid DNA
PFA Paraformaldehyde
Ptch Patched
qPCR Real-time Polymerase Chain Reaction
RNAs Ribonucleic Acids
R-Smads Receptor activated Smads
RT Room temperature
RTK Receptor tyrosine kinase
Rv Reverse
SDS Sodium dodecyl sulphate
Sec Seconds
Shh Sonic hedgehog
Smo Smoothened
Susd4 Sushi containing domain 4
T Tyrosine
Ta Temperature of annealing
TCF T-cell factor
UTR Untranslated region
X-Gal 5-bromo-4-chloro-3-indolyl--D-galactopyranoside Zfp36 Zinc finger protein 36
iv.
List of Images
Page Fig 1.1 Structure of the adult small intestine in mammals. The small intestine, in its
simplest form as a tube with several tissue layers surrounding the lumen (a). In the interior of this structure the villus cover the internal layer as they project towards the lumen as they are surrounded by the crypts of Lieberkühn (b). Image modified from http://www.made4ll.com/anatomy/small-intestine-villi/.
2
Fig 1.2 Representation of the crypt-villus axis in the small intestine. This structure can be divided into absorptive and proliferative compartments. In the absorptive compartment, the fully differentiated cells (enterocytes, goblet and enteroendocrine cells) carryout the absorptive functions of the small intestine. In the second compartment, stem cells and transit amplifying cells divide in order to feeding the renewal of the epithelial cells in the villus.
4
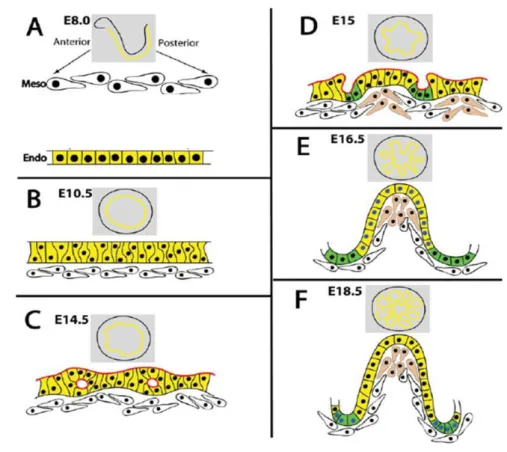
Fig 1.3 Representation of mouse intestinal development in embryo. From e8.0 to e8.5 the primitive gut tube is formed with endoderm closure (A). Epithelium elongates and forms a pseudo stratified epithelium (B). The primitive gut continues to elongate and at e14.0 the epithelium changes from a thightly packed structure to a columnar organization with intraepithelial cavities starting to form (C). Villus start to emerge at e15 (D) becoming evident at e16.5 (E). From e17, proliferative cells are restricted to the intravillus region – in green (F). Image from Spence et al (2011).
5
Fig 1.4 Intestinal stem cells of the small intestine. The specific location of the stems cells is a topic of some discussion with two stem cell populations reported to be present in the bottom of the crypt – crypt base columnar (CBC) cells and the +4 cells.
8
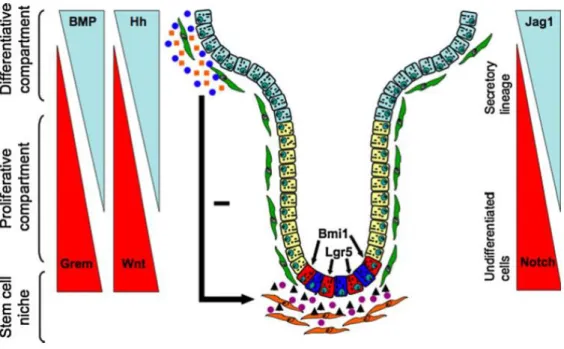
Fig 1.5 Several secreted factors regulate ISCs and distribution of the TA and differentiated cells. The Wnt/b-catenin pathway is expressed in a reciprocal gradient to the BMP and Hh pathways along the crypt-villus axis, with these last two inhibit the Wnt signaling. Notch expression is higher at the bottom of the crypt and as it gradually decreases towards the villi, ISCs differentiate into the secretory lineage.
11
Fig 1.6 Schematic representation of the canonical Wnt/b-catenin pathway. In the presence of Wnt ligands the ubiquitination of b-catenin is blocked and b-catenin translocates into the nucleus. The expression of Wnt dependet genes is induced
Fig 1.7 Model for the Nocth signaling pathway. The binding of the DSL family ligands initiate the signaling cascade triggering the transcription of Notch downstream target genes.
15
Fig 1.8 Epigenetic mechanisms and the link between environmental factor and phenotipical alterations.
20
Fig 4.1 Mouse embryos at developmental stages e12.5 (A) and e14.5 (B) and small section of adult small intestine (C).
54
Fig 4.2 Products of PCR reaction for the amplification of a fragment of Ngn3 on a 1.5% agarose gel in 1X TAE, stained with EtBr. Lanes 1 to 4 are different PCR products, specific for Ngn3, lane L is the DNA ladder Gene Ruler 1Kb Plus DNA and lane C- is the negative control for the PCR reaction. (Samples run from the highest to the lowest molecular weight).
56
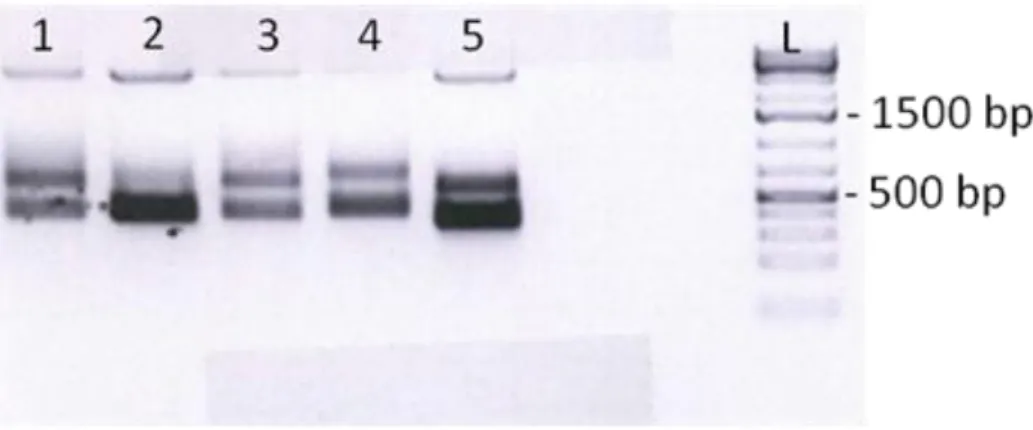
Fig 4.3 Probes for the ISH method (5 l of each probe) in a 1.5% agarose gel in 1X TAE, stained with EtBr. cRNA probes DIG-labeled were Ascl2 (lane 1), Muc4 (lane 2), Igfbp5 (lane 3), Btg2 (lane 4) and Dusp1 (lane 5). Lane L is the ladder Gene Ruler 1Kb Plus DNA. (Samples run from the highest to the lowest molecular weight).
57
Fig 4.4 Notch2 probe, DIG-labeled, with 5 l of Orange DNA Loading dye in a 1.5% agarose gel stained with EtBr. Lane L is the ladder Gene Ruler 1Kb Plus DNA and lane 1 is the probe for Notch2. (Samples run from the highest to the lowest molecular weight).
57
Fig 4.5 Ngn3 probe, DIG-labeled, with 5 l of Orange DNA Loading dye in a 1.5% agarose gel stained with EtBr. Lane L is the ladder Gene Ruler 1Kb Plus DNA and lane 1 is the probe for Notch2. (Samples run from the highest to the lowest molecular weight).
58
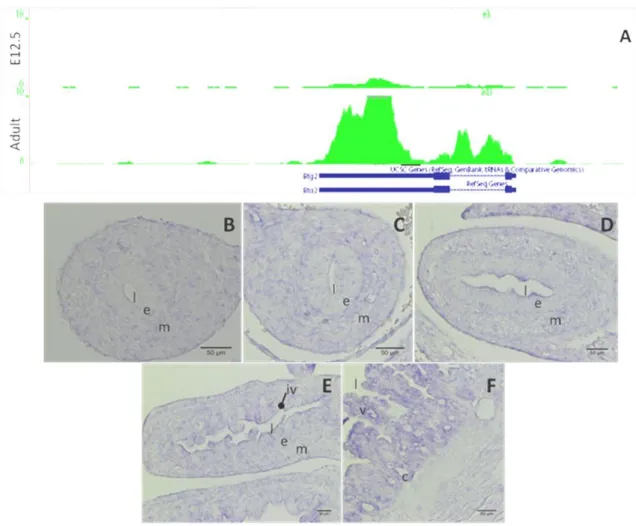
Fig 4.6 Expression pattern of the gene Ascl2 resulting from RNA-seq (A) and ISH (B to F). Data from RNA-seq (A) show the expression pattern between mouse e12.5 and adult ISC. ISH specific for the gene Ascl2 in fixed sections of mouse embryos e12.5 (B), e13.5 (C), e14.5 (D) and e15.5 (E) and adult mouse small intestine (F). Note the different structures present in the sections throughout the developmental stages, l – lumen, e - endothelium, m – mesenchyme, iv – intravillus region, v – villi, c – crypt. Scale bar corresponds to 50m.
59
Fig 4.7 Expression pattern of the gene Btg2 resulting from RNA-seq (A) and ISH (B to F). Data from RNA-seq (A) show the expression pattern between mouse e12.5 and adult ISC. ISH specific for the gene Btg2 in fixed sections of mouse embryos e12.5 (B), e13.5 (C), e14.5 (D) and e15.5 (E) and adult mouse small intestine (F). Note the different structures present in the sections throughout the developmental stages, l – lumen, e - endothelium, m – mesenchyme, iv – intravillus region, v – villi, c – crypt. Scale bar corresponds to 50m.
60
Fig 4.8 Expression pattern of the gene Cps1 resulting from RNA-seq (A) and ISH (B to F). Data from RNA-seq (A) show the expression pattern between mouse e12.5 and adult ISC. ISH specific for the gene Cps1 in fixed sections of mouse embryos e12.5 (B), e13.5 (C), e14.5 (D) and e15.5 (E) and adult mouse small intestine (F). Note the different structures present in the sections throughout the developmental stages, l – lumen, e - endothelium, m – mesenchyme, iv – intravillus, v – villi, c – crypt. Scale bar corresponds to 50m.
Fig 4.9 Expression pattern of the gene Dusp1 resulting from RNA-seq (A) and ISH (B to F). Data from RNA-seq (A) show the expression pattern between mouse e12.5 and adult ISC. ISH specific for the gene Dusp1 in fixed sections of mouse embryos e12.5 (B), e13.5 (C), e14.5 (D) and e15.5 (E) and adult mouse small intestine (F). Note the different structures present in the sections throughout the developmental stages, l – lumen, e - endothelium, m – mesenchyme, iv – intravillus, v – villi, c – crypt. Scale bar corresponds to 50m to all sections except F, where it corresponds to 75m.
62
Fig 4.10 Expression pattern of the gene Hes1 resulting from RNA-seq (A) and ISH (B to F). Data from RNA-seq (A) show the expression pattern between mouse e12.5 and adult ISC. ISH specific for the gene Hes1 in fixed sections of mouse embryos e12.5 (B), e13.5 (C), e14.5 (D) and e15.5 (E) and adult mouse small intestine (F). Note the different structures present in the sections throughout the developmental stages, l – lumen, e - endothelium, m – mesenchyme, iv – intravillus, v – villi, c – crypt. Scale bar corresponds to 50m to all sections except F, where it corresponds to 75m.
63
Fig 4.11 Expression pattern of the gene Igfbp5 resulting from RNA-seq (A) and ISH (B to F). Data from RNA-seq (A) show the expression pattern between mouse e12.5 and adult ISC. Note the exon represented with the solid box at the bottom. ISH specific for the gene Igfbp5 in fixed sections of mouse embryos e12.5 (B), e13.5 (C), e14.5 (D) and e15.5 (E) and adult mouse small intestine (F). Note the different structures present in the sections throughout the developmental stages, l – lumen, e - endothelium, m – mesenchyme, iv – intravillus, v – villi, c – crypt. Scale bar corresponds to 50m to all sections except F, where it corresponds to 75m.
64
Fig 4.12 Expression pattern of the gene Kcne3 resulting from RNA-seq (A) and ISH (B to F). Data from RNA-seq (A) show the expression pattern between mouse e12.5 and adult ISC. Note the exon represented with the solid box at the bottom. ISH specific for the gene Kcne3 in fixed sections of mouse embryos e12.5 (B), e13.5 (C), e14.5 (D) and e15.5 (E) and adult mouse small intestine (F). Note the different structures present in the sections throughout the developmental stages, l – lumen, e - endothelium, m – mesenchyme, iv – intravillus, v – villi, c – crypt. Scale bar corresponds to 50m to all sections except F, where it corresponds to 75m.
65
Fig 4.13 Expression pattern of the gene Muc4 resulting from RNA-seq (A) and ISH (B to E). Data from RNA-seq (A) show the expression pattern between mouse e12.5 and adult ISC. Note the exon represented with the solid box at the bottom. ISH specific for the gene Muc4 in fixed sections of mouse embryos e12.5 (B), e14.5 (C), e15.5 (D) and adult mouse small intestine (E). Note the different structures present in the sections throughout the developmental stages, l – lumen, e - endothelium, m – mesenchyme, iv – intravillus, v – villi, c – crypt. Scale bar corresponds to 50m to all sections except E, where it corresponds to 75m.
Fig 4.14 Expression pattern of the gene Notch2 resulting from RNA-seq (A) and ISH (B to E). Data from RNA-seq (A) show the expression pattern between mouse e12.5 and adult ISC. Note the exon represented with the solid boxes at the bottom. ISH specific for the gene Notch2 in fixed sections of mouse embryos e13.5 (B), e14.5 (C), e15.5 (D) and adult mouse small intestine (E). Note the different structures present in the sections throughout the developmental stages, l – lumen, e - endothelium, m – mesenchyme, iv – intravillus, v – villi, c – crypt. Scale bar corresponds to 50m to all sections except E, where it corresponds to 75m.
67
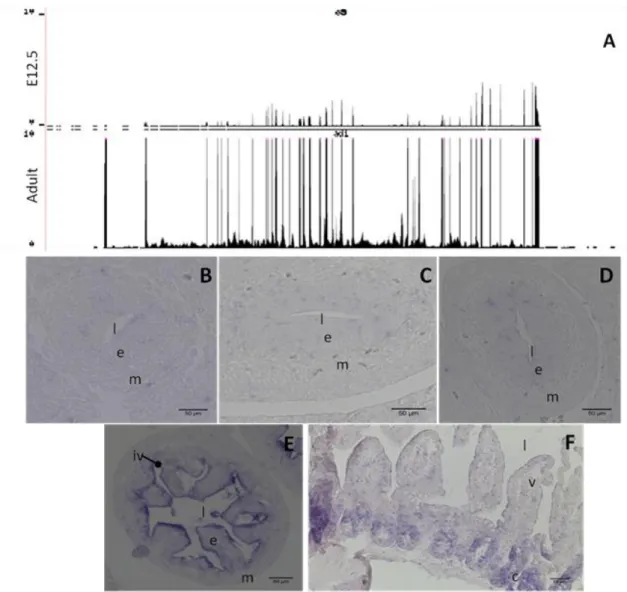
Fig 4.15 Expression pattern of the gene Shh resulting from RNA-seq (A) and ISH (B to E). Data from RNA-seq – number of reads (A) show the expression pattern between mouse e12.5 and adult ISC. Note the exon represented with the solid box at the bottom. ISH specific for the gene Shh in fixed sections of mouse embryos e12.5 (B), e14.5 (C), e15.5 (D) and adult mouse small intestine (E). Note the different structures present in the sections throughout the developmental stages, l – lumen, e - endothelium, m – mesenchyme, iv – intravillus, v – villi, c – crypt. Scale bar corresponds to 50m to all sections except E, where it corresponds to 75m.
68
Fig 4.16 Mouse embryos abdominal organs at developmental stages e12.5 (A) and e14.5 (B) and small section of adult small intestine (C). The abdominal organs collected included liver (L), stomach (st), small intestine (si), large intestine (li), lungs (lg), heart (h) and in the tissues collected from e12.5 (A) it’s possible to identify the ceccum (c). Scale bars are 1 mm for insert A and 2 mm for inserts B and C.
69
Fig 4.17 Cell sorting (FACS) of adult ISCs from male Lgr5-EGFP-ires-creERT2 stained with EpCAM, CD31 and CD45, and DAPI. Cellular events (A), single cell events (B) and Lgr5-eGFP positive events (C) were isolated in order to prepare a purified cell suspention of the targeted adult ISCs.
70
Fig 4.18 Cell sorting (FACS) of adult enterocytes from male Lgr5-EGFP-ires-creERT2 stained with EpCAM, CD31 and CD45, and DAPI. Cellular events (A), single cell events (B) EpCAM, CD31 and CD45 stained cells (C). Living cells EpCAM positive and CD31/CD45 negative (D) were isolated in order to prepare a purified cell suspention of the targeted adult ISCs.
71
Fig 4.19 Cell sorting (FACS) of embryonic endothelium cells from small intestine of stage e12.5, stained with EpCAM and CD31. Target cells were EpCAM+/CD31-. Cellular events (A), single cell events (B) EpCAM, and CD31 stained cells (C). Living cells EpCAM positive and CD31 negative (D) were isolated in order to prepare a purified cell suspention of the targeted embryonic ISCs.
72
Fig 4.20 Cell sorting (FACS) of embryonic endothelium cells from small intestine of stage e14.5, stained with EpCAM, CD31 and CD45. Target cells were EpCAM+/CD31CD45-. Cellular events (A), single cell events (B) EpCAM, CD31 and CD45 stained cells (C). Living cells EpCAM positive and CD31/CD45 negative (D) were isolated in order to prepare a purified cell suspention of the targeted embryonic ISCs.
Fig 4.21 Expression (lines A and B) and methylation (lines C and D) profiles of a region of the gene Ndufaf3 in ISC at developmental stage e12.5 (lines A and C) and adult (lines B and D). Note the exon represented with the solid blue boxes at the bottom.
74
Fig 4.22 Expression (lines A and B) and methylation (lines C and D) profiles throughout the gene Id2 in ISC at developmental stage e12.5 (lines A and C) and adult (lines B and D). Note the exon represented with the solid blue boxes at the bottom.
74
Fig 4.23 Expression (lines A and B) and methylation (lines C and D) profiles of a region of the gene Foxa1 in ISC at developmental stage e12.5 (lines A and C) and adult (lines B and D). Note the exon represented with the solid box at the bottom.
75
Fig 4.24 Expression (lines A and B) and methylation (lines C and D) profiles of a region of the gene Nrp2 in ISC at developmental stage e12.5 (lines A and C) and adult (lines B and D).
75
Fig 4.25 Expression (lines A and B) and methylation (lines C and D) profiles of a region of the gene Shh in ISC at developmental stage e12.5 (lines A and C) and adult (lines B and D). Note the exon represented with the solid box at the bottom.
76
Fig 4.26 Expression (lines A and B) and methylation (lines C and D) profiles of a region of the gene Fzd2 in ISC at developmental stage e12.5 (lines A and C) and adult (lines B and D). Note the exons as solid boxes at the bottom of the image.
76
Fig 4.27 Expression (lines A and B) and methylation (lines C and D) profiles of a region of the gene Meis1 in ISC at developmental stage e12.5 (lines A and C) and adult (lines B and D). Note the exons as solid boxes at the bottom of the image.
77
Fig 4.28 Expression (lines A and B) and methylation (lines C and D) profiles of a region of the gene Grb10 in ISC at developmental stage e12.5 (lines A and C) and adult (lines B and D).
77
Fig 4.29 Expression (lines A and B) and methylation (lines C and D) profiles of a region of the gene Mdk in ISC at developmental stage e12.5 (lines A and C) and adult (lines B and D). Note the exons as solid boxes at the bottom of the image.
78
Fig 4.30 Expression (lines A and B) and methylation (lines C and D) profiles throughout the gene Olfm4 in ISC at developmental stage e12.5 (lines A and C) and adult (lines B and D). Note the exons as solid boxes at the bottom of the image.
79
Fig 4.31 Expression (lines A and B) and methylation (lines C and D) profiles of a region of the gene Elf3 in ISC at developmental stage e12.5 (lines A and C) and adult (lines B and D).Note the exons as solid boxes at the bottom of the image.
79
Fig 4.32 Expression (lines A and B) and methylation (lines C and D) profiles of a region of the gene Ephb3 in ISC at developmental stage e12.5 (lines A and C) and adult (lines B and D). Note the exons as solid boxes at the bottom of the image.
80
Fig 4.33 Expression (lines A and B) and methylation (lines C and D) profiles of a region (an intron) of the gene Vdr in ISC at developmental stage e12.5 (lines A and C) and adult (lines B and D).
80
Fig 4.34 Expression (lines A and B) and methylation (lines C and D) profiles of a region (an intron) of the gene Oct4 in ISC at developmental stage e12.5 (lines A and C) and adult (lines B and D).
Fig 4.35 Expression (lines A and B) and methylation (lines C and D) profiles of a region of the gene Lgr5 in ISC at developmental stage e12.5 (lines A and C) and adult (lines B and D).Note the exons as solid boxes at the bottom of the image.
81
Fig 4.36 Expression (lines A and B) and methylation (lines C and D) profiles of a region of the gene Efbn2 in ISC at developmental stage e12.5 (lines A and C) and adult (lines B and D). Note the exons as solid boxes at the bottom of the image.
82
Fig 4.37 Products of PCR reactions in a 1.5% agarose gel in 1X TAE stained with EtBr. PCR reaction was carried out for the amplification of several gene fragments – Ephb3, Id2, Fzd2, Oct4, Ndufaf3, Olfm4, Elf3 and Grb10 – after sodium bisulfate treatment of DNA. Triplicates of each developmental stage (e12.5, e14.5, adult ISC and AE) were prepared.
v.
List of tables
Page Table 3.1 Sequences of the specific primers, forward (Fw) and reverse (Rv) for
amplification of Ngn3 fragment by PCR and predicted size of the fragment (in base pairs, bp).
31
Table 3.2 PCR cycling conditions for amplification of a Ngn3 fragment with
specific primers. Data refers to temperatures (in ºC), duration of each step (in min or seconds, sec) and also the number of cycles to each set of denaturation, annealing and extension steps.
31
Table 3.3 Reaction Mix for Ngn3 fragment amplification by PCR. Primers were
those described in table 3.1 (Sigma-Aldrich, Germany), Taq polymerase and Reaction buffer were from the EpiMark Hot Start Taq kit (New England Biolabs, Germany) and template gDNA from adult mouse tails digested with proteinase K.
31
Table 3.4
Components (volumes in l) of the reaction mix for the ligation of the Ngn3 fragments, amplified by PCR and purified, in the plasmid pGEM-T (Promega).
34
Table 3.5 Reaction mix for the restriction digestion of the pDNA for different
genes. Digestion reactions were carried out with 10 mg of pDNA except for those marked with * (maximum amount of pDNA for the reaction volume of 100l were the values presented; x corresponds to the volume of water needed to make 100l of total volume; restriction enzymes, buffer and BSA from New England Biolabs).
37
Table 3.6 Reaction mix for the synthesis of RNA DIG-labeled probes for ISH of
slides. Synthesis of the RNA probes was carried out with T7 RNA polymerase or SP6 RNA polymerase, according to the fragment orientation. Probes were labeled with DIG using DIG labeling mix (Roche, Germany) and RNase Out (Invitrogen, Germany) to inhibit RNases activity.
39
Table 3.7 Genes selected for methylation pattern analysis with sodium bisulfite.
Genes were selected according to their methylation status in both staged analyzed, based on the data from the MBD-seq (section 3.4).
46
Table 3.8 Reaction mix for the sodium bisulfite treatment of gDNA from the
Epitec® Bisulfite kit. Bisulfite Mix and DNA protect buffer were provided in the kit. * Combined volume of DNA and water should not be over 20 l.
47
Table 3.9 Thermal cycler conditions, temperatures and step durations, for the
bisulfite conversion using the Epitec® Bisulfite kit, for a final reaction volume of 140 l.
Table 3.10 Primer sequences of the specific primers for amplification of gene
fragments of the selected genes for analysis of methylation pattern and expected size of amplicon (bp). Primers were designed with MethPrimer for amplicon size 400 ± 100 bp.
50
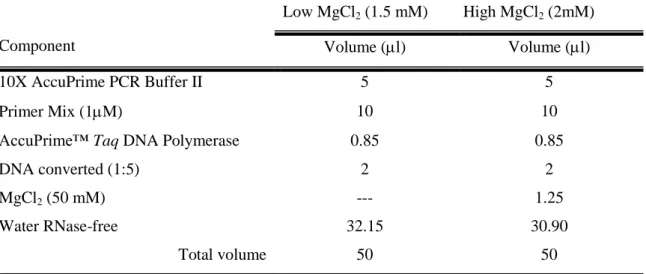
Table 3.11 Conditions, in respect to MgCl2 concentrations, to be used for
amplification of the different genes.
51 Table 3.12 PCR reaction mix for amplification of gene fragments in MgCl
2
stringent and less stringent conditions (1.5 mM and 2 mM of MgCl2,
respectively) for a final volume of 50 l.
52
Table 3.13 Temperatures of annealing (Ta) for the amplification of the fragments
of the different genes by PCR reactions.
52
Table 3.14 Cycling conditions for the PCR reactions for amplification of
fragments of the different target genes after sodium bisulfate treatment. Ta specific for each pair of primers are presented on table 3.13.
vi. Table of contents
Page
i. Abstract……….. i
ii. Resumo……… ii
iii. List of Abbreviations .……… iv
iv. List of images………. viii
v. List of tables……… xiv
vi. Table of contents………. xvi
1. Introduction ……… 1
1.1 Small Intestine ……….. 1
1.1.1 Adult small intestine………. 1
1.1.2 Small intestine in embryos……… 5
1.2 Stem cells……….. 6
1.2.1 Stem cells in adult small intestine………. 7
1.2.1.1 Stem cell markers………. 9
1.2.1.2 Stem cell niche………. 10
1.3 Cell differentiation/specification………... 11
1.3.1 Wnt/-catenin pathway………. 12
1.3.2 Notch pathway……….. 13
1.3.3 BMP pathway……… 16
1.3.5 Eph/ephrin pathway……….. 18 1.4 Epigenetics……… 20 1.4.1 Epigenetic modifications……….. 21 1.4.1.1 DNA methylation………. 21 1.4.1.2 Histone modifications………... 22 1.4.1.3 MicroRNAs……….. 23 2. Objective………. 24 2.1 Project Background………... 24 2.2 Goal………... 25 3. Methodology……….. 26 3.1 Sampling……… 26 3.2 Histochemistry……….. 27 3.2.1 Tissue processing……….. 28 3.2.2 In-situ hybridization……….. 29 3.2.2.1 Fragment amplification……… 29 3.2.2.1.1 Primer design………... 30 3.2.2.1.2 Amplification conditions………. 31 3.2.2.2 Fragment purification……….. 32 3.2.2.3 Cloning………. 33
3.2.2.4 Transformation of competent cells……….. 34
3.2.2.6 Midiprep………... 36
3.2.2.7 pDNA digestion……… 37
3.2.2.8 Reverse transcription and probe purification………... 38 3.2.2.9 In-situ hybridization of slides………... 39
3.3 Isolation of intestinal stem cells………... 41
3.3.1 Isolation of adult ISC……… 41
3.3.2 Isolation of embryonic ISC………... 43
3.3.3 Isolation of adult enterocytes……… 43
3.4 MBD-seq………... 44
3.5 Bisulfite sequencing……….. 45
3.5.1 Extraction and purification of gDNA………... 46
3.5.2 Sodium bisulfate treatment………... 47
3.5.3 Target amplification……….. 49 3.5.3.1 Primer design……… 49 3.5.3.2 PCR conditions………. 51 4. Results………. 54 4.1 Sampling……… 54 4.2 In-situ hybridization……….. 55 4.2.1 Fragment amplification………. 55 4.2.2 Reverse transcription……… 56 4.2.3 ISH on slides………. 58
4.3 Isolation of intestinal cells……… 69 4.3.1 Isolation of adult ISCs and AE………. 69 4.3.2 Isolation of embryonic ISCs………. 71
4.4 Bisulfite sequencing……….. 73 5. Discussion……… 85 5.1 Future perspectives……… 89 6. Conclusion……… 91 7. Bibliography………. 92 Anexes
1. Introduction
Biological systems are in constant search of a homeostatic state. This is the state that offers the best conditions in order for the events needed to sustain life occur in a optimal manner. There are many ways that a system can regulate itself to maintain its homeostatic state while keeping up with the always changing environment. This can include adjustments to pH fluctuations, increase or decrease of secretions for pathogen elimination, just to mention a few. Even the constant renewal of cells in a tissue is important to assure a proper function.
A tissue where cell renewal is a constant is the small intestine. In this structure, the epithelium is the most vigorously self-renewing tissue of adult mammals. The harsh conditions to which the tissue is subjected are the reasons for it1,2.
1.1
Small Intestine
The small intestine is a highly organized tissue that serve a broad array of functions that are mainly absorptive and protective3,4. For the most part of the embryonic development the gut goes through a series of changes. Throughout the different stages, the small intestine accompanies the body’s development, continuing until it reaches maturity. While doing so, the gut acquires its final structure the cells lining it start to differentiate and to acquire their final identity4.
1.1.1 Adult small intestine
The simplest representation of the adult intestinal tract is a tube with a wall composed of three different layers5 (Fig 1.1 a), each with its own function and characteristics. The
outer layer, formed by several sheets of smooth muscle and by the enteric nervous system ensures the peristaltic movements of the intestine. Connective tissue with numerous blood and lymph vessels, nerve fibers and cells of the immune system makeup the middle layer while the most inner layer, the mucosa, consist of a simple epithelium responsible by digestion and absorption of approximately 95 % of nutrients2,5,6.
The small intestine tube structure is also complemented with a three dimensional structure characteristic of the lumen. The presence of finger-like protrusions – villi – surrounded in the base by multiple invaginations – crypts of Lieberkühn – increases the surface area of the gut2,5-7 (Fig 1.1 b). As a consequence, the small intestine is the biggest surface between the inside and the outside of the body. Although permeable to nutrients and other molecules, it blocks the passage of harmful antigens, bacteria or macromolecules6,8. Function of the mucosa epithelium is ensured by a variety of differentiated cells populating it2,3,9.
Fig 1. 1: Structure of the adult small intestine in mammals. The small intestine, in its simplest form as a tube with several tissue layers surrounding the lumen (a). In the interior of this structure the villus cover the internal layer as they project towards the lumen as they are surrounded by the crypts of Lieberkühn (b). Image modified from http://www.made4ll.com/anatomy/small-intestine-villi/.
In the villi, three main types of epithelial cells are found: enterocytes, goblet cells and
enteroendocrine cells1 (Fig 1.2). Enterocytes are the most abundant cell type found in the small intestine with their number being higher in the duodenum. The cells are columnar in shape, with a basal nucleus and apical microvilli (that further increase the absorptive surface). Besides being responsible for absorption of nutrients and water by active and passive transport through the epithelium, these cells secrete a cocktail of hydrolytic enzymes into the lumen2,5,9-11. Second most abundant cell in the small intestine epithelium are the Goblet (or mucosecreting) cells that are found scattered from the middle of the crypt up to the tip of the villus. They are characterized by having mucigen granules in their cytoplasm, that will be released into the intestinal lumen for lubrication and protection of the mucosa and are found in a higher number in the distal region of the gut2,3,5,9,10. The third type of differentiated cell lining the villi are the enteroendocrine. They comprise less than 1% of the total epithelial cells and are distributed evenly along the small intestine. Enteroendocrine cells contain numerous dense granules containing the secreted peptide hormones, that include serotonine, secretine, and substance P, that will control gut physiology1,5,9,10,12.
The rapid self-renewal of the epithelium is orchestrated by the proliferative compartment, the intestinal crypts. Here, adult stem cells and Transit amplifying (TA)
cells will proliferate continuously, generating 250 new epithelial cells per day (Fig 1.2).
They migrate upwards from the bottom of the crypts up to the crypt-villus junction, differentiating along the passage. Cells, that now are completely differentiated, continue to migrate upward from the junction until they are exfoliated at the tip of the villus2,6,8,10,13,14.
The differentiated cells of the epithelium found in the villi, carry out their function of nutrient absorption even though regularly exposed to extremely harsh external conditions. Constant attacks of chemical, mechanic or pathogenic nature requires a high cellular turnover for the villi to maintain its functions. This means a complete epithelium renewal every 3-5 days7.
A forth type of differentiated epithelial cell, Paneth cells (Fig 1.2), are only found in the proliferative compartment. In the bottom of the intestinal crypts, Paneth are columnar cells with of large secretory granules in the cytoplasm. In the granules, specific proteins such as lysozymes, defensins and small molecular weight proteins with
antibacterial function, can be found. All these factors together with the fact that Paneth cells have phagocytic properties are strong indicators that these cells have a role in immunity1,2,9,10.
Fig 1. 2: Representation of the crypt-villus axis in the small intestine. This structure can be divided into absorptive and proliferative compartments. In the absorptive compartment, the fully differentiated cells (enterocytes, goblet and enteroendocrine cells) carryout the absorptive functions of the small intestine. In the second compartment, stem cells and transit amplifying cells divide in order to feeding the renewal of the epithelial cells in the villus15.
In summary, the small intestine epithelium is a very dynamic tissue. The four main cell types are classified into absorptive – enterocytes – or secretory – goblet, enteroendocrine and paneth, according to their characteristics1. This lining is a very specialized barrier protecting the organism from external aggressions resulting in the need for a high rate of cell turnover. Fuelling cell renewal are the crypts where 250 cells are produced and differentiate every day in each crypt. To reach this dynamic state, the intestine goes through several developmental stages as it differentiates from the embryonic endoderm4.
1.1.2
Small intestine in embryos
In the early developmental stages of vertebrate embryos three primary germ layers, endoderm, mesoderm and ectoderm arise after gastrulation4,16. Formation of the primitive gut tube starts with endoderm closure in the anterior and posterior intestinal portals continuing toward the middle of the embryo, fusing around embryonic day 8.5 (e8.5) to e9.011,17 (Fig 1.3) . Simultaneously with gut tube formation, the epithelium elongates along the anterior-posterior axis and undergoes the patterning of the foregut at the anterior region, midgut and hindgut4,11 at the posterior end of the gut tube. From these regions, the endoderm derived organs will develop by local swelling, budding or coilling18. Foregut will differentiate into thyroid, esophagus, lungs, stomach, pancreas, liver, gall bladder and duodenum while the mid and hindgut give rise to the small and large intestines, respectively11.
Fig 1. 3: Representation of mouse intestinal development in embryo. From e8.0 to e8.5 the primitive gut tube is formed with endoderm closure (A). Epithelium elongates and forms a pseudo stratified epithelium (B). The primitive gut continues to elongate and at e14.0 the epithelium changes from a thightly packed structure to a columnar organization with intraepithelial cavities starting to form (C). Villus start to emerge at e15 (D) becoming evident at e16.5 (E). From e17, proliferative cells are restricted to the intravillus region – in green (F). Image from Spence et al (2011)4.
Once the gut tube is formed, the simple epithelium condenses into a pseudostratified epithelium at e9.5. Then, and until e13.5, the intestine elongates together with the embryo and both the thickness of the tube walls and the circumference of the lumen increase4,12. At e14 the stratified epithelium reorganizes changing from a tightly packed simple epithelium with the nuclei at several levels to a columnar organization with basal nuclei4. Simultaneously, secondary lumina (or intraepithelial cavities) start to form in deep basal layers of the stratified epithelium while cells from the mesenchyme start to condensate and this layer begins to invaginate to form the nascent villi4,12. Villus emergence is evident in mouse at e15 and progress in a rostral-caudal orientation. At this point cell proliferation occurs along the epithelium, reducing as the embryo develops. Cells proliferate and differentiate into one of the four main types enterocytes, goblet cells, enteroendocrine cell and tuft cells4. At e17 proliferating cells are restricted to the intervillus region12 where they remain until the small intestine continues to develop in the postnatal period when crypts develop12, hosting the proliferative compartment and the stem cells that fuel it (Fig 1.3).
1.2 Stem cells
The ability to self renewal and to be progenitors of all the body’s differentiated cells are features that are used to describe stem cells19,20.
Stem cells are present throughout the different developmental stages of an organism into and during the adult life. Embryonic stem cells (ESC) as the name indicate, are found in the embryos and are classified as pluripotent, as they can give rise to all body lineages21. Adult stem cells, found in adult, fully differentiated tissues, are classified as multipotent. This classification is due to the fact that, adult stem cells can only self-renew and differentiate into the different cells of the specific tissue from which they were isolated19,21.
1.2.1
Stem cells in adult small intestine
As mentioned in section 1.1.1, the harsh conditions of the intestinal lumen require a high cellular turnover for homeostasis maintenance. There are two key “elements” for the successful cell renewal of the intestinal epithelium: adult stem cells, or intestinal
stem cells (ISC), and TA cells.The ISC are confined to the bottom of the intestinal
crypts and are responsible for continuously providing cells for epithelial renewal. While differentiating into one of the intestinal cell lineages, ISC have to keep their population thus maintaining the proliferative compartment functional10. So far, two models have been presented to explain this balance. One of the models, the Deterministic model, suggests that individual stem cells divide asymmetrically; one of the daughter cells is kept at the bottom of the crypt as a stem cell, contributing for ISC population maintenance, while the other migrates into the proliferative zone, becoming a TA cell10,22. The Stochastic model, on the other hand, hypothesize that stem cells divide symmetrically and stay at the bottom of the crypt as stem cells; as stem cells continue to divide giving rise to two stem cells they are eventually pushed out of the bottom of the crypt and consequently become TA cells10,23.
It has been reported that stem cells divide every 24 hours and that there are approximately 10 to 15 stem cells at the bottom of each crypt22. With this rates of cell division it would not be possible for the ISC per se to give rise to up 300 cells per day5. Once the stem cells leave the bottom of the crypt they pass into the proliferative zone becoming TA cells. The higher division rate these cells present, with cycles every 12 to 16 hours ensure the high number of cells necessary for the epithelium self-renewal and will migrate upwards the crypt walls5,22. While doing so, TA cells undergo up to six rounds of cell division and start to commit to one of the cell types, until they exit the crypt fully differentiated 2,5.
Fig 1. 4: Intestinal stem cells of the small intestine. The specific location of the stems cells is a topic of some discussion with two stem cell populations reported to be present in the bottom of the crypt – crypt base columnar (CBC) cells and the +4 cells. Image from7.
Although it has been known that the ISC are located in the bottom of the crypt, their specific localization in the crypt has been a topic of some discussion. Two stem cell populations have been reported to be present at the bottom of the crypt, the crypt base
columnar (CBC) cells and the label-retaining +4 cells24 (Fig 1.4). Behind the description of these two different stem cell populations are the findings of Cheng and Leblond (1974) in respect to the stem cell model and the works from Cairnie et al and Potten et al (1974) for the +4 model7.
While performing electron microscopy studies in the crypts of the small intestine, Cheng and Leblond found that other cells beside Paneth populate the bottom of the intestinal crypts2. They found slender, immature, cycling cells lodged between the Paneth cells that were named CBC cells24,25. Another characteristic of this type of cells is that they are sensitive to tritiated-thymidine exposure. In their studies, Cheng and Leblond also accounted that after exposure the surviving CBC cells phagocyted the surrounding damaged cells. In this process radioactive phagossomes appeared in the surviving cells. They were present initially only in the CBC cells and progressively detected in the differentiated cells as cells divided. Such results were interpreted as evidence of stemness of the CBC cells7,25,26. The competing +4 model was initially
proposed when cell tracking experiments predicted that cells in the crypt had a common origin in position 4-5, just above Paneth cells. Additional support to this was given by Potten and colleagues which demonstrated that these cells had desirable stem cells properties. They were found to be sensitive to X and -radiation and to have Deoxyribonucleic Acid (DNA) label retention25. Sensitivity to radiation would avoid potential carcinogenic genetic abnormalities to be passed throughout the daughter cells. Long-term retention of DNA label resulted from the asymmetric DNA segregation whereby the template, “immortal”, strands of DNA were retained by the stem cell in the +4 position, while the newly synthesized DNA strands would be inherited by the daughter cells2,7,25,26.
One of the reasons for the difficulty on the identification of ISCs is the lack of well validated markers for these cells3.
1.2.1.1
Stem cell markers
Differentiated cells in the intestinal epithelium have been well defined morphologically and in terms of molecular markers3. Unlike these differentiated populations, such definite characterization is not yet possible for the ISCs even though an array of markers have been proposed.
Most efforts were focused in the markers for the +4 population until recently when the stem cell zone resurged. This was possible with the identification of the Leucine-rich G protein-coupled receptor 5 (Lgr5)/GPR492. Since its identification, this gene was included in the list of the potential markers in which are included Bmi 1, mTert, Ascl2, Olfm4, Sox9, Musashi-12,26. Nevertheless, Lgr5 is the most promising with given evidence as a ISC marker7.
Lgr5 is a 7 transmembrane G-protein with its expression limited to the CBC cells7. Cells expressing Lgr5 are able to generate all lineages of the intestinal epithelium in-vivo, while in-vitro form self-renewing epithelial organoids similar to the crypt-villus axis, as
reviewed by Lin and Barker (2011)25. In respect to other possible markers identified so far, complementary studies show that none of them is either expressed exclusively in one of the stem cell populations, or when they are, lineage tracing does not support them25.
With different cycling dynamics, radiation sensitivity and response to the signaling pathways Lgr5 and +4 cells can be in fact two different populations that complement each other. The CBC cells with a higher cycling dynamic repopulate the crypts, ensuring the daily renewal of the epithelium and the more quiescent +4 cells act as a “reserve” subpopulation that respond in cases of injury or loss of the active stem cells7
. Nevertheless, with the overlapping expression of Lgr5 with markers associated with +4 population, it has be hypothesized that in fact these two different stem cell populations are the same. In this case the Lgr5+ cells would occasionally acquire +4 characteristics to adapt to changes in the crypt environment24.
1.2.1.2 Stem cell niche
At the bottom of the intestinal crypt, ISC are enclosed in the stem cells niche. This space provides ISC a very specific and dynamic microenvironment that is responsive to environmental signals15,20.
Beside the ISC, several cell types compose the niche. Epithelial, mesenchymal and smooth muscle cells, basement membrane and macrophages are part of the cellular structure, each contributing in a specific manner15,27,28. Myofibroblasts and mesenchymal cells, due to their presence in the adjacent lamina propria are in a location that allows them to regulate cell behavior in the niche through the action of soluble and cell associated factors such as growth factors and cytokines15,27. With the combination of this factors ISC are regulated in order to maintain their own population, to proliferate giving rise to the differentiated progeny or even to respond against any perturbations allowing tissue recovery29.
Small intestine crypts and villi and the diverse cell composition create different regions along the gastrointestinal (GI) tract tightly controlled by a complex interplay of the major signaling pathways8.
1.2
Cell differentiation/specification
The combination of the environmental factors available for niche and crypt control build a complex signaling network comprising Wnt/-catenin, Bone Morphogenetic Protein (BMP), Hedgehog (Hh) and Notch pathways27,29, to name a few (Fig 1.5).
Fig 1. 5: Several secreted factors regulate ISCs and distribution of the TA and differentiated cells. The Wnt/b-catenin pathway is expressed in a reciprocal gradient to the BMP and Hh pathways along the crypt-villus axis, with these last two inhibit the Wnt signaling. Notch expression is higher at the bottom of the crypt and as it gradually decreases towards the villi, ISCs differentiate into the secretory lineage27.
1.3.1 Wnt/-catenin pathway
Signaling of Wnt/-catenin pathway has effects on cell proliferation, cell survival, cell polarity and even cell fate determination30. Signaling is ensured by Wnt ligands, a family of secreted glycoproteins evolutionally conserved, found in vertebrates and invertebrates27,31. Generally these molecules have approximately 350 aminoacids (aa) with a correspondent molecular weight of ~40KDa and are involved in two major pathways30,31.
Fig 1. 6: Schematic representation of the canonical Wnt/b-catenin pathway. In the presence of Wnt ligands the ubiquitination of b-catenin is blocked and b-catenin translocates into the nucleus. The expression of Wnt dependet genes is induced31.
The pathways activated by the Wnt ligand are known as canonical (-catenin dependent) and non-canonical (-catenin independent)30. In the canonical pathway (Fig 1.6), activation occurs when a Wnt ligand binds to the seven-transmembrane Frizzled (Fz) receptor and its co-receptor Low-density lipoprotein receptor-related protein 6 (LRP6) or its close relative LRP58,32. In the absence of the activation signal, -catenin in the cytoplasm is inactive and it easily captured by the destruction complex formed by Axin, adenomatous polyposis coli (APC), casein kinase 1 (CK1) and glycogen synthase kinase 3 (GSK3)8. CK1 and GSK3 phosphorylate -catenin in the N-terminal region signaling it for ubiquitination preceded by proteasomal degradation. catenin is prevented to reach the nucleus thus repressing Wnt target genes32,33. In the presence of Wnt ligands the Wnt-Fz-LRP6 complex formed recruits the intracellular protein Dishevelled (Dvl)32. The LRP6 intracellular tail is phosphorilated by Dvl and Axin is recruited to this site inhibiting -catenin ubiquitination33. -catenin accumulates in the cytoplasm and translocates into the nucleus where it induces the expression of Wnt dependent genes by activating the transcription factors of the T-cell factor/lymphoid enhancer factor 1 (TCF/LEF-1) family31,33.
In the less studied non-canonical Wnt pathways, Wnt ligand activates the intracellular signaling cascade independently of the LRP5/630. Activation of cJun-N-terminal kinase pathway or Ca2+-dependent pathways occur for the regulation of cell polarity or cell adhesion and motility30,31.
In the adult small intestine, Wnt/-catenin is essential for ISC maintenance, proliferation and compartmentalization of the crypt and differentiation zones of the epithelium4,34. The Wnt ligands secreted by the myofibroblasts at the basement membrane of basal crypt epithelium creates a signaling gradient of Wnt/-catenin pathway along the crypt-villus axis, stronger at the bottom of the crypt5,27. Target genes of the Wnt/-catenin pathway include c-myc, involved in cell proliferation, EphB2 and EphB3, controlling segregation that occurs in the crypt, Sox9, a regulator of Paneth cell differentiation, and Lgr527, a cellular receptor for the enhancement of Wnt signaling being itself controlled by the Wnt pathway7,35. For activation of the Lgr5 amplifying system, a exogenous ligand that make part of a small family of R-spondins, binds to the Lgr5 receptors initiating the intracellular signaling cascade7,8,35 amplifying the Wnt/-catenin signaling.
The role of Wnt/-catenin pathway is to be a master regulator of both embryonic development and adult tissue homeostasis. Nevertheless, studies have shown that Wnt signaling is key for the control of cell proliferation while other pathways regulate other processes in tissue homeostasis. Such case is the Notch signaling cascade who’s key role is the suppression of cell fate36.
1.3.2 Notch pathway
Notch pathway signals for the maintenance of the stem cell signaling network, cellular
patterning and cell organization within a tissue4,37,38. Notch is a highly conserved signaling network presenting, in mammals, 4 receptors, Notch 1 to 4, and 5 ligands, Delta-like (Dll) 1, 3 and 4, and Jagged (Jag) 1 and 236,39,40 .
Both Notch receptors and ligands are cell-surface type I single-pass transmembrane proteins with a extracellular domain37,41,42. Activation of the pathway is a short range event through cell-cell interactions between the receptor and the ligand, expressed in the neighboring cells39,40.
Notch (receptor) is a heterodimer at the plasma membrane formed by the Notch extra-cellular domain (NECD) and a membrane-tethered intracellular domain called NTM42. Both domains interact to form the heterodimer through a non-covalent interaction Ca2+ dependent42. For activation of the signaling cascade, the ligands of the DSL family (Delta, Serrate, Lag) establish a strong ligation with the NECD initiating a process involving proteolysis and endocytosis of the receptor37. This ligation cause the complex receptor-ligand to be available for cleavage by extracellular ADAM proteases36,42. The complex is sliced and the ectodomain of Notch is released while a membrane-bound form of Notch, called Notch extracellular truncation (NEXT) is activated. NEXT is further processed through the action of the intramembranous protein complex -secretase36,42. This complex cleaves NEXT at two endomembrane sites resulting in the release of Notch intracellular domain (NICD) to the cytoplasm42. Once in the cytoplasm, NCID translocates to the nucleus were it interacts with the DNA
binding protein CSL family and recruits the coactivator Mastermind initiating the transcription of Notch downstream target genes37,41 (Fig 1.7).
Fig 1. 7: Model for the Nocth signaling pathway. The binding of the DSL family ligands initiate the signaling cascade triggering the transcription of Notch downstream target genes. Image from 41.
Notch downstream target genes often differ among cell types. Nevertheless, the most widely expressed and best characterized target genes of Notch signaling cascade belong to the HES/HEY family. One of the major functions of these proteins is the repression of transcription factors of the Ascheate-scute like 1 and Neurogenin family. Notch has been shown to regulate expression of genes like myc, cyclinD, CDK5 in cell proliferation, or cell cycle inhibitors like p21 in cell types that Notch promotes differentiation39.
In the small intestine of mammalian, due to the characteristics of this tissue, Notch signaling pathway has a dual role39. It controls the differentiation of daughter cells into enterocytes of the absorptive lineage while, together with Wnt pathway, Notch promotes stem cell proliferation3,39,40. In the adult small intestine Notch components are
On the other hand, in the developing intestine, at E13.5 and E18.5 of the mouse, Notch ligands Jag1, Jag2 and Dll1 are predominantly expressed at the mesenchyme40.
1.3.3 BMP pathway
BMPs are a family of conserved growth factors and form the largest subgroup of the Transcription Growth Factor Beta (TGF) superfamily43,44. They are synthesized as large 400-500 aa precursors and are cleaved into 50-100 aa active proteins with seven cysteins, of which 6 will form 3 intramolecular disulfide bonds43,45. The remaining cysteine is key for dimerization with another monomer, forming a covalent disulfite bond between both molecules producing homo or heterodimers43.
The role of BMPs is very wide. During embryonic development they influence gastrulation, neurogenesis, apoptosis and hematopoiesis45. In adult, these proteins are involved in homeostasis maintenance participating in tissue remodeling and regeneration regulating stem cell properties46.
The BMP canonical signaling pathway functions through a receptor mediated intracellular signaling46. The signaling cascade is initiated when the extracellular BMP ligands bind to the receptor47. BMP receptors are formed by type I and type II receptors in such way that different combinations of the type II with one of the three type I receptors may determine the receptors specificity46. When BMPs bind to the receptors, it is presumed that a conformational alteration of the type II receptor occurs thus activating, by cross-phosphorylation, type I receptor43-45. In turn, the active type I receptor transiently associate with receptor-activated Smads (R-Smads, Smad1/5/8) phosphorylating and activating it45,47. R-Smads are quickly released from the receptor and interact with the common-mediator Smads (Co-Smads, Smad4). Two R-Smads and one Co-Smad form a complex that translocates from the cytoplasm into the nucleus modulating the transcription of target genes44,46.
Although not as well studied as the Smad-dependent pathway, BMPs are able to initiate other pathways such as extracellular signal-regulated kinase (ERK), map kinase p38,
C-jun N-terminal kinase (JNK), and nuclear factor kappa beta (NFB). Through these pathways, BMPs are involved in cell survival, apoptosis, migration and differentiation43. In the small intestine several pathways are involved in the regulation of stem cell self-renewal with each cascade playing either different or overlapping roles46. In the case of the BMP pathway, this is involved the regulation of stem cell proliferation by inhibiting it27. The BMP ligands 2 and 4 mainly synthesized and released by the cells of the intervillus mesenchyme at the villus tips. They decrease in number towards the crypt and BMP receptors found along the villus epithelium13,27 BMP signaling overlaps with Hh and Wnt pathways13,27. By mediating the action of the Hh pathway formation of ectopic crypts is avoided, thus restricting crypt numbers, while, by suppressing Wnt cascade signaling stem cell, self-renewal is balanced13,27.
1.3.4 Hh pathway
The Hh proteins provide a critical signal for the proper embryonic development to occur48. During these critical developmental stages, Hh proteins are involved in the patterning of the neural tube, lung, skin, axial skeleton as well as the GI tract48. In the adult tissues, on the other hand, Hh are still present even though only involved in stem cell maintenance, proliferation and differentiation48,49.
In mammals there are 3 members of the Hh family: Sonic Hedgehog (Shh), Indian Hedgehog (Ihh) and Desert Hedgehog (Dhh)50. They are synthesized as precursor proteins of about 45 kilodalton (kDa) that undergo autocleavage yielding an amino-terminal polypeptide and a carboxy-amino-terminal polypeptide51,52. The N-terminal polypeptide, now with about 19 kDa, is modified with a cholesterol molecule added in the C-terminus and a molecule of palmitic acid at the N-terminus48,52. With this dual lipid modification, Hh proteins have their membrane association enhanced also affecting their secretion and action range52. This culminates with the secretion of the Hh proteins from the cell through the activity of the multipass transmembrane protein Dispatched (Disp)52.
Until the Hh ligands binds to Patched (Ptch), a 12-span transmembrane protein receptor, the Hh cytoplasmatic signaling cascade is inhibited by the repression of another transmembrane protein, Smoothened (Smo)50,53. When a Hh ligand associates with the receptor Ptch, this complex is internalized resulting in the loss of activity of Ptch and Smo repression ends, initiating the signaling49,51.
The de-repressed Smo signals for the activation of STK36 serine/threonine kinase53. In turn, the formation of the GLI degradation complex is inhibited, preventing the phosphorylation of the glioma-associated (Gli) family proteins (Gli 1 to 3) by the complex and consequent ubiquitination and degradation50,53. Proteins of the Gli family are zinc finger transcription factors that when are not degraded translocate to the nucleus regulating the transcription of genes such as Gli1, Ptch1, CCND2, FOXL1, and JAG250,53.
In the small intestine, the relevance of Hh pathway starts very early, being critical for the normal development and for the establishment of villus and crypts. During the development of the mouse embryo, the epithelium expresses Shh and Ihh, signaling for the receptors in the mesenchyme13,54. As the intestine develops, the expression of these ligands becomes restricted to the intervillus regions13. In the adult small intestine, expression of Shh and Ihh is maintained in the regions that derive from the intervillus regions – the crypts, where proliferation is present13. Its presence here is of great importance for the inhibition of the Wnt canonical pathway, thus regulating stem cell proliferation in the crypts52,53. Also, Hh pathway signals for the regulation of the BMP pathway controlling the crypt population52.
1.3.5 Eph/ephrin pathway
Erythropoietin-producing hepatocellular (Eph) receptors are type-I transmembrane protein and, together with its ligands, comprise the largest subfamily of receptor tyrosine kinase (RTK) with 14 members55-57.
Relevance of Eph receptors in homeostasis maintenance can be noted by the biological activities they have been implicated so far. Eph receptors are reported to have effects on
actin cytoskeleton, cell-substrate adhesion, cell shape and cell movement, as well as cell proliferation, survival, differentiation and secretion58,59.
The extracellular domain of the receptor (N-terminal) contain a high affinity binding site for interaction with the ligands, Eph receptor interacting proteins (ephrins)58. Ephrins are, in turn, also cell surface-bound proteins that, due to structural differences are divided in two classes: class A, anchored to the plasma membrane through a glycosylphosphatidylinositol (GPI); and class B, are transmembrane proteins with a small cytoplasmatic tail56,60. When the ephrins bind to the respective receptor, phosphorylation of the kinase domains occur, at the intracellular region57,60. Conformation of the receptors and ligands occur as well as multimerization and clustering and the active kinase phosphorylates other molecules triggering the downstream cascade57,60.
One of the major distinctive characteristic of the Eph/ephrin signaling is the generation of bidirectional signaling: both receptors and ligands are able to transduce a signaling cascade activated upon receptor-ligand biding56,58. This property, together with the multimerization of the Eph/ephrin complex result in its biological roles60. As the Eph receptors phosphorylate downstream molecules, in turn signal through a wide set of pathways. The cascades that are activated include H-Ras and MAP kinase pathway (transcription regulation, proliferation and cell migration), Jak/Sak pathway and PI3K pathway (promoting proliferation)60. This highlights how the Eph/ephrin is a part of a very complex network of signaling cascades56.
In the small intestine, epithelial homeostasis is mainly regulated by the Wnt pathway, in part by controlling the balance in the expression of Eph receptors and ligands. As the TA cells migrate, they move away from the Wnt signaling, consequently, EphB expression decreases and ephrin-B expression increases58.
As described in the previous sections, signaling pathways are key for the maintenance of tissue homeostasis, ensuring that stem cells are maintained, proliferate and differentiate in a orderly manner. It is important to note that some of these pathways begin to be expressed at early developmental stages. In doing so, they contribute to the correct development of the animal.