The aim of this paper is to present and discuss the results obtained with a methodology used to characterize the concrete and to evaluate the structural safety against fatigue of the reinforced concrete bridge number 50A located in the Carajás railroad. An “in situ” inspection was carried out in order to assess the evolution of damage in structural elements, with reference to information available in existing projects, calculation memory and reporting of previous inspections. Extractions of concrete testimonies, alkalinity tests, sclerometry, pacometry and laboratory tests were also performed to characterize the materials mechanically and estimate the structural behavior of the bridge under higher future loads.
Keywords: bridge, structural monitoring, reinforced concrete.
O foco principal deste trabalho é apresentar e discutir os resultados obtidos com a metodologia utilizada para caracterização mecânica do concre-to e avaliação da segurança estrutural à fadiga da ponte número 50A, em concreconcre-to armado, localizada na estrada de ferro Carajás. Foi realizada uma inspeção “in loco” com o objetivo de avaliar a evolução dos danos nos elementos estruturais, usando como referência informações disponibi-lizadas em projetos existentes, memorial descritivo de cálculo e relatórios de inspeções anteriores. Foram readisponibi-lizadas extrações de testemunhos, ensaios de alcalinidade, esclerometria, pacometria e ensaios laboratoriais que permitiram caracterizar mecanicamente os materiais e estimar o comportamento estrutural da obra de arte sob carregamentos futuros maiores.
Palavras-chave: ponte, monitoramento estrutural, concreto armado.
Vida útil à fadiga de uma ponte ferroviária na estrada
de ferro Carajás
R. R. F. SANTOS a [email protected]
D. R. C. OLIVEIRA b [email protected]
a Universidade Federal do Pará, Programa de Pós-Graduação em Engenharia Civil, [email protected], Rua Augusto Corrêa, nº 01, bairro Guamá,
Belém, Brasil;
b Universidade Federal do Pará, Programa de Pós-Graduação em Engenharia Civil, [email protected], Rua Augusto Corrêa, nº 01, bairro Guamá, Belém, Brasil.
Abstract
1. Introduction
The bridge over the river Mãe Maria is located in the city of Marabá, Pará state, and is part of the Carajás Railroad (EFC). It is used to allow iron ore transport from Carajás, a city in Pará yet, to Itaqui harbor in São Luis city, state of Maranhão. Due to the need for load increasing, which currently is 320 kN to 400 kN per axle, studies focused on the new behavior of the structure are of extreme impor-tance for the service life of this bridge.
1.1 Structural system description
The studied bridge is a straight line structure located along the Carajás Railroad crossing the river Mãe Maria, identified as OAE 50A. Built in reinforced concrete, cast “in situ”, the OAE has two hyperstatic spans, totaling 64.20m, crossing the bed of the river with two spans of 20.00 m providing a cross section width of 5.85 m. On the deck slab is the rail
line superstructure for passage of trains. Safety on the OAE is guaranteed with the presence of refuges and metal railings as shown in Figure 1.
The superstructure is slab on beams type. The deck consists of four spans of continuous stringers of “pi” cross section, with linear variation of the web thickness from 0.35mto 0.70 m near the supports and block B2, as shown in Figure 2, stiffened by transversal beams (second-ary) on charted neoprene sup-port devices at the abutmentE1 and block B2. The beams are embedded in the abutment E2.
ments, blocks and reinforced concrete caissons cast “in situ”.
1.2 Dynamic loads
The fleet of locomotives and wagons currently in operation for transporting ore in the EFC is composed mostly of locomotives DASH9 which represents almost 30% of the total fleet, as shown in Table 1, and GDT wagons that represent about90% of the fleet. Basically two types of compositions are applied, being one com-posed by two front locomotives followed by 104 wagons, plus one intermediate locomotive and more 104 wagons, which corre-sponds to 80% of the fleet in operation. There are situations where the position of the intermediate locomotive varies and may stay at the end of the composition. The other composition uses three front locomotives pulling 208 wagons. Figure 4 shows the longitudinal distances considered for locomotives and wagons.
In the future, the EFC will be loaded by new trains-types, with a greater number of wag-ons and individual load higher than the present. It is intended to work with two models, where the basic difference is the num-ber of locomotives between the wagons. In the first situation there are 2 locomotives + 110 wagons + 1 locomotive + 110 wagons + 1 locomotive + 110 wagons. On the second, the configuration is 2 locomotives +110 wagons + 2 locomotives + 220 wagons. Table 2 shows the loads for the current and future operational trains-types considering GDT wagons and DASH9 locomotives.
Figur�������ri�g�����r�����ri��r�������ri�
Figure � � (a) bridge's cross section (meters); (b) linear variation of the stringers' width close to supports
with the geometric and structural information from the projective documents.
In relation to the visual inspection of the stringers and crossbeams were observed discrete increases in lengths of the cracks in the stringers, when compared with those shown in the cracking maps shown in previous reports. Although agreeing with Cánovas [1]
1.3 Documents analysis and preliminary inspection
To evaluate the current state of the structure is necessary to con-sider a set of actions which bring together enough information. This information set came from a data analysis and reports already made by specialized companies, along with visual inspections of the bridge. Were consulted documents related to existing projects, descriptive history calculation and reports that describe changes in pathological conditions, as well as the preventive measures taken, and a preliminary qualitative evaluation of the current state of the bridge was done. It was found that the structure is in accordance
Figure � � �tru�tura� ���te� o� the �ri�ge
over the river Mãe Maria
Ta�le � � �perational locomotives and �agons details (Source: Vale)
Locomotives technical characteristics - EFC
Situation in April/2007
Fleet
Model
Total Pot. (HP)
Liq. Pot. (HP)
Engine
Amt.
Manuf. year
GE
C36-7B (DASH-7)
3.600
3.600
7FDL16G60
39
1984/1987
GE
C40(DASH-8)
4.000
4.000
7FDL16K10
4
1989
GE
C44CW (DASH-9)
4.400
4.374
7FDL16n50
55
1997/2001
GE
C-SL65
600
600
NTA855
1
1993
GM
SD40-2
3.000
3.000
16-645 E3C
27
1984/1987
GM
SD60M
3.800
3.800
16-710 G3A
2
1992
GM
SD70M
4.300
4.300
16-710 G3C
55
2001
Locomotive fleet in operation: 183
Figure � � Details o� t�e D����
locomotives and GDT wagons
Ta�le � � Load� from operational and future train type
Situation
Locomotive DASH9
Loaded GDT wagon
Unloaded GDT wagon
Current
300 kN/axis (1800 kN)
325 kN/axis (1300 kN)
52,5 kN/axis (210 kN)
rescence and infiltration, as shown in Figure 6. In the transition slab were not observed gaps, being therefore in satisfactory conditions. The design of the structure according to the available information in the calculation history was performed using the compressive strength of concrete corresponding to 18.0 MPa. For the founda -tions, was admitted concrete with compressive strength of 15.0 MPa and land with admissible stress of 0.8 MPa. The criteria used were based on the NBR 6118 : 1978 [3] to be the design code at the time of preparation of the project.
In this last inspection were inspected areas of the upper face (0.3 mx 0.3 m), where it was possible to remove the gravel ballast, and bottom face of the deck slab with the aid of a stair, as shown on Figure 7, and the existence of cracks was not verified on these surfaces. In Figure 8, it can be seen that the support devices of the abutment E1 shows no visible abnormalities, only natural strains that the progression of cracking is an indication of symptomatic
occurrence of a defect, it is believed that in this case, the cracks are the result of shrinkage of the concrete at early ages and that the differences could be related to the methodologies of measure-ment of these lengths. Efflorescence due to the dissolution of the compounds of the cement paste were also observed, according to Cascudo [2], infiltration, surface segregation and insufficient rein -forcement coatings in concrete beams. On the crossbeams were also observed efflorescence and moisture stains. Generally, the stringers and crossbeams have satisfactory integrity, as shown in Figure 5.
During the inspection of the deck a heavy cracking pattern with ef-florescence was noticed. On the stringers the presence of short or damaged drains led to the occurrence of moisture stains. Already on the side cantilevers were observed cracks with and without efflo
-Figur�������u���r��������������i���ru������i������������ri�g�r
Figure � � �ater infiltration and
due to usage and dirt. Other support devices are under similar conditions to the support device of the abutment E1, but still suit-able for use.
2. Concrete characterization
2.1 Non-destructive tests
Non-destructive tests (NDT) include various methods of analysis of materials, components and connections in order to identify and quantify internal defects and degradations. The NDT main goal is to enable evaluation of the materials properties before any failure occurs, basing such evaluation on recognized criteria for accep-tance or degradation profiles defined over years of experience, so that the quality and performance of these materials in service are ensured. This has generated a growing interest in developing methods for non-destructive testing for concrete structures evalu-ation, according to Mehta [4].
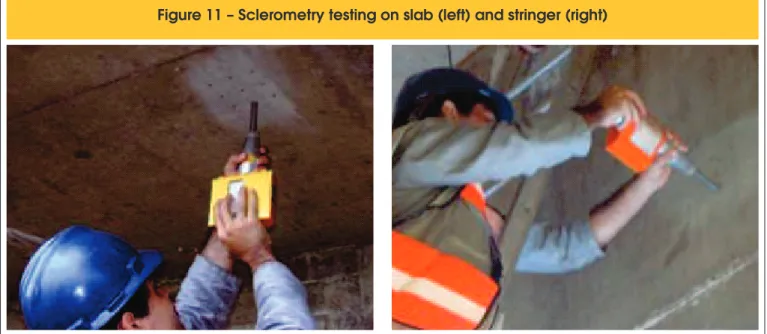
The pacometry test was performed before the sclerometry tests to determine the position of steel bars for both the sclerometry tests and for instrumentation of the reinforcements with strain gages (EER). In this investigation a pacometer was used and its operating principle is electromagnetic, to determine the presence and direc-tion of the bars, as well as to determine the thickness of the con-crete coatings in relation to the external surface of the bars. Figure 9 shows the pacometry testing on caisson T7 and, in Figure 10, on a stringer. The spacing between bars varied from 0.05 m to 0.11 m. Pacometry tests were also carried out on the deck slab for steel bars detection to avoid damage during the testimony extractions. The sclerometry tests were performed on all structural elements of the bridge. This method basically consists in evaluating the su-perficial hardness of the hardened concrete using a device which measures the energy of impact on the reflection surface. The method known as “rebound hammer method” provides an index (denominated sclerometric index) having direct correlation with the compressive strength of concrete. However, there are several
Figur�������u���r�����i������������u��������
Figur�������������r������i�g������i�������
studies that point to other factors that affect these correlations out-lined by the calibration curves. According to Evangelista [5] factors as the amount of cement, aggregate nature, maturity and moisture content, carbonation and surface finish, can increased propagation of errors in the results. The concrete strength was estimated based on the arithmetic average of the resistances of nine points of each study area (0.10 mx 0.10 m), according to NBR 7584 : 1995 [6]. Figure 11 shows the application of sclerometer and arrangement of the points on the deck slab and stringer.
2.2 Destructive tests
Tests for determining the depth of carbonation in structural
el-ements of the OAE using a solution with the chemical indica-tor phenolphthalein were performed “in situ”. After opening of the windows in 0.05 m thick concrete coating, the tests were conducted in various structural elements and showed that the concrete is at a satisfactory level of alkalinity, with no visible sign of corrosion. Figure 12 shows the final appearance of the concrete after the alkalinity testing (pink color indicates the
Figure �� � ��lerometry testing on slab (left) and stringer (right)
Figure �� � Final as�ect of t�e stringer�s
concrete after alkalinity testing
alkaline concrete with no carbonation).
To determine the mechanical properties of concrete testimony were extracted from the structural elements by using a cutting machine with rotary diamond crown shown in Figure 13. A total of five concrete testimonies, two from the abutments, two from the slab and two beam from the stringer. The testimonies that had flaws in their end faces, due to the extraction process were rectified with the aid of a circular saw, resulting in a final length of 200 mm, as shown in Figure 14. Regarding the tests to de -termine the modulus of elasticity and compressive strength of concrete, the testimonies were tested following the recommen-dations of NBR 8522 : 2003 [7] and NBR 5739 : 1994 [8], where
the first recommended to be realized three cycles of loading and unloading with peaks corresponding to 30% of the failure stress (fc) and 0.5 MPa . For this a servo-controlled machine model PC-200CS, manufacturer EMIC, was used. Tests were then performed with constant load speed rate of 0.25 MPa/s. After the cycles of loading and unloading, a loading was applied progressively until failure by crushing of the testimony. In addi -tion to the strain sensor type “clip gauge”, still from the manufac-turer EMIC, two strain gages acquired from the company Excel Sensors Ltd., Model PA-06-201BA-120L, were installed at half height of the testimony and diametrically opposed. Figure 15 shows details of the tests in the laboratory.
Figure �� � �estimony's length standardization and end surface regularization
Table � � Compressive strength of concrete from sclerometry tests
Impact
Compressive strength f (MPa)
cStringer
Slab
Block
Abutment 1
Abutment 2
Caisson T7
1
60
61
52
56
60
43
2
52
61
48
46
58
46
3
42
61
52
59
59
43
4
54
60
55
60
62
42
5
62
65
54
60
62
47
6
62
61
52
58
62
37
7
56
63
56
50
62
45
8
56
63
54
56
61
42
9
42
63
54
55
59
42
Average
54
62
53
54
61
43
Ta��e � � E�perimenta� mec�anica�
properties of concrete
Testimony
E (GPa)
cf (MPa)
cAbutment 02 (CP01)
38,6
51,5
Abutment 02 (CP02)
42,4
52,3
Slab (CP01)
41,1
39,2
Slab (CP02)
44,0
50,0
Stringer (CP01)
58,8
38,7
3. Concrete mechanical characterization
results
The Schmidt rebound hammer method is simple to use and offers a quick and cheap way to evaluate the uniformity of the hardened concrete “in situ”, so the test result is susceptible to factors such as: concrete mix proportion, age and environmental conditions, surface roughness, moisture condition, surface carbonation, the element stiffness and location of the hammer. The sclerometry av-erage results for the “in situ” studied elements are presented in Table 3.
The results observed with the non-destructive testing of scle-rometry were all higher than those for the testimonies. Accord -ing to Malhotra [9], the accuracy in estimat-ing the strength of
Figure �� � �tress-time and stress-strain diagrams for abutment E2, CP02
Figure 1� � �tress-time and stress-strain diagrams for deck slab, left side, CP01
concrete in laboratorial tests, with a properly calibrated rebound hammer is ± 15% 20%, and in a concrete structure is ± 25%. The measurements of modulus of elasticity of the concrete (Ec) determined experimentally according to NBR 8522 : 2003 [7], are presented in Table 4 together with the resistance to axial compression experimentally determined in accordance with NBR 5739 : 1994 [8 ].
In Figures 16 to 20 it can be seen the result of the configura -tion adopted for the tests as a func-tion of time, where the loads ranged from 0.5 MPa to 30% of the failure stresses estimat -ed for the concrete testimonies according to the current code prescriptions, and the stress-strain diagrams generated as the tests were performed.
4. Structural project analysis according
to codes’ prescriptions
4.1 Dead load effects on the stringers
All permanent loads (corresponding to stringers self-weight,
Figure �� � �tress-time and stress-strain diagrams for the left side stringer
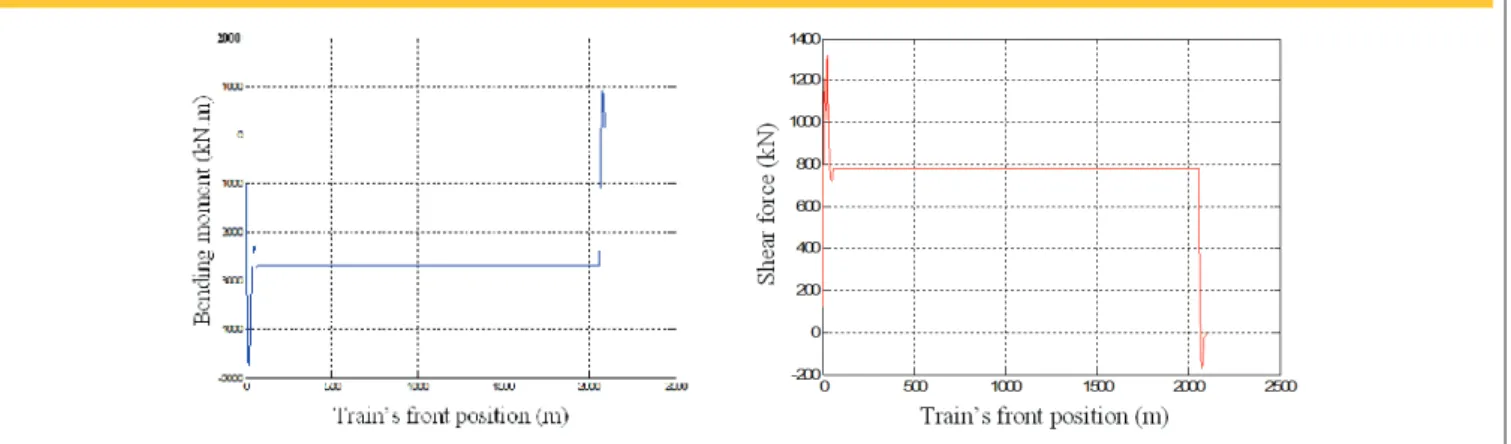
crossbeams, refuges, ballast, rails, accessories, etc.) and dy-namic loads were separately considered, corresponding to the several trains type studied (Cooper E80, operational, loaded, future loaded and unloaded operational train-type). Figure 21 shows, respectively, bending moment and shear force diagrams due to permanent loading from the computational program SAP2000 [10].
4.2 Dynamic loads history
For the determination of the applied loading on the stringers (bend-ing moment and shear) each of the spans was subdivided into ten parts, resulting in 21 sections, as done in the calculation memory. As illustration, the forces’ variation from SAP200 [10] for section 21 is presented, corresponding to the fix point between the deck slab and abutment E2 and considered the most requested section under several trains types passage without permanent loads. The other sections time histories were also obtained, but only their en-velopes are presented. Figures 22 to 25 show the dynamic loading history for several trains.
Figure 22 � �ending �o�ent and shear force history for section S21 under Cooper E80 train type passage
Figure 2� � �ending �o�ent and shear force history for section S21 under loaded operational train type passage
5. Cross sections’ fatigue lifetime
To determine the fatigue lifetime of the stringers was considered, initially, the variation of bending moment due to train operational loaded, future loaded and unloaded. From the variation of bending moment, it is possible to determine the strains and stresses at any point of the cross sections. Figure 26 shows theoretical variations of the strains, respectively, in the concrete and reinforcement of the section S21 due to the passage of the train operational loaded. The coordinates indicated in the legend of the Figure 26a indicate the position (height) of the concrete fiber analyzed in relation to the lower face of the section. According to NBR 6118 : 2003 [11] and Model Code MC90 (CEB-FIP, 1992) [12] should be estimated minimum and maximum stresses in an area not exceeding 300 mm from the edges of the cross section. For this reason, in the fig-ure are shown four curves corresponding to the fibers located 300 mm from the upper and lower edges of the stringer. Since Figure 27 shows respectively the theoretical compression stresses in the
concrete and in the reinforcement of the section S21 due to the passage of the train type operational loaded.
For a preliminary check to fatigue of concrete were considered the prescriptions of NBR 6118 : 2003 [11]. According to this standard, checking the fatigue of concrete is ensured if the maximum com-pressive stress in concrete (corrected for the gradient of compres-sive stress) does not exceed a limit fatigue stress fcd,fad = 0.45 fcd. This check is presented in Figure 28, where the rectified stress is provided in module (with positive sign indicating compression, in this case). Whereas the design compressive strength for the con-crete, i.e. fck = 18 MPa and a safety coefficient γc = 1.4, the fatigue limit stress is fcd,fad = 5.78 MPa. Thus, according to NBR 6118 : 2003 [11], only the stresses arising from the permanent load would already be very close to this limit in section S21. It should be re-marked that this criterion is quite conservative, since it does not consider the stresses variations.
As already mentioned, the section “23.5 Ultimate limit state of fatigue” of NBR 6118 : 2003 [11] is based on the “6.7 Ultimate
Figure 2� � �ending �o�ent and shear force history for section S21 under loaded future train type passage
Ta�le 5 � Res�lts f�r elasticit� m�d�l�s �f c�ncrete
Sample
E experimental (GPa)
cE estimated (GPa)
cDifference (%)
NBR 8522
NBR 6118**
MC90***
NBR6118
MC90
Abutment 02 (CP01)
38,6
40,2
37,2
4,1
3,6
Abutment (CP02)
42,5
40,5
37,3
4,7
12,2
Slab (CP01)
41,0
35,1
33,9
14,3
17,3
Slab (CP02)
44,0
39,6
36,8
10,0
16,3
Stringer L.E* (CP01)
58,8
34,9
33,8
40,6
42,5
* Left side
** E = 5600c fc [MPa]
*** 30,1 f
c [MPa] E = 2,15 10c 4
Figure 2� � Stringer�s strain theoretical variation in section S21 due to passage
of the loaded operational train type on concrete (left) and reinforcement
Figure 2� � Stringer�s stress theoretical variation in section S21 due to passage
of the loaded operational train type on concrete (left) and reinforcement
limit state of fatigue” of Model Code MC90 (CEB-FIP, 1992) [12], which sequentially presents three methods for design verification with increasing levels of refinement and precision. To verify the fatigue of concrete, the NBR 6118 : 2003 [11] brings only the most simple and therefore more conservative method. Moreover, the Model Code MC90 (CEB-FIP, 1992) [12] recommends the use of the more simplified as only a preliminary analysis, if the other two methods are not used. For this reason, although the fatigue crite -rion of the NBR 6118 : 2003 [11] have been satisfied for the section in question, was additionally performed a more refined analysis according to Model Code MC90 (CEB-FIP, 1992) [12], and the re-sults of this analysis are described below.
For the use of this more refined method, the actual Model Code MC90 (CEB-FIP, 1992) [12] suggest the use of algorithm Rain Flow for counting cycles. Using this algorithm can be carried out a
perma-loads act. Because of this, the lifetime of the section is 1.33E +07 years approximately, for the operational train, and 7.05E +05 for the future train type.
Must be remarked that these lifetimes were estimated using the specified characteristic strength of concrete in the project (fck =
18 MPa). The other sections were also analyzed for fatigue and the results regarding lifetime are presented in Figure 29 (semi log scale), considering also the fck specified in the project for both operational and future trains. Figure 29 shows that occurs a re-duction in the fatigue lifetime of the sections with the change of loading from operational to future train type. It is also observed that the lifetime of the sections located on the first support is very high (support at the abutment E1, section S1, x = 0 m) which did not occur in the third support sections (section S21, x = 40 m). In section S21 the critical element (suffering greater fatigue damage) is the concrete on the bottom surface. Therefore, based on the results obtained for other bridges already analyzed (bridges over the rivers Mearim, Cajuapara and Rio Vermelho), it is known that the real compressive strength of concrete is much higher than the value specified in the project. Thus, one must be considered the
Figure 28 � �oncrete rectified stress and limit
fatigue stress according to NBR 6118 : 2003 [11]
Ta�le � � �atigue analysis �or stringer�s cross section S21 under operational train type loads
Element
Damage
Loaded train
Unloaded train
Total (pair)
Bottom surface reinforcement
1.09 E-11
5.02 E-13
1.14 E-11
Top surface reinforcement
1.45 E-12
6.46 E-14
1.51 E-12
Bottom surface concrete
5.83 E-13
1.58 E-19
5.83 E-13
Top surface concrete
0.00 E+00
0.00 E+00
0.00 E+00
Section maximum damage
1.14 E-11
Section lifetime in pair of trains
8.77 E+10
Section lifetime in years
1.33 E+07
possibility of extending the fatigue lifetime considering the current value of concrete strength obtained from sclerometry and axial compression tests on concrete testimonies.
6. Conclusions
After tests performed “in situ”, the taken concrete testimonies were tested in laboratory and the results revealed that the concrete compression strengths are much higher than those specified in the project (18 MPa). Thus, the concrete of the current structure has a degree of safety higher than that stipulated in the preparation of structural design. The difference between the values for elasticity modulus of concrete (referring to fck stipulated in the project and the result obtained in the tests) was also considered in the compu-tational models to verify the bridge structure in relation to ultimate limit states and serviceability limit states.
Based on direct observation of the state of the minerals, in the investigation of the maintenance history, which directly reflects the degree of reliability and integrity of the structure and of the theoreti-cal models, it is concluded that at no studied point occurred cor-rosion in the reinforcements nor CO2 penetration into the concrete
layer corresponding to the coating. This indicates unfavorable con-ditions for the advance of carbonation front provided by the envi-ronment, giving a high reliability to the test results of sclerometry which may be strongly affected by this phenomenon, once accord-ing to the ACI 228R-89 (1989 ) [13] a carbonated surface layer results in sclerometric indexes greater than those corresponding to the inner layers of the structural element.
The sclerometry tests also revealed that resistance values do not suffer large dispersions when comparing elements relatively dis-tant along the structure, which reinforces the hypothesis concern-ing “uniformity” in the strength of concrete. The pacometry tests served to ensure compatibility between the existing and designed reinforcements, but it is recommended to repeat the procedure on a larger number of regions. The axial compression tests accord-ing to NBR 5739 : 1994 and modulus of elasticity under the light of NBR 8522 : 2003 converge with those obtained by sclerometry and codes’ estimates, and the perceived differences are justified by the different natures of the tests. The recommended values for the strain corresponding to the maximum stress of concrete are
Figure �� � Fatigue lifetime analy�i� con�i�ering f from calculation memory
ckalso close to those observed experimentally. The characteristic curve of the concrete, although atypical point modulus of elastic-ity commensurate with analyzed codes’ estimates, however it is recommended campaigns for removal of a greater number of con-crete testimonies to increase the representation of the conclusions related to the constitution of the bridge as a whole.
Regarding the fatigue results it was observed that the damage in the elements of the cross section is low, except for the concrete of the bottom surface of the section, which is very compressed due to the concrete fibers are subject to considerable initial stresses (per-manent loading) suffering large stress variations with the passage of the moving loads. For the future loaded train, it was observed that the element of greatest damage corresponded to the bottom surface reinforcement and concrete of the studied cross section. Because of this it is possible state that the OAE 50A shows no fatigue problems.
7. Acknowledgements
The authors thank to company VALE, ITEGAM, FAPESPA and CAPES for the financial support for this and other experimental works carried out in Northern Brazil.
8. References
[01] CÁNOVAS, M. F. Pathology and therapy of the reinforced concrete. São Paulo: Pini, 1998.
[02] CASCUDO, O. The control of reinforcement corrosion in concrete: inspection and electrochemical
techniques. São Paulo: Pini, 1997.
[03] BRAZILIAN ASSOCIATION OF TECHNICAL STANDARDS. NBR 6118: Design of concrete structures. Rio de Janeiro, 1978.
[04] METHA, P. K. & MONTEIRO, P. J. M. Concrete: microstructure, properties and materials. São Paulo: Pini, 2008.
[05] EVANGELISTA, A. C. J. Concrete strength
STANDARDS. NBR 7584: Hard concrete – superficial hardness evaluation using reflection sclerometer. Rio de Janeiro, 1995.
[07] BRAZILIAN ASSOCIATION OF TECHNICAL STANDARDS. NBR 8522: Concrete – Determination of the elasticity modulus and stress-strain diagram – Testing method. Rio de Janeiro, 2003.
[08] BRAZILIAN ASSOCIATION OF TECHNICAL STANDARDS. NBR 5739: Concrete – Compressive test on cylindrical proofs – Testing method. Rio de Janeiro, 1994.
[09] MALHOTRA, V. M., In situ/Non-destructive testing of concrete, ACI SP-82, American Concrete Institute, Detroit, 1984.
[10] COMPUTERS AND STRUCTURES, INC. Sap2000 advanced 10.0.1. Berkeley: University of Avenue, 1995. (Software).
[11] ASSOCIAÇÃO BRASILEIRA DE NORMAS
TÉCNICAS. NBR 6118: Design of concrete structures. Rio de Janeiro, 2003.
[12] COMITE EURO-INTERNACIONAL DU BETON. CEB-FIP Model Code MC90. London, Thomas Telford, 1990.
![Figure 28 � �oncrete rectified stress and limit fatigue stress according to NBR 6118 : 2003 [11]](https://thumb-eu.123doks.com/thumbv2/123dok_br/18859890.417743/14.892.66.436.173.516/figure-oncrete-rectified-stress-limit-fatigue-stress-according.webp)
