INTRODUCTION
Although there have been many studies related to the synthesis of zeolite Afrom kaolin [1-4], it is important to consider the different characteristics of this clay mineral when derived from different regions, which can directly inluence the yield of the inal synthesis product. In Brazil, the kaolin reserves are almost entirely concentrated (93%) in the sedimentary deposits of the three largest kaolin districts in the country: Rio Capimin the State of Para,Jaríin the State of Amapáand a third deposit in the State of Amazon.
Kaolin presents a layered structure, composed of sheets of Si tetrahedral and Al octahedral with common oxygen, with the formation of a 1:1 layer [5] (Fig. 1A). As kaolins present an Si/Al ratio of approximately 1.0, their composition is suitable for zeolite Asynthesis (Fig. 1B), which also has an Si/Al ratio of approximately 1.0.
The objective of this work is to study the zeolite Asynthesis employing kaolin generated as waste in the process of paper production in the Amazon region as a source of Si and Al. As described [4], industrial waste kaolin is actually kaolin itself, but with granulometric sizes larger
than required for the purposes of the hedging paper process. For this reason, it is considered waste. The zeolite A is often used in industries as an ion exchanger and a molecular sieve, in addition to being an eficient water softening agent in detergent formulation [8].
EXPERIMENTAL
Zeolite synthesis
For comparison and to evaluatethe crystallinity of the
Synthesis of Zeolite A employing Amazon kaolin waste
(Síntese
de Zeólita A empregando resíduo de caulim amazônico)
S. H. da Silva Filho1, L. Bieseki1, A. R. da Silva1, A. A. B. Maia2, R. A. S. San Gil3, S. B. C. Pergher11Laboratório de Peneiras Moleculares - LABPEMOL, Instituto de Química, UFRN,
Av. Senador Salgado Filho 3000, Lagoa Nova, Natal, RN 59078-900
2Centro de Ciências Exatas e Tecnologia, Universidade da Amazônia- Unama, Av. Alcindo Cacela 28,
Belém, PA 66060-902
3Instituto de Química, Lab. RMN de Sólidos, Universidade Federal do Rio de Janeiro, Ilha do Fundão,
Rio de Janeiro, RJ 21941-900
Abstract
The synthesis of zeolite A employing kaolin waste from paper coating was studied. The kaolin waste was pre-treated at 550 to 800 °C. For comparison purposes, a sample of zeolite A was also prepared using the IZA procedure. The materials were character-ized by 27Al MAS NMR, X-ray diffraction and scanning electron microscopy using a microprobe. Pretreatment was necessary, and the best temperatures were between 600 and 700 °C. The zeolite A formation was observed in all the prepared materials, reaching 52% crystallinity. On the other hand, the sodalite phase and amorphous materials were also formed.
Keywords: kaolin waste, zeolite synthesis, zeolite A.
Resumo
Estudou-se a síntese de zeólita A empregando resíduo de caulim de recobrimento de papel. O resíduo de caulim foi pré-tratado a 550 °C para 800 °C. Para ins de comparação, uma amostra de zeólita A foi também preparada utilizando o procedimento IZA. Os materiais obtidos foram caracterizados por 27Al MAS NMR, difração de raios X e microscopia eletrônica de varredura usando uma microssonda. O pré-tratamento foi necessário, e as melhores temperaturas foram entre 600 e 700 ° C. A formação de zeólita A, foi observada em todos os materiais preparados, atingindo 52% de cristalinidade. Por outro lado, a fase sodalita e materiais amorfos também foram formados.
Palavras-chave: resíduo de caulim, a síntese de zeólitas, zeólita A.
Figure 1: Kaolin structure (A) and zeoliteA(B). Adapted from [6, 7].
synthesized samples, a standard synthesis of zeolite A was performed according to the IZA procedure (International Zeolite Association) [9]. The steps of this synthesis are described in Table I.
As an alternative source of silicon and aluminum for zeolite Asynthesis, calcined kaolin samples were used at 550, 600, 700 and 800 °C. The synthesis of these different materials was performed according to the following procedure. In the irst stage, 0.881 g NaOH is dissolved in 11.621 g of H2O, and to this solution 0.037 g of sodium aluminateis added. After dissolving these reagents, 8.478 g ofmetakaolin is added. The samples are placed in an autoclave and then inan oven at 115°C.
Characterization of the starting and synthesized materials
27AlRMN-MAS analyses were performed for the natural kaolin samples calcined at different temperatures in a Bruker Advance III 400 (9.4 T) at 104.3 MHz (27Al), with a probe of 3.2 mm and a rotational speed of 12kHz.
To determine the zeolitic phases, the synthesized samples were characterized by X-ray diffraction in a diffractometer Siemens D5000, with a Ni ilter and Cukα radiation (λ = 1.54 Å).
Scanning electron microscopy and chemical analysis were performed on the same samplesin a microprobe EPMA Shimadzu 1720H, with an accelerating voltage of 15 kV and BC ranging from 50 nA to 0.01 nA.The samples were prepared by dispersion in a carbon ribbon and gold plating.
RESULTS AND DISCUSSION
Characterization of metakaolin coverages amples
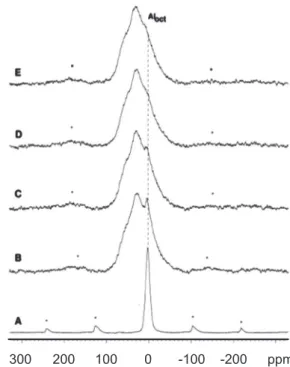
In the 27Al RMN-MAS of the untreated kaolin sample, an
intense signal is observed at approximately 0 ppm due to the presence of octahedral Al [10, 11].This result is consistent with the kaolin samples, which consist of an aluminum octahedral sheet without isomorphous substitution in the tetrahedral sheet.
Fig. 2 shows the 27Al RMN-MASspectra of the 27Al in
the calcined kaolin coverage samples calcinedat different temperatures. The calcined samples exhibitan extremely extended Al signal, and there is a slight decrease in the content of octahedral Al as the temperature increases from 550 °C to 800 °C, according toreported results [4, 10-13]. Although the position of the maximum signal was observed in the region between tetrahedral and octahedral Al, it might represent tetrahedral Al with large asymmetry, or substitutions affecting the tetrahedral angles, rather thanpentahedral sites.
Zeolite synthesis
Fig. 3 shows the diffraction patterns of the sample synthesized under standard conditions, according to the IZA synthesis. The observed relections are consistent with the LTA structure of zeolite A, showing through their intensities a crystal clear material. The igure insert shows the micrograph for this sample, which reveals the typical morphology of zeoliteA, cubes.
The synthesis using kaolin waste without heat treatment (calcination) did not produce any zeolite phase; the material obtained was completely amorphous.
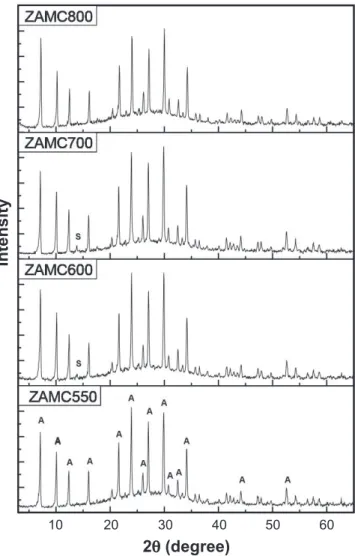
Fig. 4 shows the diffraction patterns of the synthesized zeolites using samples of kaolin waste calcined at different temperatures. These samples show the characteristic properties of zeolite A. Comparing these diffraction patterns with the one of the standard zeolite A, it was observed that Figure 2: 27AlRMN-MAS spectra of kaolin precursor samples
(A) and after calcination at 550 (B), 600 (C), 700 (D) and 800 °C (E).*Rotational bands.
[Figura 2: Espectros de RMN-MAS de 27Al de amostras precursoras
de caulim (A) e após calcinação a 550 (B), 600 (C), 700 (D) e 800 °C (E) * bandas de rotação.]
Steps Procedure
1 40 g distilled H2O + 0.4 g NaOH 2 Divide into two parts,V1 and V2 3 V1 + 4.1 g sodium aluminate 4 Stir until dissolved
5 V2 + 2.2 g silica + 2.9 g NaOH + 3.3 g H2O 6 Pour V1 into V2, stirring for 30 min
7 Crystallized samples in autoclave for 4 h at 100 °C Table I - Order of reagents used in zeolite A synthesis, IZA standard procedure.
[Tabela I - Ordem dos reagentes utilizados na síntese da
zeolita A, procedimento padrão IZA.]
Figure 3: X-ray diffraction pattern of zeolite A- standard synthesis IZA.
[Figura 3: Difratograma de raios X da zeolita A - sintese padrão IZA.]
Figure 5: SEM micrographs of the sample synthesized using kaolin calcined at 600 °C - ZAMC600.
[Figura 5: Micrograias obtidas em microscópio eletrônico de varredura das amostras sintetizadas usando caulim, calcinadas a 600 ºC - ZAMC600.]
Figure 4: X-ray diffraction patterns of samples synthesized using calcined kaolin at different temperatures. A -zeolite A and S - sodalite.
[Figura 4: Difratogramas de raios X das amostras sintetizadas com caulim calcinadas em diferentes temperaturas. A - zeolita A e S - sodalita.]
10
2q (degree)
Intensity
30 50
20 40 60
10
2q (degree)
30 50
20 40 60
a)
b)
in the 2θ range of 20 to 35° the increase in background indicates the presence of amorphous material. The samples presented less intense relections than the standard sample. The relative crystallinity of the synthesized samples was calculated using Equation A. The peak areas at 2θ values of 7.2°, 12.5°, 16.1°, 21.7°, 30°,and 34.2° were used to evaluate the crystallinity.
The relative crystallinity found for the products of synthesis using the calcined samples at 550, 600, 700 and 800 °C are 47, 52, 52 and 45%, respectively.
The micrographs of the zeolitic materials obtained using the calcined kaolin at different temperatures (Fig. 5) were similarand are represented by Fig. 5A, which shows the micrograph of the sample obtained from kaolin calcined at 600 °C. Cubic morphology is observed, which is typical of the LTA structure (zeolite A), with the intergrowth of crystals. Spherical crystals (clusters) characteristic of the sodalite phase (SOD),which competes in the synthesis of zeolite A, are also observed and can be identiied by the appearance of a small relection in the diffraction pattern at 2θ 13.84°. These results have also been reported [4, 14-17]. Fig. 5B shows another micrograph of the same sample, in another region, which again shows the cube-shaped crystals (zeolite A), the spherical crystals (sodalite) and deformed crystals, indicating the presence of amorphous material, which is consistent with the X-ray diffraction results, as also shown previously [9, 16].In some micrographs, hexagonal cubic crystals are also observed, another morphology presented byzeolite A.
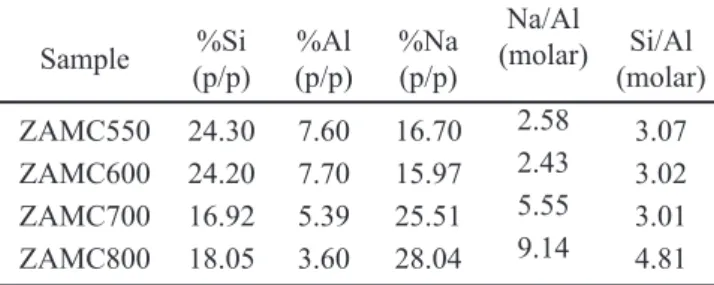
A semi-quantitative chemical analysis was performed using a probe, and the results are summarized in Table II.As the experiment was not a total analysis, it is noted that the molar ratio Si/Al is larger than 1.0. The increase in sodium with increasing calcining temperature, coinciding with the less crystalline materials, is noteworthy. Once the zeolite Astructure is formed, the molar ratio of Si/Al must be equal to 1.0, and the molar ratio Na/Al also must be equal to 1.0, as each Na atom would compensatefor the load of each Al tetrahedral.
CONCLUSIONS
The kaolin pre-treatment is required for the transformation of the metakaolin and subsequent zeolite A synthesis.
Through solid NMR analysis, the transformation of the octahedral Alto asymmetric tetrahedral Al was observed. Increased temperature leads to a decrease in octahedral aluminum, which indicates the necessity of calcining kaolin at temperatures from 600 to 700 °C. The samples formed the desired structure, zeolite A, but amorphous material and the sodalite phasewere also detected. This result suggests that the synthesis can still be optimized to achieve a higher zeolite Ayield.
ACKNOwLEDGMENTS
To CNPq for inancial aid and to PPGQ.
REFERENCES
[1] J. Rocha, J. Klinowski, J.M. Adams,“Synthesis of zeolite NaA from metakaolinite revisited”, J. Chem. Soc., Faraday Trans. 87 (1991) 3091-3097.
[2] L. Heller-Kallai, I. Lapides, “Reactions of Kaolinites and Metakaolinites with NaOH; comparison of different samples (Part 1)”, Appl.Clay Sci. 35(2007) 99-107.
[3] R.T. Rigo, S.B.C. Pergher, “Um novo procedimento de síntese da zeólita A empregando argilas naturais”, Química Nova 39, 1 (2009) 21-25.
[4] A.A.B. Maia, “Desenvolvimento do processo de síntese da zeólita a e da sodalita a partir de rejeitos de caulim da amazônia com aplicações em adsorção”, M.Sc. Diss. Federal Univesity of Pará, Brazil (2011).
[5] R.E. Grim, Clay Mineralogy, McGraw- Hill, New York (1953) 384 pp.
[6] http://pubs.usgs.gov/of/2001/of01041/htmldocs/clays/ kaogr.htm
[7] A.J.S. Mascarenhas, E.C. Oliveira, H.O. Pastore, “Peneiras Moleculares: Selecionando as moléculas pelo seu tamanho”, Cad.Tem. Quimica Nova na Escola (2001) 25-34.
[8] F.K. Sutili, N. Miotto, E. Rigoti, S.B.C. Pergher, F.G. Penha, “Aplicação de zeólitas sínteticas como coadjuvante em formulação detergente”, Quimica Nova 32 (2009) 879-883.
[9] www.iza-online.org/synthesis.
[10] J. Sanz, A. Madani, J.M. Serratosa, S. Aza, “Aluminum - 27 and Silicon - 29 Magic - Angle Spinning Nuclear Magnetic Resonance. Study of the Kaolinite-MulliteTransformation”, J. Am. Ceram. Soc. 71, 10 (1988) C418-C421.
[11] J. Rocha, J. Klinowski, “29Si and 27Al magic-angle-spinning NMR studies of thermal transformation of Kaolinite”, Phys. Chem. Mineral. 17 (1990) 179-186. [12] D. Massiot, P. Dion, J.F. Alcover, F. Bergaya, “27Al and 29Si MAS NMR study of kaolinite thermal decomposition by controlled rate thermal analysis”, J. Am. Ceram. Soc. 78 (1995) 2940-2944.
[13] H.P. He, J.G. Guo, J.X. Zhu, C. Hu, “29Si and 27Al MAS NMR study of the thermal transformations of kaolin from North China”, Clay Minerals 38, 4 (2003) 551-559. [14] A. Gualtieri, P. Norby, G. Artioli, J. Hanson, “Kinetics Sample (p/p)%Si (p/p)%Al %Na (p/p) (molar)Na/Al Si/Al
(molar)
ZAMC550 24.30 7.60 16.70 2.58 3.07
ZAMC600 24.20 7.70 15.97 2.43 3.02
ZAMC700 16.92 5.39 25.51 5.55 3.01
ZAMC800 18.05 3.60 28.04 9.14 4.81
Table II - Chemical analysis of the material, obtained with a microprobe.
of formation of zeolite Na-A (LTA) from natural kaolinites”, Phys. Chem. Mineral. 24, 3 (1997) 191-199.
[15] M. Alkan, C. Hopa, Z. Yilmaz, H. Guler, “The effect of alkali concentration and solid/liquid ratio on the hydrothermal synthesis of zeolite NaA from natural kaolinite”, Microporous Mesoporous Mater. 86 (2005) 176-184.
[16] A.A.B. Maia, E. Saldanha, R.S. Angélica, C.A.G. Souza, R. F. Neves, “The use of kaolin wastes from the Amazon region on the synthesis of Zeolite A”, Cerâmica 53 (2007) 319-324.
![Figure 1: Kaolin structure (A) and zeoliteA(B). Adapted from [6, 7].](https://thumb-eu.123doks.com/thumbv2/123dok_br/18892820.425520/1.892.459.822.742.877/figure-kaolin-structure-zeolitea-b-adapted.webp)