ISSN 1414-431X
www.bjournal.com.br
www.bjournal.com.br
Volume 45 (12) 1102-1340 December 2012
Braz J Med Biol Res, December 2012, Volume 45(12) 1163-1171
10.1590/S0100-879X2012007500151
doi:
Impairment of the hematological response and interleukin-1
â
production in protein-energy malnourished mice after endotoxemia
with lipopolysaccharide
R.A. Fock, M.A.R. Vinolo, S.L. Blatt and P. Borelli
Institutional Sponsors
The Brazilian Journal of Medical and Biological Research is partially financed by
Faculdade de Medicina de Ribeirão Preto Campus
Ribeirão Preto
Explore High - Performance MS Orbitrap Technology In Proteomics & Metabolomics
analiticaweb.com.br S C I E N T I F I C
BIOMEDICAL SCIENCES
AND
Impairment of the hematological response
and interleukin-1β production in protein-energy
malnourished mice after endotoxemia with
lipopolysaccharide
R.A. Fock, M.A.R. Vinolo, S.L. Blatt and P. Borelli
Laboratório de Hematologia Experimental, Departamento de Análises Clínicas e Toxicológicas, Faculdade de Ciências Farmacêuticas, Universidade de São Paulo, São Paulo, SP, Brasil
Abstract
The objectives of this study were to determine if protein-energy malnutrition (PEM) could affect the hematologic response to lipopolysaccharide (LPS), the interleukin-1β (IL-1β) production, leukocyte migration, andblood leukocyte expression of CD11a/ CD18. Two-month-old male Swiss mice were submitted to PEM (N = 30) with a low-protein diet (14 days) containing 4% protein, compared to 20% protein in the control group (N = 30). The total cellularity of blood, bone marrow, spleen, and bronchoalveo -lar lavage evaluated after the LPS stimulus indicated reduced number of total cells in all compartments studied and different kinetics of migration in malnourished animals. The in vitro migration assay showed reduced capacity of migration after the LPS
stimulus in malnourished animals (45.7 ± 17.2 x 10⁴ cells/mL) compared to control (69.6 ± 7.1 x 10⁴ cells/mL, P ≤ 0.05), but
there was no difference in CD11a/CD18 expression on the surface of blood leukocytes. In addition, the production of IL-1β in vivo after the LPS stimulus (180.7 pg·h-1·mL-1), and in vitro by bone marrow and spleen cells (41.6 ± 15.0 and 8.3 ± 4.0 pg/
mL) was significantly lower in malnourished animals compared to control (591.1 pg·h-1·mL-1, 67.0 ± 23.0 and 17.5 ± 8.0 pg/
mL, respectively, P ≤ 0.05). The reduced expression of IL-1β, together with the lower number of leukocytes in the central and peripheral compartments, different leukocyte kinetics, and reduced leukocyte migration capacity are factors that interfere with the capacity to mount an adequate immune response, being partly responsible for the immunodeficiency observed in PEM. Key words: Blood; Bone marrow; Spleen; Interleukin-1β; Lipopolysaccharide; Malnutrition
Introduction
Correspondence: R.A. Fock, Departamento de Análises Clínicas e Toxicológicas, Faculdade de Ciências Farmacêuticas, USP,
Av. Prof. Lineu Prestes, 580, Bloco 17, 05508-900 São Paulo, SP, Brasil. Fax: +55-11-3813-2197. E-mail: [email protected]
Received May 19, 2011. Accepted September 4, 2012. Available online September 21, 2012. Published December 17, 2012.
Protein energy malnutrition (PEM) is the most frequent type of malnutrition affecting millions of people worldwide, especially children, underweight newborn infants, the elderly, individuals with eating disorders such as nervous
anorexia and bulimia, patients with neoplasias or chronic
diseases, patients under chemotherapy or hospitalized
patients of advanced age (≥60 years), and individuals who undergo radical diets (1-3).
PEM-mediated impairment of the immune system re
-sults in increased morbidity and mortality due to infectious complications (1,2). PEM modifies physiological responses and may induce cellular lesions, and the extent and timing
of damage differs depending on the tissue. Tissues with a high protein turnover are affected before those with a low protein turnover (2,4).
The elevated and constant protein demand of he-matopoietic tissue leads to a condition in which both
qualitative and quantitative alterations may be found when PEM occurs. PEM modifies both the adaptive and innate
immune response of organisms to infectious agents, such
as a reduced production of blood cells, thereby leading to bone marrow hypoplasia and the induction of structural
alterations in bone marrow (4-8).
Mobilization of inflammatory cells from the circulation into tissues is mediated by factors with local and systemic effects. In response to an inflammatory stimulus, monocytes and polymorphonuclear (PMN) leukocytes marginate and adhere to the endothelium and migrate into local inflam
1164 R.A. Fock et al.
PMN leukocyte migration. CD11a/CD18 are molecules expressed in these cells and are involved in leukocyte migration capacity (9-11).
Mono/macrophages and PMN leukocytes are important phagocytic cells, and activation of these cells leads to the secretion of a number of pro-inflammatory cytokines such as interleukin 1 (IL-1), a potent immune and inflammatory mediator. Inflammatory cytokines can also be produced by cells involved in natural immunity after exposure to many
pathogenic microorganisms and their products. A number
of microbial products, including bacterial lipopolysaccharide (LPS), induce the synthesis of pro-inflammatory cytok
-ines. The expression of IL-1β and other pro-inflammatory cytokines, such as IL-6 and tumor necrosis factor-alpha (TNF-α), are an important mechanism of host defense
against infection (12-15).
It is known that malnourished animals present severe
hypoplasia of lympho-hemopoietic organs and functional alterations in leukocytes (7,8,14,16). Thus, the objective of the present study was to evaluate the influence of PEM
on the hematopoietic response after an LPS stimulus, as
well as on the production of IL-1β and on the capacity of leukocyte migration.
Material and Methods
Diets
The murine diets were prepared in our laboratories. Mineral and vitamin mixtures were prepared according to the recommendations of the American Institute of Nutrition
(AIN-93M) for adult mice (17), although the control diet contained 20% protein and the low-protein diet contained only 4%. Both diets contained 100 g/kg sucrose, 80 g/kg corn oil, 10 g/kg fiber, 2.5 g/kg choline bitartrate, 1.5 g/kg L-methionine, 40 g/kg mineral mixture, and 10 g/kg vitamin mixture. The control diet contained 200 g/kg casein and 556 g/kg cornstarch while the low-protein diet contained 40 g/kg casein and 716 g/kg cornstarch. The two diets were isocaloric and provided 1716.3 kJ/100 g. Final protein content was confirmed using the standard micro-Kjeldahl
method (18).
Animals
Outbred male Swiss mice 2 to 3 months of age were obtained from the animal facilities of Faculdade de Ciências Farmacêuticas, Universidade de São Paulo. The animals were placed in individual “metabolic cages” and maintained
under a regular 12-h light/dark cycle at a temperature of 22-25°C and with relative humidity of 55 ± 10%, receiving the control diet for 21 days until they stabilized their body weight.
After this period of adaptation, the animals were divided into two groups: control (N = 30) and malnourished (N = 30), receiving the control and the low-protein diet ad libitum,
respectively. Their body weight and food consumption were monitored every 48 h. Mice were subjected to experimental
assays after 14 days of eating their respective diets, by which time the malnourished group had lost about 20% of their original body weight (13,14). A nutritional evaluation was performed by measuring body weight, diet consump -tion and protein, albumin and pre-albumin concentra-tions
in blood serum. The body weight variation was calculated considering the initial (after the adaptation period) and final (day of sacrifice) weight of the animals in both groups, and the results are reported as means ± SD. The study was ap
-proved by the Ethics Committee of Faculdade de Ciências
Farmacêuticas, Universidade de São Paulo.
Endotoxemia by LPS
Mice from control and malnourished groups were
sub-jected to experimental endotoxemia after 14 days of eating
their respective diets. Animals from both groups were
intra-venously inoculated via the caudal vein with 100 µL LPS
(Escherichia coli 055B5, Sigma, USA) at a concentration
of 12.5 µg/mL diluted in a pyrogen-free aqueous solution of 0.9% NaCl. After the LPS stimulus, mice were anesthetized with 10 mg/kg xylazine chloral hydrate (Rompum®, Bayer,
Brazil) and 100 mg/kg ketamine chloral hydrate (Ketamina®,
Farex, Brazil), and were sacrificed at different times (2, 6, 12, 24 h). At each time of sacrifice, serum was collected to determine IL-1β production and hemogram, myelogram,
splenogram, and bronchoalveolar lavage cell count were performed.
Hemogram, myelogram, splenogram, and bronchoalveolar lavage cell count
After the LPS stimulus, mice were anesthetized and
sacrificed and whole blood samples were collected con
-comitantly with bone marrow, spleen and bronchoalveolar
cells. The same samples were collected from animals that had not received the LPS stimulus.
Blood samples were collected by cardiac puncture into
tubes without or with EDTA as an anticoagulant (Sigma). Samples collected with EDTA were used to perform the hemogram and in samples without EDTA the serum was
separated by centrifugation (1000 g for 10 min) and used for total serum protein, albumin and pre-albumin
determina-tions as well as IL-1β quantification.
Bone marrow cells were obtained by flushing the femoral cavity with 2 mL McCoy’s 5A medium (Sigma) and spleen cells were obtained by gentle dissociation using needles and tweezers in 5 mL McCoy’s 5A medium with EDTA (1 mg/ mL). Bronchoalveolar lavage cells were obtained by trachea cannulation with polyethylene tubing and lung flushing with 5 mL McCoy’s 5A medium. The recovered bone marrow,
spleen and bronchoalveolar cells were centrifuged (170 g
for 10 min at 20°C), and the resulting cell pellets were
re-suspended in 1 mL McCoy’s 5A medium for cell counting.
Hemoglobin concentration and hematocrit were
deter-mined by standard methods (19). Hemogram, myelogram,
by counting leukocytes in a Neubauer chamber (Herka, Ger
-many) by standard methods (19) and differential leukocyte
counts were performed on smears stained with standard
May-Grünwald-Giemsa solutions (Sigma).
Measurement of CD11a/CD18 expression on circulating blood cells
Total blood cells from control and malnourished
ani-mals without the LPS stimulus were collected by cardiac puncture as described above and used to quantify CD11a/ CD18 expression. Flow cytometry was used to determine
the percent fraction of blood cells from control and
malnour-ished animals that were positively labeled with fluorescein isothyocyanate (FITC)-conjugated rat anti-mouse CD11a
(clone: 2D7 Cat. No. 553120, Becton Dickinson, USA)
and FITC-conjugated rat anti-mouse CD18 (clone: M18/2 Cat. No. 11-0181, eBioscience, USA). The isotype control was FITC-conjugated rat immunoglobulin IgG2a κ. The
samples and negative chain controls were incubated with
1 µg monoclonal antibody per 106 cells/mL, incubated for
20 min at 25°C, and protected from light. After this period,
the erythrocytes were lysed by adding 2 mL 10% lysing solution (Lysing Solution®, Becton Dickinson) and were
incubated again and protected from light for 15 min. Next, the tubes were centrifuged at 400 g for 10 min, the super-natant was discarded, and the cell sediment was washed
twice with PBS containing 0.1% azide. The sediment was re-suspended in 500 µL phosphate-buffered saline (PBS, Gibco® Invitrogen Cell Culture, USA), and cells were
ana-lyzed with a flow cytometer (FacsCalibur, Becton Dickinson).
Fluorescence measurements were obtained with at least 1 x 10⁴ cells. Data were analyzed using the Cell Quest®
software package. The results are reported as a percentage of the gated population.
In vitro chemotaxis assay
Bone marrow cells were obtained by flushing the femoral cavity with 2 mL McCoy’s 5A medium (Sigma) and
PMN cells from control and malnourished animals were
recovered from a density gradient consisting of Histopaque 1077 layered on top of Histopaque 1119 according to
manufacturer instructions (Sigma). PMN cells from bone
marrow were plated (1 x 10⁶/well in McCoy’s 5A medium,
01% BSA) in transwell inserts (precoated with 10% fetal bovine serum) containing 8-µm pores (Nunc, Denmark). LPS at a concentration of 1.25 µg was added or not to
the lower chamber and the plates were incubated at 37°C
in a humidified atmosphere of 5% CO2. PMN chemotaxis
assays were performed for 2 h. The migrating cells were then stained with standard May-Grünwald-Giemsa solu -tions (Sigma) prior to counting.
Evaluation of circulating IL-1β levels after the LPS
stimulus
The IL-1β present in the serum of animals without the
LPS stimulus or after 2, 6, 12, and 24 h of LPS stimulus was
quantified by ELISA using commercially available reagents (Quantikine® M murine, R&D Systems, USA) according to
the procedures recommended by the manufacturer. The
samples were processed in duplicate.
Bone marrow, spleen cell culture and IL-1β
determination
Cell viability was evaluated by the 0.1% Trypan blue exclusion test and, on average, 98% viability was obtained.
The total bone marrow and spleen cells were cultured on 24-well, round-bottomed microtiter culture plates with 1 mL
McCoy’s 5A medium and 1.25 µg LPS at a final concentration
of 1 x 10⁶ cells/mL. The cells were then incubated at 37°C
in a humidified atmosphere of 5% CO2 for 24 h, and the
supernatants were collected for cytokine determination. The
entire procedure was executed under aseptic conditions,
and all the materials used were previously sterilized and pyrogen-free. Cytokines were quantitated by ELISA using commercially available reagents (Quantikine® M murine,
R&D Systems) and following the procedures recommended by the manufacturer.
Statistical analysis
The dependent variables were normally distributed. Data were compared by the Student t-test and ANOVA
using the statistics computer software GraphPad Prism.
All data are reported as means ± SD. The probability ac
-cepted as indicative of statistically significant differences was P ≤ 0.05.
Results
Protein consumption, body weight and serum protein, albumin and pre-albumin
Mice maintained on the low-protein diet reduced their
food consumption (control group = 6.8 ± 0.51 g·day-1·animal-1;
malnourished group = 5.1 ± 0.75 g·day-1·animal-1, N = 30 for
each group, P≤ 0.05), and their protein consumption (control
group = 1.32 ± 0.27 g·day-1·animal-1; malnourished group
= 0.21 ± 0.09 g·day-1·animal-1, N = 30 for each group,P ≤
0.05), resulting in a loss of 19% of their initial weight.
The serum proteins had decreased concentrations in
mice maintained on the low-protein diet(control group =
7.4 ± 0.96 g/dL; malnourished group = 4.9 ± 0.77 g/dL, N = 30 for each group, P ≤ 0.05), as also did albumin (control group = 4.5 ± 0.6 g/dL; malnourished group = 3.2 ± 0.4 g/dL, N = 30 for each group, P ≤ 0.05) and pre-albumin (control group = 10.8 ± 1.2 mg/dL; malnourished group = 2.9 ± 1.9/ mg/dL, N = 12 for each group, P ≤ 0.05).
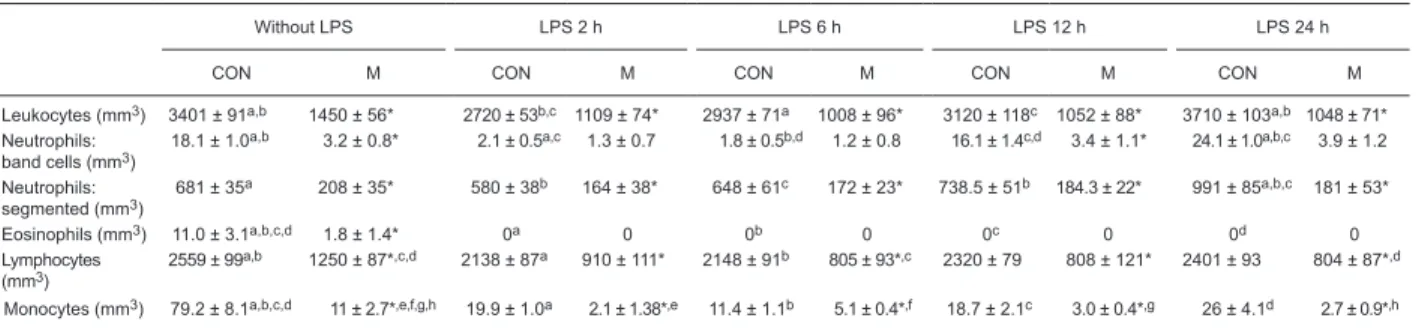
Blood
The malnourished animals had a decreased number of
leukocytes as well as granulocytes, lymphocytes and mono
1166 R.A. Fock et al.
were detected in these cells. The administration of LPS did
not change the decreased number of leukocytes observed
in malnourished animals. The LPS stimulus reduced the
number of leukocytes in the control group (P ≤ 0.05) after 2
h, but an increase of the neutrophilic lineage was observed in the control group 24 h after the LPS stimulus.
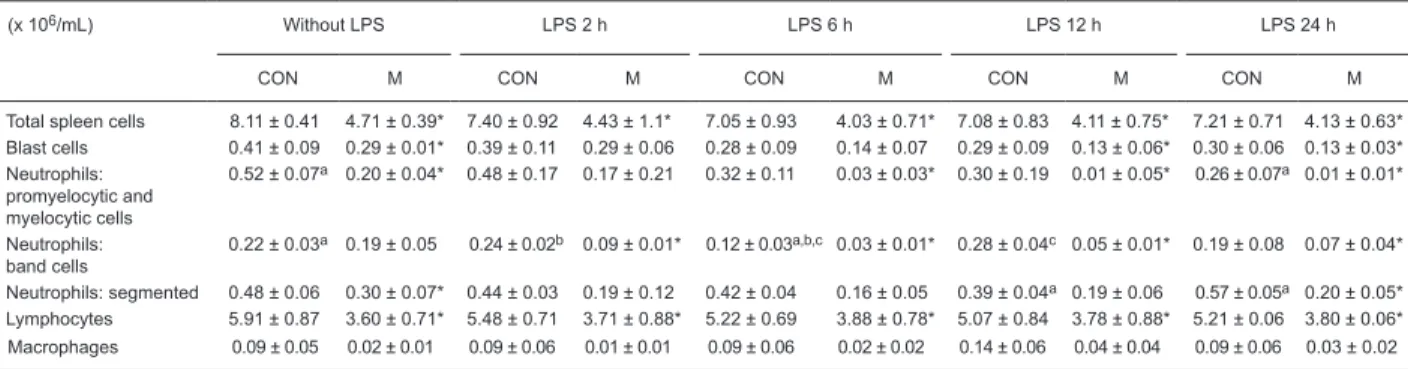
Cellularity of bone marrow and spleen
Animals in the malnourished group had bone marrow
and splenic hypoplasia (Tables 2 and 3) with a pronounced reduction in the myeloid compartment. The basal number of blast cells was significantly reduced in malnourished
animals. After the LPS stimulus, we observed a distinct difference in the response of malnourished and control animals with a different neutrophilic kinetic of maturation and mobilization, showing an increase in neutrophilic cells in control animals after 24 h of the LPS stimulus.
Bronchoalveolar lavage cell count
As shown in Table 4, malnourished animals had fewer cells in the bronchoalveolar lavage than control animals. After the LPS stimulus, animals showed an increase in cell counts in the bronchoalveolar lavage, but this increase was higher in control than malnourished animals. In the control group, we observed an increase in neutrophils 2 h after the LPS stimulus, whereas in the malnourished group, this
increase appeared after 6 h and with less intensity than in
the control animals. In the control group, we observed an in-crease in macrophages 24 h after the LPS stimulus, and this response was not observed in malnourished animals.
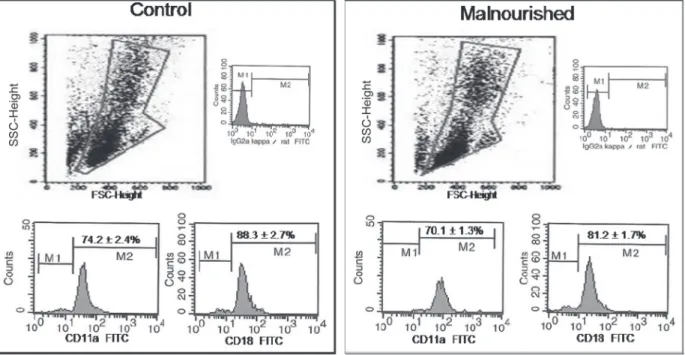
Blood cell CD11a/CD18 expression
The CD11a/CD18 expression on blood cells (Figure 1) did not differ significantly between the control and mal -nourished groups, but tended to be lower in mal-nourished
Table 1. Blood counts of the number of total leukocytes, polymorphonuclear neutrophils, eosinophils, lymphocytes, and monocytes in
control and malnourished mice stimulated or not with lipopolysaccharide.
Without LPS LPS 2 h LPS 6 h LPS 12 h LPS 24 h
CON M CON M CON M CON M CON M
Leukocytes (mm3) 3401 ± 91a,b 1450 ± 56* 2720 ± 53b,c 1109 ± 74* 2937 ± 71a 1008 ± 96* 3120 ± 118c 1052 ± 88* 3710 ± 103a,b 1048 ± 71*
Neutrophils: band cells (mm3)
18.1 ± 1.0a,b 3.2 ± 0.8* 2.1 ± 0.5a,c 1.3 ± 0.7 1.8 ± 0.5b,d 1.2 ± 0.8 16.1 ± 1.4c,d 3.4 ± 1.1* 24.1 ± 1.0a,b,c 3.9 ± 1.2
Neutrophils: segmented (mm3)
681 ± 35a 208 ± 35* 580 ± 38b 164 ± 38* 648 ± 61c 172 ± 23* 738.5 ± 51b 184.3 ± 22* 991 ± 85a,b,c 181 ± 53*
Eosinophils (mm3) 11.0 ± 3.1a,b,c,d 1.8 ± 1.4* 0a 0 0b 0 0c 0 0d 0
Lymphocytes
(mm3) 2559 ± 99
a,b 1250 ± 87*,c,d 2138 ± 87a 910 ± 111* 2148 ± 91b 805 ± 93*,c 2320 ± 79 808 ± 121* 2401 ± 93 804 ± 87*,d
Monocytes (mm3) 79.2 ± 8.1a,b,c,d 11 ± 2.7*,e,f,g,h 19.9 ± 1.0a 2.1 ± 1.38*,e 11.4 ± 1.1b 5.1 ± 0.4*,f 18.7 ± 2.1c 3.0 ± 0.4*,g 26 ± 4.1d 2.7 ± 0.9*,h
Data are reported as means ± SD number of leukocytes and of different types of white blood cells in the blood of control (CON) and malnourished (M) mice inoculated intravenously with 1.25 µg lipopolysaccharide (LPS). Blood from 6 mice per group was analyzed at each time point. *P ≤ 0.05 compared to CON (t-test). The same superscript letter indicates a significant difference between groups(P
≤ 0.05; one-way ANOVA).
Table 2. Number of total and differential counts of bone marrow cells from control and malnourished mice stimulated or not with
lipopolysaccharide.
(x 106/mL) Without LPS LPS 2 h LPS 6 h LPS 12 h LPS 24 h
CON M CON M CON M CON M CON M
Total bone marrow cells
7.70 ± 0.6a 4.91 ± 0.6* 7.05 ± 0.8 4.08 ± 0.4* 6.89 ± 1.1 4.29 ± 0.9 6.41 ± 0.6 4.28 ± 0.9 6.12 ± 0.7a 4.14 ± 0.5
Blast cells 0.5 ± 0.09 0.21 ± 0.02* 0.39 ± 0.04 0.23 ± 0.05 0.30 ± 0.03 0.20 ± 0.04 0.33 ± 0.05 0.19 ± 0.05 0.37 ± 0.07 0.24 ± 0.05* Neutrophils:
promyelocytic and myelocytic cells
0.51 ± 0.10 0.36 ± 0.03* 0.41 ± 0.05 0.24 ± 0.06* 0.39 ± 0.03 0.36 ± 0.04 0.31 ± 0.03 0.34 ± 0.03 0.38 ± 0.10 0.33 ± 0.7
Neutrophils: band cells
1.94 ± 0.08a,b 1.09 ± 0.04* 2.21 ± 0.12c,d 0.47 ± 0.03* 1.71 ± 0.11 0.46 ± 0.03* 1.64 ± 0.09a,c 0.48 ± 0.05* 1.56 ± 0.11b,d 0.47 ± 0.06*
Neutrophils: segmented
1.61 ± 0.12a,b,c,d 1.21 ± 0.09* 1.20 ± 0.11* 1.28 ± 0.14 1.36 ± 0.13b 1.29 ± 0.11 1.39 ± 0.12c 1.41 ± 0.14 1.98 ± 0.07a,b,c,d 1.31 ± 0.05*
Eosinophils 0.15 ± 0.08 0.07 ± 0.03 0.09 ± 0.04 0.05 ± 0.02 0.04 ± 0.02 0.04 ± 0.01 0.05 ± 0.01 0.07 ± 0.01 0.03 ± 0.01 0.03 ± 0.01
Lymphocytes 1.41 ± 0.12 1.52 ± 0.12 1.40 ± 0.21 1.62 ± 0.19 1.53 ± 0.15 1.63 ± 0.18 1.39 ± 0.11 1.57 ± 0.13 1.35 ± 0.14 1.54 ± 0.7 Macrophase 0.08 ± 0.02 0.03 ± 0.01 0.04 ± 0.01 0.02 ± 0.01 0.02 ± 0.01 0.03 ± 0.01 0.03 ± 0.02 0.02 ± 0.02 0.05 ± 0.03 0.02 ± 0.7
Data are reported as means ± SD number of cells present in the bone marrow of control (CON) and malnourished (M) mice inoculated
intravenously with 1.25 µg lipopolysaccharide (LPS). Bone marrow from 6 mice per group was analyzed at each time point. *P ≤ 0.05
compared to CON at each time point studied (t-test). The same supercript letter indicates a significant difference between groups (P
animals than in the control group.
In vitro chemotaxis assay
Control and malnourished groups showed the same
migration capacity when PMN cells were incubated without LPS. However, PMN cells in a migration assay with LPS showed a reduced migration capacity in the malnourished
group compared to control (Figure 2).
IL-1β production
Malnourished animals produced less IL-1β during the in vivo and in vitro tests. Figure 3A shows the IL-1β pro -duction in the circulation after the LPS stimulus, and the
analysis of the area under the curve showed that IL-1β
production in malnourished animals was lower than in the
control group (180.7 and 591.1 pg·h-1·mL-1, respectively).
Peak IL-1β production started 2 h after the LPS stimulus in control animals, and this peak was delayed by 4 h in malnourished animals.
The IL-1β determinations made in the supernatants of
cultured bone marrow and spleen cells (Figure 3B and C,
respectively) were carried out with a 1.25-µg LPS stimulus for 24 h. The IL-1β concentrations were significantly lower (P ≤ 0.05) in cell cultures of malnourished mice compared
to control.
Discussion
PEM impairs the host’s immune system, thereby in
-creasing susceptibility to infection (10). We have shown
that PEM affects the central and peripheral hematological kinetic response after endotoxemia and impairs the
migra-tion capacity as wells the producmigra-tion of IL-1β.
The control group received adequate protein in their
diet, and the test group received a low-protein diet, had a
markedly lower food intake and experienced about a 20% loss of body weight. As a result, even though the animals ingested a lower amount of food, the diet we prepared met
the minimum nutrient requirements for adult mice (17).
Because the animals in the malnourished group ingested
the minimum daily amounts of nutrients required, we may
conclude that the changes observed in our experimental
Table 3. Total and differential counts of spleen cells from control and malnourished mice stimulated or not with lipopolysaccharide.
(x 106/mL) Without LPS LPS 2 h LPS 6 h LPS 12 h LPS 24 h
CON M CON M CON M CON M CON M
Total spleen cells 8.11 ± 0.41 4.71 ± 0.39* 7.40 ± 0.92 4.43 ± 1.1* 7.05 ± 0.93 4.03 ± 0.71* 7.08 ± 0.83 4.11 ± 0.75* 7.21 ± 0.71 4.13 ± 0.63* Blast cells 0.41 ± 0.09 0.29 ± 0.01* 0.39 ± 0.11 0.29 ± 0.06 0.28 ± 0.09 0.14 ± 0.07 0.29 ± 0.09 0.13 ± 0.06* 0.30 ± 0.06 0.13 ± 0.03* Neutrophils:
promyelocytic and myelocytic cells
0.52 ± 0.07a 0.20 ± 0.04* 0.48 ± 0.17 0.17 ± 0.21 0.32 ± 0.11 0.03 ± 0.03* 0.30 ± 0.19 0.01 ± 0.05* 0.26 ± 0.07a 0.01 ± 0.01*
Neutrophils: band cells
0.22 ± 0.03a 0.19 ± 0.05 0.24 ± 0.02b 0.09 ± 0.01* 0.12 ± 0.03a,b,c 0.03 ± 0.01* 0.28 ± 0.04c 0.05 ± 0.01* 0.19 ± 0.08 0.07 ± 0.04*
Neutrophils: segmented 0.48 ± 0.06 0.30 ± 0.07* 0.44 ± 0.03 0.19 ± 0.12 0.42 ± 0.04 0.16 ± 0.05 0.39 ± 0.04a 0.19 ± 0.06 0.57 ± 0.05a 0.20 ± 0.05* Lymphocytes 5.91 ± 0.87 3.60 ± 0.71* 5.48 ± 0.71 3.71 ± 0.88* 5.22 ± 0.69 3.88 ± 0.78* 5.07 ± 0.84 3.78 ± 0.88* 5.21 ± 0.06 3.80 ± 0.06* Macrophages 0.09 ± 0.05 0.02 ± 0.01 0.09 ± 0.06 0.01 ± 0.01 0.09 ± 0.06 0.02 ± 0.02 0.14 ± 0.06 0.04 ± 0.04 0.09 ± 0.06 0.03 ± 0.02
Data are reported as means ± SD numbers of cells present in the spleen of control (CON) and malnourished (M) mice inoculated intravenously with 1.25 µg lipopolysaccharide (LPS). Spleen cells from 6 mice per group were analyzed at each time point. *P ≤ 0.05 compared to CON at
each time point studied (t-test). The same superscript letter indicates a significant difference between groups (P ≤ 0.05; one-way ANOVA).
Table 4. Number of total and differential counts of bronchoalveolar lavage cells from control and malnourished mice stimulated or not
with lipopolysaccharide.
(x 104/mL) Without LPS LPS 2 h LPS 6 h LPS 12 h LPS 24 h
CON M CON M CON M CON M CON M
Total cells 16.7 ± 0.7a,b 9.9 ± 0.9*e 19.7 ± 2.8c 12.1 ± 2.1 19.1 ± 2.1d 18.1 ± 2.3e,f 24.8 ± 1.1a 12.1 ± 1.2* 29.1 ± 2.1b,c,d 10.6 ± 0.9*,f
Neutrophils 1.3 ± 0.2a,b,c 1.0 ± 0.2g 6.1 ± 0.4 a,d 1.7 ± 0.2*,h 7.2 ± 0.3b,e 2.7 ± 0.6*,g,i 5.7 ± 0.3c,f 1.4 ± 0.1* 1.6 ± 0.6d,e,f 0.9 ± 0.2h,i
Eosinophils 0.33 ± 0.09a 0.06 ± 0.02* 0.09 ± 0.02 0.01 ± 0.02 0.08 ± 0.04 0.01 ± 0.02 0.12 ± 0.02 0.01 ± 0.01 0.01 ± 0.01a 0.01 ± 0.01 Lymphocytes 11.1 ± 0.9 8.0 ± 0.5* 9.8 ± 1.2a 8.4 ± 1.3 9.1 ± 1.1b 10.3 ± 1.4 10.7 ± 0.7 9.4 ± 0.7* 14.2 ± 0.9a,b 8.0 ± 0.7*
Macrophages 5.1 ± 0.5a 1.1 ± 0.3* 5.2 ± 0.5b 0.9 ± 0.1* 5.0 ± 0.5c 1.9 ± 0.6* 8.3 ± 0.7d 1.5 ± 0.2* 11.1 ± 0.5 a,b,c,d 1.8 ± 0.5*
Data are reported as means ± SD number of cells present in the bronchoalveolar lavage of control (CON) and malnourished (M) mice
inoculated intravenously with 1.25 µg lipopolysaccharide (LPS). Bronchoalveolar lavage cells from 6 mice per group were analyzed at each time point. *P ≤ 0.05 compared to CON at each time point studied (t-test). The same superscript letter indicates a significant
1168 R.A. Fock et al.
model were mainly the result of the reduction in protein and energy intake compared to the control group.
Leukopenia and leukocytosis are situations that occur during malnutrition, especially in humans, when accompa
-nied by infectious processes or chronic disease (4,10,20,21),
but there is evidence that in situations in which malnutrition
is not accompanied by other diseases, leukopenia is always
present (20,22).
The reduced numbers of blood leukocytes exhibited by malnourished animals in this study were accompanied by bone marrow and spleen hypoplasia and, furthermore, the
animals of the malnourished group that received LPS pre-sented a hematological response that was both central and
peripheral in nature and smaller than that which occurred in
control animals. The granulocytic lineage showed a distinct behavior when both groups were analyzed. Malnourished animals had a lower number of granulocytic precursors in
the central compartments (bone marrow and spleen) and
decreased granulocyte production, kinetic maturation and impaired recruitment of leukocytes from the bone marrow pool to the circulation, with a suggestive delay in leukocyte
mobilization when compared to control animals.
Endotoxins alter cell mobilization not only by releasing marginated granulocytes but also by modifying the influx
into the maturation compartment (23,24). We observed
in this study that the response from cell production to cell
Figure 1. CD11a and CD18 expression on peripheral leukocytes obtained from control and malnourished mice. Data are reported as
means ± SD for 6 mice in each group. Data were obtained by blood flow cytometry; 104 cells were acquired in a flow cytometer with
a 488-nm argon laser (FacsCalibur, Becton Dickinson). The selection of gate R1 of the cell populations that were not marked with
fluorochromes is indicated. Immunophenotyping analysis was carried out in gate R1 for CD11a and CD18. SSC = side angle scattered light; FSC = forward angle scattered light; FITC = fluorescein isothyocyanate.
Figure 2. Migration of bone marrow polymorphonuclear cells from
control and malnourished mice evaluated in an in vitro assay sys
-tem incubated without or with 1.25 µg lipopolysaccharide (LPS). Data are reported as means ± SD for 6 mice in each group. *P ≤
mobilization was completely different between control and malnourished animals. Our study used a high concentration of LPS to induce high levels of cytokine production, and these levels correspond to those reported in Gram-negative
sepsis in vivo (25).
We demonstrated that malnourished animals have a low
ability to trigger leukocyte migration to the lung, which is an important target organ for leukocyte mobilization during
sepsis and malnutrition is often cited as a risk factor for lung
infections (26). Previous study of our group observed fewer
neutrophils in the alveolar septa of malnourished animals
and found that fewer cells accumulated in tissue by trans
-migration across post-capillary venules after endotoxemia. This showed that malnourished animals did not properly recruit leukocytes from the bone marrow to the circulation (27), a fact that may have resulted from a combination of adhesion and migratory defects in these animals.
Adhesion molecules such as CD11a and CD18 play important roles in cell recruitment (28). In the present study, dietary restriction did not significantly reduce the expres
-Figure 3. A, Kinetics of systemic interleukin-1β (IL-1β) production in control and malnourished mice inoculated in
-travenously with 1.25 µg lipopolysaccharide (LPS). Data are reported as means ± SD and the area under the curve of the production. Six mice per group were analyzed at each time point. Analysis of the area under the curve dem
-onstrated that the concentration of IL-1β in mice from the malnourished group was significantly lower than in mice from the control group (180.7 and 591.1 pg·h-1·mL-1, respectively, P ≤ 0.05; t-test). B, Determination of bone marrow
IL-1β. Data are reported as means ± SD IL-1β in the bone marrow supernatant of cells cultured with 1.25 µg LPS for 24 h at a final concentration of 1 x 10⁶ cells/mL, from mice of the control (N = 6) and malnourished (N = 6) groups.
*P ≤ 0.05 compared to control (t-test). C, Spleen IL-1β determination. Data are reported as means ± SD IL-1β in the
spleen supernatant of cells cultured with 1.25 µg LPS for 24 h at a final concentration of 1 x 10⁶ cells/mL, of mice
1170 R.A. Fock et al.
sion of these molecules, although malnourished animals
showed a tendency to have lower CD11a/CD18 expression.
However, we showed that PMN cells from malnourished
animals had a reduced migration capacity in vitro when these cells were stimulated with LPS. The literature shows that animals subjected to protein malnutrition were unable
to induce an acute inflammatory response against a specific antigen, with a dramatic reduction in leukocyte adhesion and
down-regulation of the expression of endothelial intercellular adhesion molecule 1(29).
Thus, the altered leukocyte response observed in malnourished animals is likely to be the result of different
mechanisms. However, data regarding cell mobilization
during malnutrition are also divergent (30). Leukocyte
transmigration through the vessel wall and through tissue
toward an inflammatory site is crucial in the development of the inflammatory response. Leukocyte migration through tissue is influenced by the tissue architecture and by the
composition of the local extracellular matrix (31).
This reduction in the capacity to respond to an infectious stimulus may be partly due to alterations in the extracel -lular matrix observed in malnourished animals (7,8). The
alteration in the mobilization of inflammatory cells may be due to a smaller availability of these cells in the circulation
and at hematopoietic sites and also to the hampering of
chemotaxis and leukocyte migration, which results from changes in adhesion proteins such as fibronectin present
on the cell surface as well as the decreased production of
chemotactic cytokines such as IL-8 and a lower expres -sion of selectins and integrins (7,32). The production of hematopoietic cells, as well as the cell migration into and out of bone marrow, are critical for normal homeostasis of
the circulating pool of leukocytes and lymphoid organs (33).
In this context, our group has demonstrated that
protein-energy malnutrition alters the production of hematopoietic cells, showing that progenitor cells are stopped in the G0/ G1 phase of the cell cycle (6).
It is known that LPS has multiple and divergent effects on
mono/macrophages and PMN cells, as it regulates cellular functions such as cell motility, and stimulates the synthesis of inflammatory mediators. LPS induction of IL-1β is rapid and transient, and the kinetics of IL-1β production can be physiologically related to the inflammatory response induced by this potent bacterial toxin. It should be emphasized that the systemic effects of this cytokine are quite different from
their local effects, which are well tolerated by the organism as a whole. Pro-inflammatory cytokines such as IL-1β and TNF-α increase circulating neutrophils by releasing them
from marginated pools (32,34-37).
Our results showed that malnourished animals had
distinct kinetics of IL-1β synthesis and a lower IL-1β
concentration in the circulation after endotoxemia. The in vitro experiments confirmed these results, showing that malnourished animals do not have the same capacity to produce IL-1β, and since the number of cells used for in vitro experiments were normalized in both groups, we can
infer that the reduced production of IL-1β is probably an intrinsic problem and not a consequence of hypoplasia
and a possible decrease of immune cells observed dur-ing malnutrition. Our group demonstrated that cells from
malnourished animals have a lower capacity to activate the transcription factor NF-κB, which is involved in the transcrip
-tion of pro-inflammatory genes including IL-1β (13), and this could explain the decreased IL-1β synthesis.
IL-1β interacts with different cell lineage receptors that can produce a local or systemic response and result in a different intensity of activation (35). Uncontrolled production of this inflammatory cytokine may lead to serious systemic complications such as microcirculatory dysfunction, tissue
damage, and septic shock (36). In this context, our previous data (38) demonstrated that malnourished animals stimulated with LPS produce more IL-10 and this uncontrolled balance
between pro-inflammatory and anti-inflammatory cytokines
could explain, in part, what happens, leading us to infer that
uncontrolled production of IL-1β with high levels of IL-10 leads to the immune deficiency common in malnutrition.
The impaired number of leukocytes migrating to the lungs
with reduced neutrophil mobilization could be due to several mechanisms, such as rolling adhesion and impaired
migra-tion (34,39); however, one of the mechanisms that might explain this impairment is reduced IL-1β levels, which would contribute to attenuated leukocytosis.
In light of the data obtained in the present study, we
showed that malnourished animals exhibit a reduction in the parameters evaluated and do not respond with the same
in-tensity or in the same manner as well-nourished animals.
Acknowledgments
Research supported by FAPESP.
References
1. Scrimshaw NS. INCAP studies of nutrition and infection. Food Nutr Bull 2010; 31: 54-67.
2. Keusch GT. The history of nutrition: malnutrition, infection and immunity. J Nutr 2003; 133: 336S-340S.
3. Waitzberg DL, Caiaffa WT, Correia MI. Hospital malnutrition:
the Brazilian national survey (IBRANUTRI): a study of 4000
patients. Nutrition 2001; 17: 573-580.
4. Catchatourian R, Eckerling G, Fried W. Effect of short-term pro
-tein deprivation on hemopoietic functions of healthy volunteers.
Blood 1980; 55: 625-628.
5. Fried W, Barone SJ, Anagnostou A. Effect of protein deprivation on hematopoietic stem cells and on peripheral blood counts. J Lab Clin Med 1978; 92: 303-310.
et al. Protein-energy malnutrition halts hemopoietic progenitor cells in the G0/G1 cell cycle stage, thereby altering cell produc -tion rates. Braz J Med Biol Res 2009; 42: 523-530.
7. Xavier JG, Favero ME, Vinolo MA, Rogero MM, Dagli ML, Arana-Chavez VE, et al. Protein-energy malnutrition alters his -tological and ultrastructural characteristics of the bone marrow and decreases haematopoiesis in adult mice. Histol Histopathol
2007; 22: 651-660.
8. Vituri CL, Alvarez-Silva M, Trentin AG, Borelli P. Alterations in
proteins of bone marrow extracellular matrix in undernourished mice. Braz J Med Biol Res 2000; 33: 889-895.
9. Keenan RA, Moldawer LL, Yang RD, Kawamura I, Blackburn GL, Bistrian BR. An altered response by peripheral leukocytes to synthesize or release leukocyte endogenous mediator in critically ill, protein-malnourished patients. J Lab Clin Med 1982;
100: 844-857.
10. Grimble RF. Interaction between nutrients, pro-inflammatory cytokines and inflammation. Clin Sci 1996; 91: 121-130.
11. Landgraf MA, Martinez LL, Rastelli VM, Franco MC, Soto-Suazo M, Tostes RC, et al. Intrauterine undernutrition in rats
interferes with leukocyte migration, decreasing adhesion molecule expression in leukocytes and endothelial cells. J Nutr
2005; 135: 1480-1485.
12. Dulger H, Arik M, Sekeroglu MR, Tarakcioglu M, Noyan T, Cesur Y, et al. Pro-inflammatory cytokines in Turkish children with protein-energy malnutrition. Mediators Inflamm 2002; 11:
363-365.
13. Fock RA, Rogero MM, Vinolo MA, Curi R, Borges MC, Borelli
P. Effects of protein-energy malnutrition on NF-kappaB signal -ling in murine peritoneal macrophages. Inflammation 2010; 33:
101-109.
14. Fock RA, Vinolo MA, de Moura de Sa Rocha V, de Sa Rocha
LC, Borelli P. Protein-energy malnutrition decreases the ex
-pression of TLR-4/MD-2 and CD14 receptors in peritoneal macrophages and reduces the synthesis of TNF-alpha in re
-sponse to lipopolysaccharide (LPS) in mice. Cytokine 2007; 40:
105-114.
15. Bhaskaram P, Sivakumar B. Interleukin-1 in malnutrition. Arch Dis Child 1986; 61: 182-185.
16. Borelli P, Mariano M, Borojevic R. Protein malnutrition: effect
on myeloid cell production and mobilization into inflammatory
reactions in mice. Nutr Res 1995; 15: 1477-1485.
17. Reeves PG, Nielsen FH, Fahey GC Jr. AIN-93 purified diets for laboratory rodents: final report of the American Institute of
Nutrition ad hoc writing committee on the reformulation of the AIN-76A rodent diet. J Nutr 1993; 123: 1939-1951.
18. Ward PG. A micro-Kjeldahl procedure for field use. J Med Lab Technol 1963; 20: 191-195.
19. Dacie JV, Lewis SM. Practical haematology. New York: Churchill
Livingstone; 1995.
20. Israels T, van de Wetering MD, Hesseling P, van Geloven N, Ca
-ron HN, Molyneux EM. Malnutrition and neutropenia in children treated for Burkitt lymphoma in Malawi. Pediatr Blood Cancer
2009; 53: 47-52.
21. Waterlow JC. Letter: Evolution of kwashiorkor and marasmus.
Lancet 1974; 2: 712.
22. Schkenasy A, Jobard P. [Tissular distribution of eosinophilic granulocytes, in the rat made eosinopenic by prolonged protein deficiency]. Nouv Rev Fr Hematol 1961; 1: 202-212.
23. Ahens JW, Raab SO, Haab OP, Mauer AM, Ashenbrucker H,
Cartwright GE, et al. Leukokinetic studies. III. The distribution of granulocytes in the blood of normal subjects. J Clin Invest 1961;
40: 159-164.
24. Kampschmidt RF, Upchurch HF. Possible involvement of
leu-kocytic endogenous mediator in granulopoiesis. Proc Soc Exp Biol Med 1977; 155: 89-93.
25. Redl H, Bahrami S, Schlag G, Traber DL. Clinical detection of
LPS and animal models of endotoxemia. Immunobiology 1993;
187: 330-345.
26. O’Dea KP, Wilson MR, Dokpesi JO, Wakabayashi K, Tatton
L, van Rooijen N, et al. Mobilization and margination of bone
marrow Gr-1high monocytes during subclinical endotoxemia predisposes the lungs toward acute injury. J Immunol 2009;
182: 1155-1166.
27. Fock RA, Xavier JG, Borelli P. Histology alterations in response to lipopolysaccharide (LPS) in a murine model of protein-energy
malnutrition. Rev Eletr Farm 2009; 2: 85-101.
28. Khunkaewla P, Schiller HB, Paster W, Leksa V, Cermak L,
An-dera L, et al. LFA-1-mediated leukocyte adhesion regulated by
interaction of CD43 with LFA-1 and CD147. Mol Immunol 2008;
45: 1703-1711.
29. Barja-Fidalgo C, Souza EP, Silva SV, Rodrigues AL, Anjos-Valotta EA, Sannomyia P, et al. Impairment of inflammatory
response in adult rats submitted to maternal undernutrition
during early lactation: role of insulin and glucocorticoid. Inflamm Res 2003; 52: 470-476.
30. Chandra RK, Kumari S. Nutrition and immunity: an overview. J Nutr 1994; 124: 1433S-1435S.
31. Sixt M, Hallmann R, Wendler O, Scharffetter-Kochanek K, Sorokin LM. Cell adhesion and migration properties of beta
2-integrin negative polymorphonuclear granulocytes on defined extracellular matrix molecules. Relevance for leukocyte extrava -sation. J Biol Chem 2001; 276: 18878-18887.
32. Carlos TM, Harlan JM. Leukocyte-endothelial adhesion mol -ecules. Blood 1994; 84: 2068-2101.
33. Badolato R. Leukocyte circulation: one-way or round-trip? Les
-sons from primary immunodeficiency patients. J Leukoc Biol
2004; 76: 1-6.
34. Meager A. Cytokine regulation of cellular adhesion molecule expression in inflammation. Cytokine Growth Factor Rev 1999;
10: 27-39.
35. Auron PE, Webb AC. Interleukin-1: a gene expression system
regulated at multiple levels. Eur Cytokine Netw 1994; 5:
573-592.
36. Watson RW, Redmond HP, Bouchier-Hayes D. Role of en
-dotoxin in mononuclear phagocyte-mediated inflammatory
responses. J Leukoc Biol 1994; 56: 95-103.
37. Yang CM, Luo SF, Hsieh HL, Chi PL, Lin CC, Wu CC, et al.
Interleukin-1beta induces ICAM-1 expression enhancing
leukocyte adhesion in human rheumatoid arthritis synovial fibroblasts: involvement of ERK, JNK, AP-1, and NF-kappaB. J Cell Physiol 2010; 224: 516-526.
38. Fock RA, Vinolo MA, Crisma AR, Nakajima K, Rogero MM,
Borelli P. Protein-energy malnutrition modifies the production of interleukin-10 in response to lipopolysaccharide (LPS) in a
murine model. J Nutr Sci Vitaminol 2008; 54: 371-377.
39. Glauser MP, Zanetti G, Baumgartner JD, Cohen J. Septic shock: