www.bjournal.com.br
www.bjournal.com.br
Braz J Med Biol Res, December 2012, Volume 45(12) 1221-1233
10.1590/S0100-879X2012007500137
doi:
Relationships between dendritic morphology, spatial distribution
and firing patterns in rat layer 1 neurons
D.V.V. Santos, K.M. Costa, M.C.G. Vaz and M. Da Silva Filho
Institutional Sponsors
The Brazilian Journal of Medical and Biological Research is partially financed by
Faculdade de Medicina de Ribeirão Preto Campus
Ribeirão Preto
Explore High - Performance MS Orbitrap Technology In Proteomics & Metabolomics
analiticaweb.com.br S C I E N T I F I C
BIOMEDICAL SCIENCES
AND
Relationships between dendritic morphology,
spatial distribution and firing patterns
in rat layer 1 neurons
D.V.V. Santos, K.M. Costa, M.C.G. Vaz and M. Da Silva Filho
Laboratório de Biofísica Celular, Instituto de Ciências Biológicas, Universidade Federal do Pará, Belém, PA, Brasil
Abstract
The cortical layer 1 contains mainly small interneurons, which have traditionally been classified according to their axonal morphology. The dendritic morphology of these cells, however, has received little attention and remains ill defined. Very little is known about how the dendritic morphology and spatial distribution of these cells may relate to functional neuronal proper-ties. We used biocytin labeling and whole cell patch clamp recordings, associated with digital reconstruction and quantitative morphological analysis, to assess correlations between dendritic morphology, spatial distribution and membrane properties of rat layer 1 neurons. A total of 106 cells were recorded, labeled and subjected to morphological analysis. Based on the quantitative patterns of their dendritic arbor, cells were divided into four major morphotypes: horizontal, radial, ascendant, and descendant cells. Descendant cells exhibited a highly distinct spatial distribution in relation to other morphotypes, suggesting that they may have a distinct function in these cortical circuits. A significant difference was also found in the distribution of firing patterns between each morphotype and between the neuronal populations of each sublayer. Passive membrane prop -erties were, however, statistically homogeneous among all subgroups. We speculate that the differences observed in active membrane properties might be related to differences in the synaptic input of specific types of afferent fibers and to differences in the computational roles of each morphotype in layer 1 circuits. Our findings provide new insights into dendritic morphology and neuronal spatial distribution in layer 1 circuits, indicating that variations in these properties may be correlated with distinct physiological functions.
Key words: Biocytin; Patch-clamp; Dendritic morphology; Layer 1; Neuronal variability
Introduction
Correspondence: D.V.V. Santos, Laboratório de Biofísica Celular, Instituto de Ciências Biológicas, Universidade Federal do Pará, Rua Augusto Corrêa, 1, 66075-110 Belém, PA, Brasil. E-mail: [email protected]
Received January 12, 2012. Accepted August 15, 2012. Available online August 31, 2012. Published December 17, 2012..
Cortical layer 1 is composed mainly of small, non-pyramidal, GABAergic neurons (1-3). These cells typically
receive input from dense axonal fibers of intracortical and subcortical origin, and their own axons synapse onto the
apical dendrites of pyramidal cells and other layer 1 neu-rons (1,3,4).
There are many hypotheses concerning the physiologi-cal role of layer 1 neurons. Vogt (1) argued that one of the es-sential functions of layer 1 circuits is event holding, similarly to a “sample and hold” function of electronic circuits. It has also been proposed that these cells may provide feedfoward inhibition with incoming information, thus modulating the response of underlying cortical circuits by direct inhibition or disinhibition (5). Other models suggest that these net-works may integrate intracortical and thalamical input in
a coherent, time-sensitive manner (6). Another proposed function is that layer 1 interneurons provide tonic inhibition to underlying cortical layers in physiological conditions, thus playing an important role in determining the degree of
general excitability of the neocortex (4). Recently, Zhu and Zhu (7), using in vivo intracellular recordings and applying realistic sensory stimulation protocols, concluded that layer 1 circuits may also selectively amplify salient sensory input that arrives at different cortical layers.
Which of these complex mechanisms (or if, to some extent, all of them) represent the main function of this corti -cal layer is a highly debated issue. There is also very little conclusive information about the dynamics of local layer
1 circuits. With the exception of Cajal-Retzius cells, which
cortex (2,8), the specific function of other classes of layer 1 neurons remains ill defined.
The lack of a comprehensive, quantitative classification
of these cells is still a major hindrance for evaluating the functional roles of layer 1 interneurons. Previous efforts
by Zhou and Hablitz (2,5,9,10) and Hestrin and Armstrong
(11), in spite of providing crucial insights into the general morphology, membrane properties, synaptic physiology, and development of layer 1 neurons, have failed to produce a robust morphophysiological categorization of these cells, in large part due to the low number of studied neurons and the use of purely qualitative morphological analysis.
Traditionally, cortical interneurons have been classified according to their axonal arbor (12), leading to the mainly
qualitative segregation of these cells into groups such as
neurogliaform cells (small cells with dense axonal arboriza
-tion) or chandelier cells (neurons whose axonal clusters are highly ramified and at shallow angles) (12). The dendritic
morphological properties of these neurons have, however, been conspicuously overlooked, in great part due to the notion that the interneuron dendritic arbor is so variable
that no significant correlation can be obtained by studying
it (12). Nonetheless, there is surmounting evidence that
the computational processes executed by single neurons
are mainly dependent on their dendritic properties (13-15), which makes dendritic morphology a crucial parameter in understanding how neurons integrate synaptic input.
The aim of the present study was to evaluate the pos-sible relationships between the dendritic morphology, spatial distribution and electrophysiological characteristics of layer
1 interneurons of the rat neocortex. In order to accomplish
this goal, we used whole cell patch-clamp recordings as-sociated with biocytin staining followed by the digital recon-struction of the dendritic morphology of labeled neurons. Our main hypothesis was that neuronal populations with different dendritic properties may serve distinct functions in the layer 1 circuitry, which could in turn be associated
with specific firing patterns or other electrophysiological
characteristics. We, therefore, categorized the recorded and labeled cells according to the quantitative morphological parameters of their dendritic processes, their distribution
in the sublayer strata of layer 1 and their firing patterns.
We then determined if there was any statistical correla-tion between their morphological (morphotype and spatial distribution) and electrophysiological (active and passive
membrane properties) characteristics. Our findings shed
new light on the relationship between dendritic morphology and the physiological function of cortical interneurons and provide a novel background for the study on the overall functions of layer 1.
Material and Methods
Brain slice preparation
All experiments were carried out in accordance with the
National Institute of Health Guide for the Care and Use of Laboratory Animals (NIH Publications No. 80-23, revised 1996), and were approved by the Ethics Research Com
-mittee for Animal Experiments of the Instituto de Ciências
Biológicas, Universidade Federal do Pará.
Slices of rat primary visual cortex (area 17) were pre -pared according to the procedures described by Edwards et al. (16). In brief, young Wistar rats (14-21 days of postnatal life) were decapitated, and the brain was rapidly removed
from the skull and immersed in ice-cold artificial cerebro
-spinal fluid (ACSF). Brain slices were cut on a vibratome
(Pelco, USA) at 250 µm thickness and stored at room tem-perature (23°C) for 1 h in ACSF constantly bubbled with a
carbogenic mixture (95% O2, 5% CO2) before the recording
procedures. Individual slices were placed in a recording
chamber mounted on the stage of a Zeiss Axioskop 2 FS Plus microscope (Carl Zeiss AG, Germany). The record -ing chamber was constantly perfused with ACSF at a rate
of 4 mL/min, resulting in a complete solution exchange
every 5 min. The ACSF bath solution contained 125 mM
NaCl, 3.5 mM KCl, 2 mM CaCl2, 1.3 mM MgCl2, 26 mM
NaHCO3, and 10 mM D-glucose. The perfusing solution
was also continuously bubbled with 95% O2 and 5% CO2
to maintain the pH at 7.4.
Electrophysiological recordings
Individual cells were visualized using a 40-X water
im-mersion objective with 3.3-mm working distance (Carl Zeiss
AG) and Nomarski optics. Layer 1 neurons were located using the pial surface and the border between layer 1 and
layer 2/3 as reference points. Cells were recorded and filled
across the entire thickness of the layer.
Patch recording electrodes made of borosilicate glass
(BF150-110-10, Sutter Instrument Co., USA) and with a 4-5
MΩ resistance in bathing solution were used for intracellular recordings. The micropipettes were filled with a solution
containing 125 mM K-gluconate, 10 mM KCl, 10 mM
N-hydroxyethyl-piperazine-N’-2-ethanesulfonic acid, 2 mM
Mg-ATP, 0.2 mM Na-GTP, and 0.5 mM ethylene glycol-bis
(β-aminoethyl ether) N,N,N’,N’-tetraacetic acid. Biocytin (Sigma-Aldrich, USA) at 0.6% was also included in the patch electrode filling solution and allowed to diffuse into the cell. The liquid junction potential, which averaged 8.53 mV, was
automatically calculated and corrected using pClamp 10.2 software applications before each analysis.
Seal resistance was always >5 GΩ before breaking into
whole cell mode. The resting membrane potential (RMP) was measured immediately after this event. The effects
of membrane potential on the firing properties of layer 1
neurons were evaluated by evoking action potentials with depolarizing current pulses (10 to 100 pA) while cells were held at the membrane potential of -100 mV. Input resistance
(Rin) was measured by injecting small hyperpolarizing
cur-rent pulses (-10 to -100 pA).
mode using a Multiclamp 700 B amplifier (Molecular De-vices, USA). Digital data acquisition and analysis were
per-formed using the pClamp 10.2 software (Molecular Devices).
At the end of the each recording, cells were maintained at -65 mV for 10 min in order to increase biocytin transport into remote processes. After this procedure the slices were
transferred to 4% paraformaldehyde in 0.1 M phosphate-buffered saline, pH 7.5, and fixed for 24-48 h at 4°C.
Histological processing
Tissue samples were processed as described by
Horikawa and Armstrong (17). In brief, slices were rinsed in 0.1 M Na-phosphate buffer and then treated with 1% H2O2
for 2-3 h at room temperature. Next, they were incubated for 12 h at 4°C in blocking serum containing 2% bovine serum, 1% bovine serum albumin, and 0.4% Triton X-100.
After rinsing, the sections were incubated with the
avidin-biotin-peroxidase complex (Vectastain Elite ABC kit; 1:100; Vector Laboratories, USA) in 1% bovine serum albumin for
4 h. Sections were rinsed, stained with 3,3-diaminobenzi-dine, mounted on gelatin-coated glass slides, dehydrated, and covered with a coverslip. The Nissl method was used for counterstaining.
Data analysis
The membrane time constant (τ) was calculated
accord-ing to the method proposed by Rall (15). In brief, we applied Equation 1 using the pClamp 10.2 software.
C
e
A
t
f
t in
i
i
+
=
−=
∑
/τ1
)
(
(Equation 1)
In this equation, t represents time, C represents the
steady-state asymptote, Ai represents the relative amplitude at the
start of the fit region, and e is the Euler number.
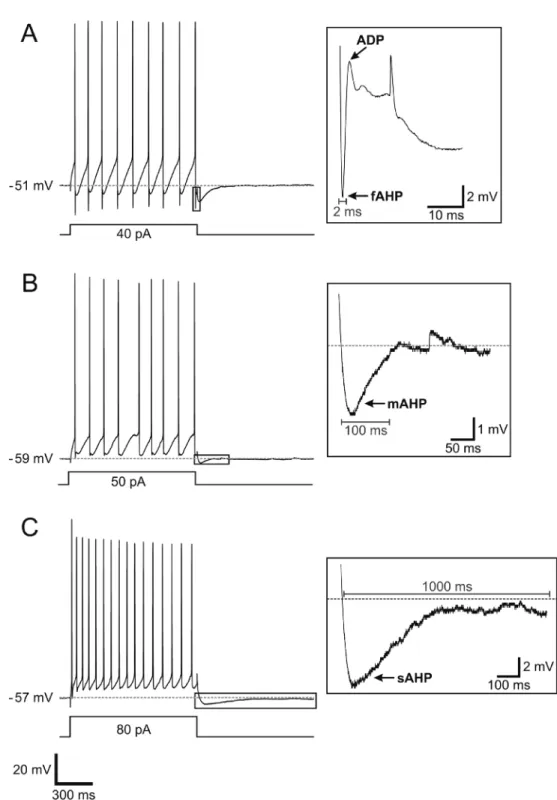
After-potentials were then identified and measured according to the definition of Storm (18). According to this study, hyperpolarizations can be subdivided into fast (fAHP), slow (sAHP) and medium (mAHP) according to their kinetics and underlying currents. fAHPs last about 2-5 ms and are followed by repolarization; mAHPs last between 50 and 100 ms and sAHPs last about 1-2 s. In our experiments, all AHPs were measured after a train of action potentials. fAHPs, mAHPs, and sAHPs were measured in relation
to the membrane threshold, i.e., the membrane potential immediately prior to the initiation of the action potential. This threshold represents the membrane potential where
there is a maximum opening probability of voltage-gated
sodium channels for the generation of an action potential and is classically used for calculating the amplitude of after-potentials (2). After-depolarization after-potentials (ADPs) were
measured in relation to the peak of the preceding fAHP
(2). The remaining active and passive electrophysiological
properties were analyzed using computer-generated
com-mands in the Clampfit 10.2 software interface.
According to Vogt (1), layer 1 can be divided into three sub-laminae according to physiological and anatomical characteristics, including the origin and distribution of input
fibers. In our study, layer 1 neurons were grouped accord -ing to their relative distance from the inferior pial surface and the limit between layer 1 and layer 2/3 (Figure 1). This was done in order to assess possible correlations between morphophysiological parameters and spatial distribution of layer 1 cells. Neurons located in the upper third of the layer
were classified as “superior cells”, those positioned in the middle third were classified as “medial cells”, and those in the lower third were classified as “inferior cells”. The pro -portional distance from the reference points was calculated based on the local thickness of layer 1 for each cell. The limits of each sub-layer were determined separately for each cell while the proportion ratio was always kept constant, so as to not generate any bias related to tissue remodeling induced by histological processing.
Biocytin-labeled neurons were photographed with a
Zeiss Axiophot camera (Carl Zeiss AG) in 2-µm discrete steps along the Z-axis. Individual focal planes were merged
and digital reconstructions of the cells were made using
the Neuron J plug-in for ImageJ (19). Some representative
cells were also drawn by hand using a camera lucida, for
expositional purposes. The dendritic orientation of individual
neurons and the compound morphological groups were plotted as polar histograms using a customized script for
Matlab R2008a (Mathworks, USA). In brief, the surround
-ing area of the soma was defined as a circle centered in
the middle of the soma and divided into 15° arches. The
length of the dendrites confined to each arch was measured
using Neuron J. The arches were then grouped into two
100° arches above and below the soma and two 80° arches laterally to the soma and the total dendritic length confined
to each arch group was quantified and plotted in the graph. Morphotypical classifications were then made according to
the distribution of dendritic clusters in the aforementioned arches. Similar analytical methods have been described by
Hamam et al. (20) and Romanova et al. (21).
Ramification patterns of the dendritic arbors were
evaluated with the Sholl analysis method (22,23) using the Sholl Analysis plug-in for ImageJ (24). In brief, the software generates a series of concentric circles centered at the
neu-ron’s soma in such a manner that each circle has a radius
that is 5 µm greater than its predecessor in the series. The software then superimposes the circles on the image of the cell and counts how many times the neuronal processes intersect with the circumference of each circle. General morphological parameters such as the total dendritic length were evaluated with the aid of the Neuron J plug-in.
All quantitative results, unless noted, are reported as means ± SEM. For continuous numerical variables, such as the passive membrane properties, statistical comparisons
were made using Kruskal-Wallis ANOVA (α = 0.05). Differ -ences in the statistical distribution of qualitative variables,
such as the proportion of distinct firing patterns, were
evaluated with the G-test, a more powerful and accurate
version of the chi-square test (α = 0.05).
Results
A total of 244 cells were recorded, of which 106 were successfully labeled and recovered for morphological analysis. The recovered cells were divided into four major morphotypes according to the quantitative orientation of their
dendritic arbors (Figures 2 and 3). Dendritic field orientation
was the main parameter for morphological segregation, as
it is tightly related to the nature of the neuron’s synaptic
input (1,14,20). Neuronal morphotypes were established ac-cording to the distribution of dendritic clusters in a polar plot (Figure 4). The established morphotypes were: horizontal
cells (26.4% of total cells; 28/106), defined by having over 50% of their dendritic processes concentrated in an 80° arch lateral to the soma; radial cells (38.7%; 41/106), which
were neurons where the dendritic cluster distribution did not show a preferential distribution, i.e., their dendritic clusters
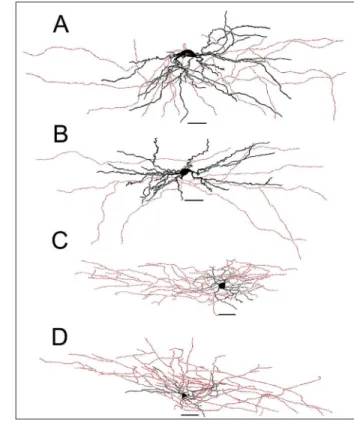
Figure 2. Examples of camera-lucida drawings of
biocytin-labeled layer 1 cells. A, B, Ascendant cells, defined by their
dendritic projections (black), which extend upwards in relation to the cell body. The neuron in A exhibited a d-NAC firing pat -tern, while the neuron in B exhibited a c-AC firing pattern. C,
D, Descendant cells, defined by their dendritic arbor, which
projects downwards from the cell body. Axon arborization (red) was not evaluated in this study. Scale bar = 50 µm. d-NAC = delayed non-accommodating cell; c-AC = classic accommo -dating cell.
Figure 3. Examples of camera lucida drawings of biocytin-labeled
layer 1 cells. A, B, Horizontal cells, defined by their dendritic ar -bors (black), which project horizontally from the cell body. The neuron in A exhibited a c-NAC firing pattern, while the neuron in B exhibited a c-STUT firing pattern. C, D, Radial cells, defined
by their irregular dendritic arbor in all directions. The neuron in C
exhibited a c-NAC firing pattern, while the neuron in D exhibited
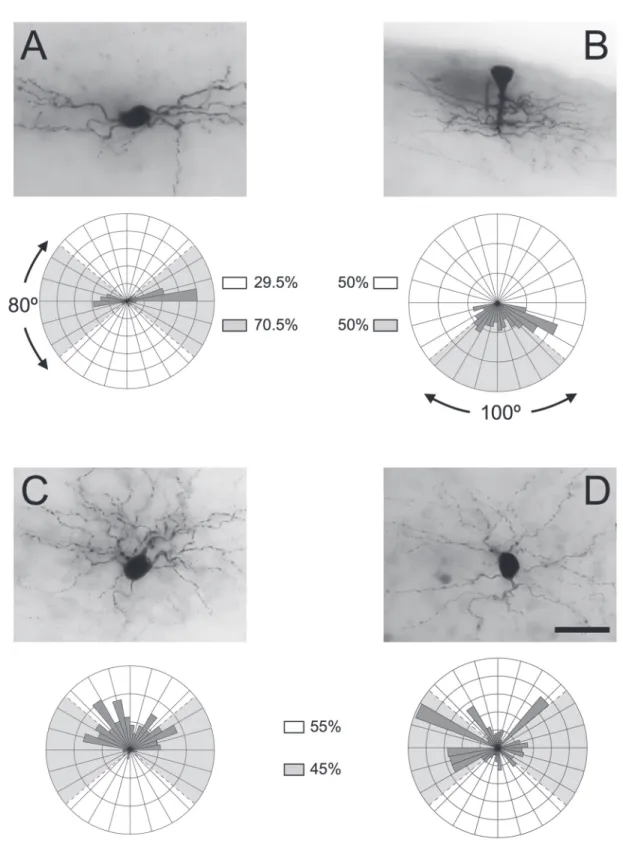
Figure 4. Morphological subtypes of labeled layer 1 neurons. A-D, Micrographs of representative cells for each subtype (horizon-tal, descendant, ascendant, and radial, respectively), alongside their respective representative polar histograms. The neuron in
A exhibited a c-NAC firing pattern, the neuron in C exhibited a d-NAC firing pattern and the neuron in D exhibited a c-NAC firing
did not show a 50% overlap with any of the established analytical regions; ascendant cells (20.8%; 22/106), which had over 50% of their dendritic arbors projecting above to
the region directly above the soma, and descendant cells
(12.3% of the total cells analyzed; 13/106), whose dendrites projected mainly directly below the soma (over 70%). A few cells (1.8%; 2/106) were too irregular to be classified into the established morphotypes and were left unclassified.
About 25% (7/28) of horizontal cells had dendritic clusters that projected mainly unilaterally and 75% (21/28)
bilaterally. They also had, in general, an ellipsoid and small soma. Radial cells had a round or irregular cell body; as-cendant cells usually had round or ellipsoid cell bodies, and descendant cells had an irregular or elongated cell body. Among descendant cells, a particular subtype can be distinguished, i.e., the subpial cells. These cells, also
called “vertical cells” by Bradford et al. (25) and Zhou and
Hablitz (5), represented 76.9% (10/13) of the descendant
cell population. They were located only immediately under the pial border, possessed particularly long cell bodies and
had a singular pattern of dendritic ramification, with a large
number of dendrites being emitted laterally and downwards from the cell body. Even though these cells may be a distinct subtype on their own, because of their relative scarcity in our total sample size (10 of 106 cells) they were grouped with other descendant cells for all analytical purposes.
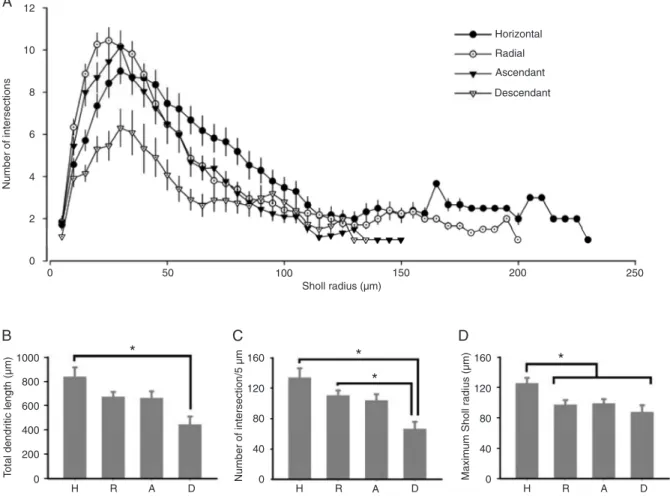
Sholl analysis revealed that all layer 1 neurons achieved their peak branching at about 25-30 µm of distance from the
soma (Figure 5A). Horizontal, radial and ascendant cells had branching peaks of similar value, i.e., approximately 9-10 ramifications. Descendant cells, however, exhibited a significantly smaller peak in ramification (6.3 ± 0.89 inter
-sections; P = 0.0107). We found significant differences in
the number of intersections per 5 µm, total dendritic length
Figure 5. Morphological properties of labeled layer 1 neurons. Measurements were made for all horizontal (H; N = 28), radial (R; N
= 41), ascendant (A; N = 22), and descendant (D; N = 13) cells. A, Sholl analysis of each morphological subtype. B, Total dendritic length of each morphotype. Note the significant difference between horizontal and descendant cells. C, Number of intersections per 5 µm for each morphotype. Note that descendant cells differ from horizontal and radial neurons regarding this parameter, but horizontal and radial cells do not differ between each other. D, Maximum Sholl radius for each morphotype. Note that the horizontal cells differ
and maximum Sholl radius between morphotypes (Figure
5B-D). Descendant cells had consistently smaller total dendritic lengths than horizontal cells and a lower number of intersections per 5 µm than horizontal and radial neurons
(Figure 5C). Horizontal cells had a larger maximum Sholl
radius than all other subtypes (Figure 5D).
For the analysis of the spatial distribution of layer 1 neurons, we divided the layer into three equally sized sub-layers (superior, medial, and inferior sublayers) according to their distance from the pial surface and the border with cortical layer 2/3 (1). The distribution of morphologically distinct populations across these sub-lamina of layer 1
was highly unequal (P < 0.01),
with the descendant cells showing a highly different spatial organization in relation to the remaining subtypes. Descendant neurons were especially concentrated in the
superior sublayer (76.9% of
all descendant cells; 10/13), relatively rare in the medial
sublayer (23.1%; 3/13) and
were totally absent from the inferior sublayer.
The distribution of the remaining morphotypes was statistically similar, with most non-descendant cells being concentrated in the medial
sublayer (≈50% of all non-descendant cells; 44/92) and
being common in the inferior
one (≈30-40%; 34/92). Ap
-proximately 10-20% (14/92)
of non-descendant cells were located in the superior
sub-layer. Horizontal, ascendant
and radial cells thus made up the whole population of the inferior sublayer, as no descendant cells where found in this stratum.
Electrophysiological pa-rameters of recorded layer 1 interneurons are summarized in Tables 1, 2, and 3.
Sponta-neous action potentials were rare and were not investigated.
Passive membrane properties and the firing frequency of
each morphotype and sublayer can be seen in Figure 6.
These parameters were not significantly different among
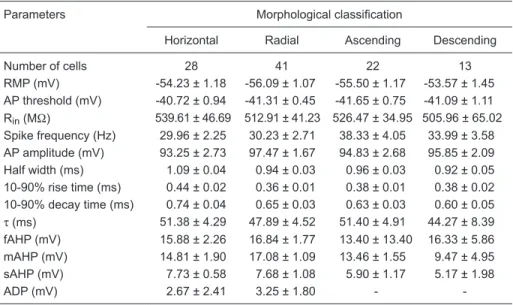
Table 1. Summary of electrophysiological parameters in relation to morphological classification.
Parameters Morphological classification
Horizontal Radial Ascending Descending
Number of cells 28 41 22 13
RMP (mV) -54.23 ± 1.18 -56.09 ± 1.07 -55.50 ± 1.17 -53.57 ± 1.45 AP threshold (mV) -40.72 ± 0.94 -41.31 ± 0.45 -41.65 ± 0.75 -41.09 ± 1.11 Rin (MΩ) 539.61 ± 46.69 512.91 ± 41.23 526.47 ± 34.95 505.96 ± 65.02
Spike frequency (Hz) 29.96 ± 2.25 30.23 ± 2.71 38.33 ± 4.05 33.99 ± 3.58 AP amplitude (mV) 93.25 ± 2.73 97.47 ± 1.67 94.83 ± 2.68 95.85 ± 2.09 Half width (ms) 1.09 ± 0.04 0.94 ± 0.03 0.96 ± 0.03 0.92 ± 0.05 10-90% rise time (ms) 0.44 ± 0.02 0.36 ± 0.01 0.38 ± 0.01 0.38 ± 0.02 10-90% decay time (ms) 0.74 ± 0.04 0.65 ± 0.03 0.63 ± 0.03 0.60 ± 0.05
τ (ms) 51.38 ± 4.29 47.89 ± 4.52 51.40 ± 4.91 44.27 ± 8.39 fAHP (mV) 15.88 ± 2.26 16.84 ± 1.77 13.40 ± 13.40 16.33 ± 5.86 mAHP (mV) 14.81 ± 1.90 17.08 ± 1.09 13.46 ± 1.55 9.47 ± 4.95
sAHP (mV) 7.73 ± 0.58 7.68 ± 1.08 5.90 ± 1.17 5.17 ± 1.98
ADP (mV) 2.67 ± 2.41 3.25 ± 1.80 -
-Data are reported as means ± SEM. RMP = resting membrane potential; AP = action potential; Rin = input resistance; τ = membrane time constant; fAHP = fast after-hyperpolarization potentials;
mAHP = medium after-hyperpolarization potentials; sAHP = slow after-hyperpolarization poten -tials; ADP = after-depolarization potentials.
Table 2. Summary of electrophysiological parameters in relation to spatial distribution.
Parameters Spatial distribution
Whole layer 1 Superior Medial Inferior
Number of cells 105 24 47 34
RMP (mV) -56.64 ± 6.32 -55.45 ± 7.14 -54.86 ± 5.65 -56.11 ± 5.16 AP threshold (mV) -41.52 ± 6.21 -40.27 ± 4.71 -41.09 ± 2.83 -42.31 ± 2.61 Rin (MΩ) 500.25 ± 197.62 509.36 ± 191.27 515.35 ± 220.75 530.50 ± 203.58
Spike frequency (Hz) 30.99 ± 14.03 32.51 ± 10.05 34.14 ± 17.24 31.05 ± 13.00 AP amplitude (mV) 96.31 ± 10.99 93.88 ± 9.88 92.71 ± 9.84 99.77 ± 12.12 Half width (ms) 0.94 ± 0.20 0.94 ± 0.19 0.94 ± 0.21 1.02 ± 0.21 10-90% rise time (ms) 0.37 ± 0.09 0.37 ± 0.08 0.37 ± 0.08 0.41 ± 0.09 10-90% decay time (ms) 0.63 ± 0.16 0.62 ± 0.14 0.64 ± 0.19 0.70 ± 0.17
τ (ms) 43.66 ± 20.43 45.01 ± 23.38 45.63 ± 22.37 47.74 ± 21.82 fAHP (mV) 17.48 ± 6.05 18.89 ± 5.30 20.38 ± 6.38 13.91 ± 3.62 mAHP (mV) 14.36 ± 5.38 17.41 ± 5.32 16.89 ± 4.79 12.22 ± 5.73
sAHP (mV) 5.42 ± 3.55 6.90 ± 5.31 6.68 ± 3.45 5.31 ± 2.49
ADP (mV) 4.90 ± 3.90 6.53 ± 3.11 7.00 ± 2.70 3.46 ± 3.38
Data are reported as means ± SEM. RMP = resting membrane potential; AP = action potential; Rin = input resistance; τ = membrane time constant; fAHP = fast after-hyperpolarization potentials;
the studied subdivisions of layer 1 neurons (P > 0.05).
Of the 244 recorded cells, 219 were submitted to suc -cessive depolarizing pulses and their active properties were
investigated. All recorded cells were capable of repetitive fir -ing, with variable frequencies.
Of these 219 studied neurons, 93.61% (205/219) showed lit -tle or no frequency adaptation;
59.82% (131/219) of neurons presented fAHPs, 72.15% (158/219) presented mAHPs, 76.71% (168/219) presented sAHPs, and 74.20% (53/219) exhibited ADPs. It should be
noted that we did not observe
co-occurrence of an mAHP and sAHP in a single cell dur
-ing our experiments, which is
in agreement with previous
studies by Zhou and Hablitz
(2). The mean amplitudes of these after-potentials are presented in Tables 1, 2, and 3. Representative recordings of each type of after-potential are shown in Figure 7.
Action potential wave-forms were defined and categorized according to the
parameters used by Zhou
and Hablitz (2). According to these criteria, most of the recorded neurons (162/219) could be identified as classic non-accommodating cells (c-NAC) (Figure 8A), i.e., cells
with short-duration action potentials (around 1.1 ms), rapid
Figure 6. Passive electrophysiological properties of layer 1 interneu-rons. A, Representative recording of a neuron under successive hy-perpolarizing pulses (varying in 10 pA steps). B, Current-voltage (I/V) curve of layer 1 neurons according to dendritic morphotype. Measure-ments were made for all horizontal (N = 28), radial (N = 41), ascen -dant (N = 22), and descen-dant (N = 13) cells. Points were calculated with the mean values obtained for all studied cells in each group. Note that there was no statistically significant segregation between the data sets. C, I/V curve of layer 1 neurons according to sublayer distribution. Measurements were made for all superior (N = 24), medial (N = 47) and inferior (N = 34) cells. Points were calculated with the mean val -ues obtained for all cells studied in each group. Note that there was no statistically significant differences between the data sets.
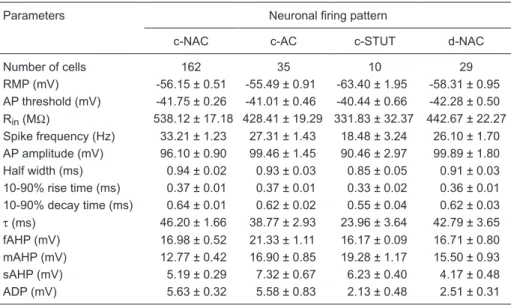
Table 3. Summary of electrophysiological parameters in relation to neuronal firing pattern.
Parameters Neuronal firing pattern
c-NAC c-AC c-STUT d-NAC
Number of cells 162 35 10 29
RMP (mV) -56.15 ± 0.51 -55.49 ± 0.91 -63.40 ± 1.95 -58.31 ± 0.95 AP threshold (mV) -41.75 ± 0.26 -41.01 ± 0.46 -40.44 ± 0.66 -42.28 ± 0.50 Rin (MΩ) 538.12 ± 17.18 428.41 ± 19.29 331.83 ± 32.37 442.67 ± 22.27
Spike frequency (Hz) 33.21 ± 1.23 27.31 ± 1.43 18.48 ± 3.24 26.10 ± 1.70 AP amplitude (mV) 96.10 ± 0.90 99.46 ± 1.45 90.46 ± 2.97 99.89 ± 1.80 Half width (ms) 0.94 ± 0.02 0.93 ± 0.03 0.85 ± 0.05 0.91 ± 0.03 10-90% rise time (ms) 0.37 ± 0.01 0.37 ± 0.01 0.33 ± 0.02 0.36 ± 0.01 10-90% decay time (ms) 0.64 ± 0.01 0.62 ± 0.02 0.55 ± 0.04 0.62 ± 0.03
τ (ms) 46.20 ± 1.66 38.77 ± 2.93 23.96 ± 3.64 42.79 ± 3.65 fAHP (mV) 16.98 ± 0.52 21.33 ± 1.11 16.17 ± 0.09 16.71 ± 0.80 mAHP (mV) 12.77 ± 0.42 16.90 ± 0.85 19.28 ± 1.17 15.50 ± 0.93
sAHP (mV) 5.19 ± 0.29 7.32 ± 0.67 6.23 ± 0.40 4.17 ± 0.48
ADP (mV) 5.63 ± 0.32 5.58 ± 0.83 2.13 ± 0.48 2.51 ± 0.31
Data are reported as means ± SEM. c-NAC and c-AC = classic non-accommodating and accom -modating cells, respectively; c-STUT = classic stuttering neurons; d-NAC = delayed NAC; RMP = resting membrane potential; AP = action potential; Rin = input resistance; τ = membrane time
Figure 7. Afterpotentials of layer 1 interneurons. Each insert represents an expanded view of the area delimited
rate of spike repolarization with the presence of fAHPs and
absence or near-absence of spike-frequency adaptation.
These cells responded immediately and continued to fire during the entire duration of each stimulus (Figure 8A). They had a significantly higher Rin and lower mAHP am
-plitude (Table 3; P < 0.05) than other recorded neurons in our study. This finding is similar to previous results about layer 1 neurons reported by Zhou and Hablitz (2). It should be noted that this c-NAC waveform is exclusive to cortical
inhibitory interneurons (12,26).
In spite of this uniformity in the action potential waveform,
we found that the firing pattern of the studied cells showed marked firing pattern subtypes. Of the recorded neuronal population, 13.24% (29/219) of the cells were characterized
as delayed non-accommodating neurons (d-NAC; Figure
8C), i.e., cells that were not immediately responsive to a
given depolarizing pulse, presenting spikes only after a
certain period. These cells had significantly lower sAHP amplitudes (Table 3; P < 0.05). Another group of cells (15.98%; 35/219) were classic accommodating neurons (c-AC; Figure 8B), in the sense that they responded with
one or more action potentials (depending on the amplitude of the stimulus) and then silenced for the remainder of the
pulse. These cells had a significantly higher fAHP ampli
-tude (Table 3; P < 0.05). A fraction of 4.57% (10/219) was classified as classic stuttering cells (c-STUT; presenting
quiescent periods, i.e., periods of intermittent silencing in
their repetitive firing sequence; Figure 8D). These cells had a significantly higher RMP and lower τ and Rin (Table 3;
P < 0.05). Similar patterns were also found by Zhou and Hablitz (2) and Chu et al. (4).
A significant difference was found in the distribution Figure 8. Intrinsic firing patterns of layer 1 neurons. Recordings are representative of the general behavior of each cell
of firing patterns between the distinct morphotypes (P < 0.001). Ascendant and descendant cells did not exhibit a c-NAC firing pattern and horizontal cells presented a much smaller proportion of c-AC patterns (Figure 8F). In
addition, ascendant and descendant cells, in marked
con-trast to the other morphological categories, did not exhibit ADPs. There was also a significant difference between the neuronal populations of each sublayer (P = 0.017). Cells of the superior sublayer did not present c-NAC firing
patterns and only a relatively small proportion of these
neurons were d-NAC cells (Figure 8E). Additionally, a larger
proportion of neurons in the inferior sublayer had a d-NAC
firing pattern compared to medial cells. Interestingly, the
remaining membrane properties, such as τ, RMP and Rin
were statistically homogeneous (P > 0.05) among layer 1 cells of different morphotypes (Table 1 and Figure 6B) and sublayer distribution (Table 2 and Figure 6C).
Discussion
We applied biocytin labeling and patch-clamp recording methods to layer 1 interneurons in order to evaluate possible relationships between morphological and electrophysiologi-cal parameters in these cells. We also obtained data for the proposal of a quantitative, dendrite-based, morphological
classification of rat layer 1 neurons. In contrast to previous studies by Zhou and Hablitz (5), we used a quantitative ap -proach for the establishment of cell classes and investigated the morphology-electrophysiology relationship in layer 1 neurons using both categorical and continuous statistical
analyses. To our knowledge, this is the first proposal of a
quantitative analytical investigation of the functional cor-relates of dendritic morphology and spatial distribution in layer 1 interneurons.
We propose the division of layer 1 cells into four ma-jor groups according to the orientation of their dendritic arborization clusters: horizontal, radial, ascendant, and descendant. According to our results, radial and ascendant
cells are relatively uniform in their morphology. Horizontal
cells, on the other hand, can be further segregated into
cells that extend their dendrites to both sides of the soma
and those that project unilaterally. Descendant cells can be divided into regular descendant cells, which could be described as “inverted” ascendant cells, and the subpial cells, a relatively rare subpopulation that was restricted to the superior sublayer of layer 1.
The absence of Cajal-Retzius cells is explained by the
age of the animals studied (14 to 21 postnatal days), as the
number of these cells decreases rapidly after 8 postnatal
days (25). Insightful studies on the function of these cells
can be found elsewhere (2,5,8,9,25).
Horizontal, ascendant and radial neurons had a similar
distribution across the established layer 1 subdivisions. Descendant cells, on the other hand, had a very distinct spatial organization, being almost restricted to the
out-ermost region of layer 1. We were unable to establish a
physiological explanation for such a unique distribution. However, considering the distribution of axonal fibers in layer 1 (1), specifically the fact that the sublayer closest
to the pia-mater typically contains few, poorly myelinated
axons and that the medial sublayer contains many, highly myelinated fibers, we hypothesize that descendant cells,
especially the subpial cells, are probably primarily involved in local intralayer circuits, while the remaining subtypes (concentrated on the medial and inferior sub-lamina), may be
directly involved in interlayer and extracortical connections.
Future studies, perhaps using retrograde tracing methods,
must be done to confirm this hypothesis. Special attention
should also be given to the rare and distinct subpial cells, whose highly distinct morphological properties hint at the
possibility that they may execute a unique function in layer
1 physiology.
Due to their significantly large total dendritic length and maximum Sholl radius, horizontal cells may perhaps serve
an integrative function, computing inputs over a relatively
large receptor field. The probable role of radial and ascen -dant cells is harder to evaluate and more research is needed before any substantial hypothesis can be proposed.
The overall values of passive and active electrophysi-ological properties of layer 1 neurons were similar to those
found in previous studies (2,9). However, a significant differ
-ence was found in the distribution of firing patterns between
the established morphotypes and between the neuronal populations of each sublayer. To our knowledge, this is the
first report of such relationships in layer 1 neurons. Even
though the high variability of the dendritic organization of cortical inhibitory interneurons has led some authors to
remark that only the analysis of axonal arborization could
provide a solid distinction between the physiological roles of cortical interneurons (12), our data show that there are
clear differences in the statistical distribution of firing patterns
between layer 1 neurons with distinct dendritic morphologi-cal phenotypes and spatial distribution.
On the basis of our results, one could hypothesize that reported functional electrophysiological differences in layer 1 neurons, such as between d-NAC and non-d-NAC cells in the integration of sensory input (4), may also be
corre-lated to certain morphological parameters. In this context, we believe that the different distribution of firing properties
between the proposed morphotypes is probably related to differences in the computational or functional roles of
each structurally defined population in layer 1 circuits. Each
pattern of dendritic distribution could perhaps be related to different patterns of synaptic input during cortical maturation and/or early functional processing of sensory phenomena.
The observed differences in firing patterns among the
sub-strata of layer 1 could be related to differences in the nature of the synaptic input arriving from distinct types of afferent
morphological categories, did not exhibit ADPs. These varia -tions in electrophysiological parameters of layer 1 neurons
are probably due to the differential expression, insertion or deactivation of specific ion channels, which in turn could be
related to genetic or ontological differences among different morphological subtypes or spatially segregated neuronal populations in this cortical layer (12,26,27).
Our results show that dendritic morphology and spatial distribution of layer 1 interneurons, parameters that have been overlooked by previous studies on this neuronal popu-lation, are correlated with important distinctions in neuronal
firing pattern. Given the amount of hypotheses that arise from these findings, further studies must be done in order
to fully understand the origins and functional implications of the relationships between dendritic morphology, spatial distribution and physiological parameters.
Acknowledgments
The authors are grateful to Dr. Marco Antonio V. Santos and the Evandro Chagas Institute (Ananindeua, Pará, Brazil) for providing the animals used in this study. We also wish to thank Prof. Dr. Jessé C. Costa for technical support in elaborating the custom Matlab scripts. Research supported by CNPq, FINEP, and the Foundation for Research
Sup-port of the State of Pará (FAPESPA). More specifically, we received the CNPq-PRONEX/FAPESPA (#2268), and CNPq (#470827/2009-2) research grants. D.V.V. Santos
received a fellowship for graduate students from CAPES. K.M. Costa and M.C.G. Vaz received CNPq fellowships for undergraduate students. M. Da Silva Filho is currently a CNPq research fellow.
References
1. Vogt BA. The role of layer I in cortical function. In: Peters A, Jones E (Editors), Cerebral cortex. New York: Plenum; 1991.
2. Zhou FM, Hablitz JJ. Layer I neurons of rat neocortex. I. Ac -tion potential and repetitive firing properties. J Neurophysiol
1996; 76: 651-667.
3. Shlosberg D, Patrick SL, Buskila Y, Amitai Y. Inhibitory ef-fect of mouse neocortex layer I on the underlying cellular network. Eur J Neurosci 2003; 18: 2751-2759.
4. Chu Z, Galarreta M, Hestrin S. Synaptic interactions of late-spiking neocortical neurons in layer 1. J Neurosci 2003; 23: 96-102.
5. Zhou FM, Hablitz JJ. Morphological properties of intracellu -larly labeled layer I neurons in rat neocortex. J Comp Neurol
1996; 376: 198-213.
6. Llinas RR, Leznik E, Urbano FJ. Temporal binding via cortical coincidence detection of specific and nonspecific thalamocortical inputs: a voltage-dependent dye-imaging study in mouse brain slices. Proc Natl Acad Sci U S A 2002; 99: 449-454.
7. Zhu Y, Zhu JJ. Rapid arrival and integration of ascending sensory information in layer 1 nonpyramidal neurons and tuft dendrites of layer 5 pyramidal neurons of the neocortex.
J Neurosci 2004; 24: 1272-1279.
8. Kirmse K, Dvorzhak A, Grantyn R, Kirischuk S. Developmen -tal downregulation of excitatory GABAergic transmission in neocortical layer I via presynaptic adenosine A(1) receptors.
Cereb Cortex 2008; 18: 424-432.
9. Zhou FM, Hablitz JJ. Layer I neurons of the rat neocortex. II. Voltage-dependent outward currents. J Neurophysiol 1996;
76: 668-682.
10. Zhou FM, Hablitz JJ. Rapid kinetics and inward rectification of miniature EPSCs in layer I neurons of rat neocortex. J Neurophysiol 1997; 77: 2416-2426.
11. Hestrin S, Armstrong WE. Morphology and physiology of cor -tical neurons in layer I. J Neurosci 1996; 16: 5290-5300.
12. Markram H, Toledo-Rodriguez M, Wang Y, Gupta A, Sil -berberg G, Wu C. Interneurons of the neocortical inhibitory system. Nat Rev Neurosci 2004; 5: 793-807.
13. Shepherd GM. Electrotonic properties of axons and den -drites. In: Squire LR, Berg D, Bloom FE, du-Lac S, Ghosh A, Spitzer NC (Editors), Fundamental neuroscience. 3rd edn. London: Academic Press; 2008. p 87-108.
14. London M, Hausser M. Dendritic computation. Annu Rev Neurosci 2005; 28: 503-532.
15. Rall W. Core conducter theory and cable properties in neu-rons. In: Kandel ER, Mountcastle VB (Editors), Handbook of physiology: The nervous system. Bethesda: American Physiological Society; 1977. p 39-97.
16. Edwards FA, Konnerth A, Sakmann B, Takahashi T. A thin slice preparation for patch clamp recordings from neurones of the mammalian central nervous system. Pflugers Arch 1989; 414: 600-612.
17. Horikawa K, Armstrong WE. A versatile means of intracellu -lar labeling: injection of biocytin and its detection with avidin conjugates. J Neurosci Methods 1988; 25: 1-11.
18. Storm JF. Intracellular injection of a Ca2+ chelator inhibits
spike repolarization in hippocampal neurons. Brain Res
1987; 435: 387-392.
19. Meijering E, Jacob M, Sarria JC, Steiner P, Hirling H, Unser M. Design and validation of a tool for neurite tracing and analysis in fluorescence microscopy images. Cytometry A
2004; 58: 167-176.
20. Hamam BN, Amaral DG, Alonso AA. Morphological and elec -trophysiological characteristics of layer V neurons of the rat lateral entorhinal cortex. J Comp Neurol 2002; 451: 45-61. 21. Romanova EV, Fosser KA, Rubakhin SS, Nuzzo RG,
Swee-dler JV. Engineering the morphology and electrophysiologi-cal parameters of cultured neurons by microfluidic surface patterning. FASEB J 2004; 18: 1267-1269.
22. Sholl DA. Dendritic organization in the neurons of the visual and motor cortices of the cat. J Anat 1953; 87: 387-406.
23. Watson KK, Jones TK, Allman JM. Dendritic architecture of the von Economo neurons. Neuroscience 2006; 141: 1107-1112.
I of the developing occipital cortex of the rat. J Comp Neurol
1977; 176: 121-132.
26. Descalzo VF, Nowak LG, Brumberg JC, McCormick DA, Sanchez-Vives MV. Slow adaptation in fast-spiking neurons
of visual cortex. J Neurophysiol 2005; 93: 1111-1118.
27. Budde T, White JA. The voltage-dependent conductances of rat neocortical layer I neurons. Eur J Neurosci 1998; 10: