DOI: http://dx.doi.org/10.1590/2446-4740.01815
*e-mail: [email protected]
Received: 24 July 2015 / Accepted: 27 August 2016
Inluences of the signal border extension in the discrete wavelet
transform in EEG spike detection
Edras Reily Pacola*, Veronica Isabela Quandt, Paulo Breno Noronha Liberalesso, Sergio Francisco Pichorim, Humberto Remigio Gamba, Miguel Antonio Sovierzoski
Abstract Introduction: The discrete wavelet transform is used in many studies as signal preprocessor for EEG spike detection. An inherent process of this mathematical tool is the recursive wavelet convolution over the signal that is decomposed into detail and approximation coeficients. To perform these convolutions, irstly it is necessary to extend signal borders. The selection of an unsuitable border extension algorithm may increase the false positive rate of an EEG spike detector. Methods: In this study we analyzed nine different border extensions used for convolution and 19 mother wavelets commonly seen in other EEG spike detectors in the literature. Results: The border extension may degrade an EEG spike detector up to 44.11%. Furthermore, results behave differently for distinct number of wavelet coeficients. Conclusion: There is not a best border extension to be used with any EEG spike detector based on the discrete wavelet transform, but the selection of the most adequate border extension is related to the number of coeficients of a mother wavelet.
Keywords: EEG, Spike, Border extension, Discrete wavelet transform, LDA.
Introduction
Epilepsy affects more than 50 million people around the world (World Health Organization, 2015). The term epilepsy refers to a group of symptoms related to many causes and it is not a speciic disease, where excessive discharges of groups of brain cells leads to sudden recurrent and transient mental functions and/ or movements of the body (Kalayci et al., 1994). EEG abnormalities speciic to epilepsy are ictal and interictal activity. Ictal activity occurs during epileptic seizures. Interictal activity consists of random spike and sharp waves, occurring from every few hours to every few seconds (Gotman, 1981). Spike and sharp waves have duration from 20 to 200 ms (Chatrian et al., 1974; Noachtar et al., 1999), and their recognition in EEG exams is exhaustive and time consuming. Despite the effort of researchers in over two decades, the epilepsy diagnosis still does not count on a reliable automated process.
A technique used by researchers is based on the use of the wavelet transform (WT) (Daubechies, 1990; Mallat, 1989) in its discrete implementation, the discrete wavelet transform. It is a powerful technique for processing EEG signals using recursive convolutions of speciic coeficients with epochs of the EEG signal to extract features that can be used to classify these events as a spike or normal brain activity. The closer the similarity between the mother
wavelet and the signal under analysis, the better the performance of a detector using this mother wavelet.
Researchers have found different conclusions about which wavelet is the best one to detect and classify EEG spikes. Some authors (Adeli et al., 2007; Birot et al., 2013; Ercelebi and Subasi, 2006; Gajic et al., 2014; Indiradevi et al., 2008; Inuso et al., 2007; Sadati et al., 2006; Shuren and Zhong, 2009; Wang et al., 2009) concluded that the best wavelet is the Daubechies series 4, with a number of decompositions varying from 3 to 5. Other authors (Correa et al., 2015; Nunes et al., 2014; Ubeyli, 2009) concluded that the Daubechies series 2, with up to 5 decomposition levels is adequate for spike classiication. Moreover, other wavelets such as Daubechies series 3, 5, 6, 8, 10, and 20, Coilet 2, 3, 4, and 5, discrete Meyer, Symlet 2, 3, 4, and 5, Reverse Bior 13, and the Haar wavelet are also used (Ercelebi and Subasi, 2006; Mirzaei et al., 2011; Nunes et al., 2014; Ubeyli, 2009; Vavadi et al., 2010; Veneri et al., 2011; Xu and Song, 2008).
The discrete implementation of the wavelet transform (DWT) is applied to a inite number of signal samples, even for long-term signals or continuous sampling. Each signal segment requires the treatment of the signal border for recursive convolution calculation (Mallat, 1989). The border extension is a procedure that aims to mimic the signal behavior outside the
Pacola ER, Quandt VI, Liberalesso PBN, Pichorim SF, Gamba HR, Sovierzoski MA
signal sample window, attaching extra values at both sides of the signal window to smooth edge distortions. The border extension algorithm is performed for every decomposition level of the discrete wavelet transform, with its execution being unavoidable.
During the implementation of a proprietary EEG spike detector, it was noticed that each algorithm used to extend the EEG borders modiied signiicantly the obtained DWT coeficients. Preliminary results showed that these variations affected the spike classiication since they change the features of the WT decompositions, such as its maximum and minimum values, its energy and its approximate entropy value (Pacola et al., 2012).
The distortions generated by the border extension are well known in areas such as mechanical engineering and image processing (Katunin, 2012; Montanari et al., 2015; Su et al., 2012). Quandt et al. (2015) reported border distortions for respiratory signals. However, for EEG signal, no report on distortions produced by border extension was found.
To assess the differences in performance of different border extensions, the results of a detailed study comparing 19 wavelets and 9 border extension over 494 EEG spike events and 1500 EEG non-spike events and the best combinations of them are presented.
Methods
EEG signal database
The EEG spike and non-spike events were selected from a database by a neurologist from Pequeno Príncipe Hospital, in Curitiba, PR, Brazil. The EEG signal was recorded using scalp electrodes in international 10-20 system, recorded at 200 samples per second. The 494 spike events and the 1500 events containing normal brain activity (non-spike events) were collected from different parts of seizure free sections from different non-correlated channels. These events were recorded as epochs with duration of 2 seconds. The spike events are centered within the sample window. The spike events collected range from 60 ms to 200 ms. This research has been approved by ethics committee (CEP/HPP 1104-12).
Wavelets and descriptor
In this work, 19 wavelets were assessed: Coilet (Coif) 2, 3, 4, and 5, Daubechies (DB) series 2, 3, 4, 5, 6, 8, 10, and 20, discrete Meyer (Dmey), Reverse Bior 13 (RBior13), Haar, and Symlet (Sym) 2, 3, 4, and 5 (Adeli et al., 2007; Birot et al., 2013; Ercelebi and Subasi, 2006; Gajic et al., 2014; Indiradevi et al., 2008; Inuso et al., 2007; Mirzaei et al., 2011; Nunes et al., 2014; Sadati et al., 2006; Shuren and Zhong, 2009;
Ubeyli, 2009; Vavadi et al., 2010; Veneri et al., 2011; Wang et al., 2009; Xu and Song, 2008).
The wavelet transform was performed by its discrete implementation in ive decomposition levels. Because the EEG signal was recorded at a sampling rate of 200 Hz, these ive decompositions contain the gamma, beta, alpha, and theta waves spectra (Ercelebi and Subasi, 2006; Shuren and Zhong, 2009).
For this study, the Approximate Entropy (ApEn) was used as a signal feature descriptor. The ApEn is an algorithm that measures the complexity of the EEG spike event. This algorithm was introduced by Pincus (1990) and was used in many studies in the literature to enhance EEG spike detection (Kumar et al., 2014; Ocak, 2009; Vavadi et al., 2010; Wang et al., 2009). The smaller its value, more regular and predictable it is a sequence of samples. The ApEn input parameters were m = 2, and the considered deviation was set to 15% of the input vector standard deviation. The ApEn was calculated for the ive decomposition levels resulting of the DWT.
Border extension
Nine border extensions are normally used during the convolution process: ZPD, SP0, SP1, PPD, PER, SYMH, SYMW, ASYMH, and ASYMW. In the ZPD (Zero Padding), the border values of the event are set to zero. SP0 (Smooth-Padding of order 0) replicates the irst and last samples of the event. SP1 (Smooth-Padding of order 1) is the irst derivative border interpolation of the event. PPD (Periodic-Padding) and PER (Periodic Even Padding) consider that the borders of the event are periodic. SYMH (Symmetric-Padding Half-Point) performs a symmetric replication of half-point of the border values of the event. SYMW (Symmetric-Padding Whole-Point) replicates symmetrically the border whole-point. ASYMH (Antisymmetric-Padding Half-Point) and ASYMW (Antisymmetric-Padding Whole-Point) behave like SYMH and SYMW, but asymmetrically. These signal border extensions are well explained by Misiti et al. (2013). Just as a matter of information, the border extension SYMH is used as default by the MATLAB wavelet toolbox.
For instance, Figure 1 shows an epoch of a cosine signal to illustrate how the signal border is extended for convolution. The lines in different colors are the signal extended with the 9 different extension borders. In this study, instead of a cosine, it is the EEG event that is extended.
In DWT decomposition, the extra values to be added to the signal being convolved depends directly on the number of coeficients of the high pass and
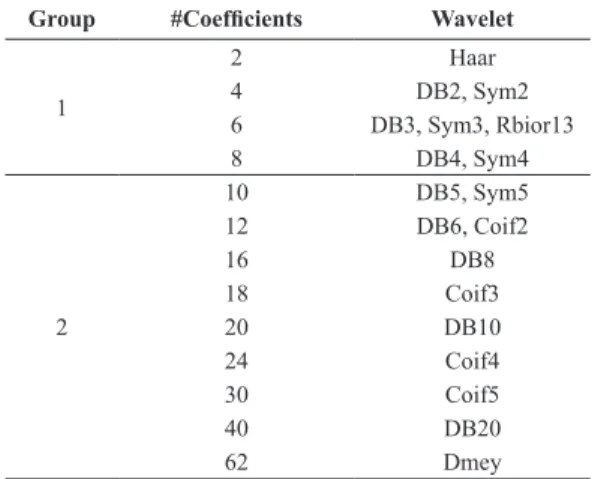
low pass ilters. The number of coeficients of each wavelet analyzed in this work is presented in Table 1.
Border distortions
Figure 2 shows an example of the distortions caused by the border extension used in combination with the discrete wavelet transform when dealing with EEG signals.
Figures 2a and 2b present the same EEG spike event in an epoch of 2 seconds of duration, where the spike is centered in the sample window. The spike is decomposed into 5 levels by the Daubechies 6 (DB6) wavelet. The difference between Figure 2a, b is that in the irst one, the signal border extension SP0 (Smooth Padding of order 0) is used, while in the second one, the signal border extension PER (Periodic Even Padding) is used. It is possible to see that the coeficients near the edge are different. In Figure 2b, the edge coeficients are even higher in value than the central coeficients in decomposition levels D1, D2, and D3.
Now, considering feature extraction, when calculating the ApEn of each decomposition level, using the same EEG spike event and wavelet transform, different results are obtained due to different signal border extensions used as seen in Figure 2c.
Additionally, Figure 2d presents the differences of the ApEn calculated over the spike and non-spike events on the database where it is possible to see discriminatory information between both classes.
Spike detector
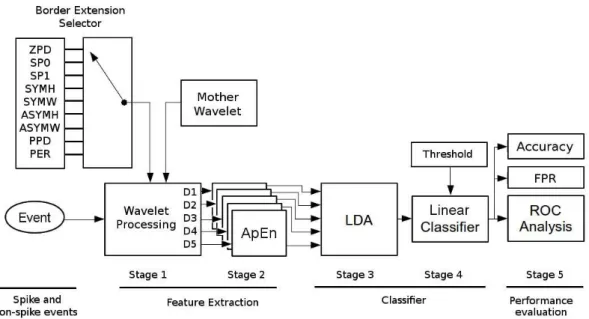
To assess the inluence of the border extension in EEG spike detection, the detector structure presented in Figure 3 was used. The detector architecture was entirely written in Java language and no commercial tools were used.
In Figure 3, the EEG events are wavelet transformed in its discrete form according to the border extension algorithm selected and decomposed in 5 decomposition levels in stage 1. After wavelet transformation, the ApEn is calculated for each decomposition level in stage 2. Afterwards, the ive extracted features values are then reduced in stage 3 to a single dimension.
Figure 1. Cosine epoch from –π/4 to 2π extended by the indicated border extensions.
Table 1. Wavelet groups and their respective number of coeficients.
Group #Coeficients Wavelet
1
2 Haar
4 DB2, Sym2
6 DB3, Sym3, Rbior13
8 DB4, Sym4
2
10 DB5, Sym5
12 DB6, Coif2
16 DB8
18 Coif3
20 DB10
24 Coif4
30 Coif5
40 DB20
Pacola ER, Quandt VI, Liberalesso PBN, Pichorim SF, Gamba HR, Sovierzoski MA
To achieve this dimensionality reduction, the linear discriminant analysis (LDA) and the Fisher criteria for function maximization are used (Duda et al., 2001). The LDA calculates the mean value and scatter of classes under analysis. Using eigenvectors and eigenvalues, it is determined a projection with reduced dimensions, keeping the best separability between classes. The LDA is a mathematical tool and does not require iterative training.
In stage 4, a threshold is used to classify spike and non-spike events over the unidimensional projection generated by the LDA algorithm. Finally, the detection is assessed in stage 5.
Performance indexes
EEG spike events and non-spike events correctly classiied are deined as True Positive (TP) and True Negative (TN), while misclassiied EEG spike events
Figure 2. The effect of the border extension in the DWT decomposition. (a, b) The ive decomposition levels of the same EEG spike
event (top graphics) with DWT DB6, using (a) SP0 and (b) PER as the border extension algorithm; (c) Normalized approximate entropy
(ApEn) in the ive decomposition levels with the nine described extension border algorithms; (d) ApEn in the ive decomposition levels of
the selected EEG signal events wavelet transformed with DB6, using SP0 border extension. The star mark shows the respective ApEn for decomposition D3 in (a).
and non-spike events are deined as False Positive (FP) and False Negative (FN), respectively (Youden, 1950).
To measure the inluence of the border extension in the detection’s performance, four indexes are used: Accuracy (Acc), True Positive Rate (TPR), False Positive Rate (FPR) and the area under the ROC Curve (AUC). These indexes are calculated using (1), (2), and (3), respectively.
TP TN Acc accuracy
TP FP FN TN
+
= =
+ + + (1)
TP TPR sensitivity
TP FN
= =
+ (2)
TN FPR specificity
TN FP
= =
+ (3)
ROC analysis is generally used to investigate the performance of a predictive model in separating positive from negative cases (Lasko et al., 2005).
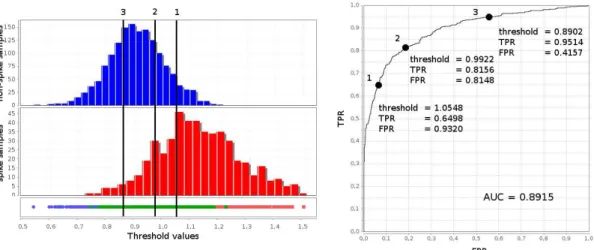
A deined threshold in a linear classiier results in a pair of TPR and FPR. When varying the threshold value over the continuous range of classiied distributions, pairs of TPR and FPR are produced. These pairs are used to plot the ROC curve in a Cartesian graphic. The AUC index is the area under the ROC curve (Erkel and Pattynama, 1998; Fawcett, 2006).
Figure 4 illustrates the construction of the ROC curve and calculation of sensitivity, speciicity, Acc, and FPR indexes and their location in the ROC curve.
Through the wavelet transformation an EEG event is decomposed in ive levels. For each decomposition level it is calculated the ApEn, resulting in ive features. These calculations, i.e., WT with ive decomposition levels and their ApEn, are repeated for every event in the database. The LDA takes these 5 features of each event in the database and determines a unidimensional projection containing distributions of spike and non-spike events. From these distributions, by varying the threshold value of the linear classiier, a pair of TPR and FPR is generated. These pairs are then used to draw the ROC curve.
The Acc and FPR index values are extracted from the higher values of sensitivity and speciicity, which is the point located at the shortest Euclidean distance between the upper-left corner of the frame to the ROC Curve.
Results
The nine above mentioned border extension algorithms were implemented and the EEG spike detector performance with each implementation was assessed. All 494 spikes events and all 1500 non-spike events were wavelet transformed with 5 decomposition levels for each border extension. The classiication results were divided in two groups: Group 1 - wavelets having up to 8 coeficients, and, Group 2 - wavelets having more than 8 coeficients. The performance indexes of the EEG spike detector for each wavelet,
Figure 3. Block diagram of the spike detector considering WT based on different border extensions. The feature ApEn is extracted from
the WT decompositions of each event in the database and the amount of features is reduced by LDA. The linear classiier separates events
Pacola ER, Quandt VI, Liberalesso PBN, Pichorim SF, Gamba HR, Sovierzoski MA
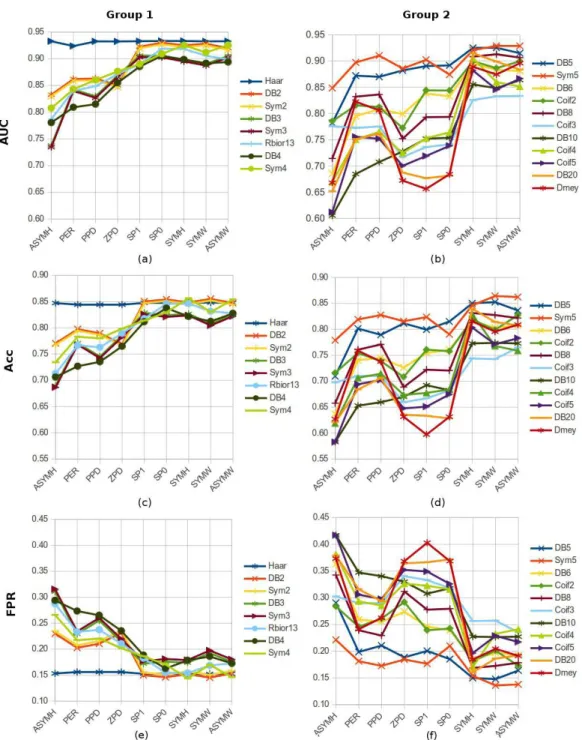
as a function of the border extension, are shown in Figure 5. The AUC index in Groups 1 and 2 are presented in Figures 5a and 5b, respectively. Acc results are presented in Figures 5c and 5d, and FPR index is presented in Figures 5e and 5f.
Figure 5 show that, for the same wavelet, the border extension algorithm used to extend the signal affects the performance of the EEG spike detector. This behavior is observed in the three performance indexes used to assess the detector in both Groups of wavelets. The only exception is the Haar wavelet in Group 1, whose indexes did not change with the border extension as the other wavelets did.
In Figure 5, the border extensions that presented the better EEG spike detection were SP0, SP1, SYMH, SYMW, and ASYMW for wavelets having less than 8 coeficients. For wavelets having more than 8 coeficients, the best ones are SYMH, SYMW, and ASYMW.
Considering wavelets having more than 8 coeficients, as seen in Figure 5, SP0 degrades the detector performance. The best border extension for wavelets having more than 18 coeficients varies between ASYMW and SYMH, but still with great differences between them, reaching up to 3.2% for DB20.
The detector performance showed variations in both wavelet groups with any border extension, but border extensions PER, PPD, ZPD, and ASYMH presented the worst performance.
Using the ApEn descriptor the best detector performance was achieved with border extension
SP0 with wavelets Haar, DB2, and Sym2, with AUC equal to 0.9332, 0.9300, and 0.9300, respectively.
The highest Acc indexes were achieved using wavelet Sym5 with border SYMW (0.8642), followed by DB2 and Sym2 with SP0 and Sym4 with ASYMW (these last three with accuracy of 0.8541).
The lowest FPR was obtained with wavelets Sym5 with border SYMW (0.1359), followed by DB2 and Sym2 with SP0, and Sym4 with ASYMW (these last three with FPR of 0.1459).
In Figure 5, it is interesting to note that the index used in the evaluation of the detector might vary with the border extension. This behavior is observed with wavelets Haar, DB2, and Sym2. The AUC index of wavelet Haar presented the higher performance with SP1 and SP0 than the wavelets DB2 and Sym2 with the same border extensions, SP1 and SP0. This is different for the results obtained with indexes Acc and FPR. The reason for this is that the Accuracy and FPR indexes take into account just one pair of sensitivity and speciicity, and both depend on how the linear classiier is conigured. AUC, instead, takes under consideration every pair of sensitivity and speciicity used to draw the ROC curve, being less vulnerable to the threshold used in the linear classiier. This is shown in Figure 6, where wavelet DB5 produces a higher AUC index when compared to the use of Sym4. In Figure 6, taking the best pairs of sensitivity and speciicity denoted by the crossing lines over the ROC curves, the respective Accuracy and FPR indicates that Sym4 is better
Figure 4. Spike and non-spike events distributions after LDA processing are presented in red and blue, respectively. The line under both distributions on the left side is the unidimensional LDA output. The green points over the line are overlapping events. On the right side, the
respective ROC curve is presented. Points 1, 2, and 3 are threshold levels of the linear classiier with their respective TPR and FPR values. These are results for wavelet DB5 with border extension SP0.
than DB5, going against the result obtained with the use of AUC index.
Now, considering just the AUC index, the border extension SP0 showed itself as the best extension when used with wavelets having less than 8 coeficients. The SYMH, which is the default Matlab border extension, degrades results up to 3.64% with these wavelets.
Considering wavelets having more than 8 coeficients, SYMH showed itself to be proper for wavelets with 12, 18, 24, 30, and 40 coeficients.
SYMW presented the best results for wavelets sizing 10 and 16 coeficients, while ASYMW proved to be more appropriate for wavelets sizing 20 and 62 coeficients.
ASYMH presented the worst result, regardless of the size of the wavelet, degrading results up to 44.11%.
Figure 5. Behavior of AUC, Acc and FPR indexes for each border extension related to mother wavelets having up to 8 coeficients (group 1)
Pacola ER, Quandt VI, Liberalesso PBN, Pichorim SF, Gamba HR, Sovierzoski MA
Discussion
The graphics in Figures 5 show that the signal border extension used in the discrete wavelet transformation has a strong inluence in the performance of an EEG spike detector.
The border extension SP0 is the best extension mode for wavelets with up to 8 coeficients. This is important since wavelets with up to 8 coeficients are used in the majority of studies found in the literature.
The wavelet Haar, Figure 5, does not suffer a strong inluence of the border extension. The worst border for this wavelet is ZPD, and even so it only degraded the results in 0.09%. As the wavelet Haar has only 2 coeficients, the effects of border extension do not spread over the wavelet decompositions, as with the wavelets having more coeficients.
The default border extension used in Matlab is SYMH. However, for an EEG spike detector, SYMH is not the best option for some wavelets, since it drops the detector performance. In our experiments, the SYMH algorithm dropped the AUC index up to 1.06%; the Acc index dropped 2.9%; and FPR index dropped 8.4%. Considering that a 24-hour EEG exam may have thousands of spike events, this may represent numerous spikes misclassiied.
The border extensions PER, PPD, ZPD and ASYMH presented the worst performance in the EEG spike detection. These border extensions are inadequate for this purpose.
The simplicity of implementing the border extension ZPD may suggest its use for a WT based
EEG spike detector. However, as we have shown, ZPD is not adequate to extend the EEG signal for an EEG spike detection.
Regarding the database size, the spike events used for this work have duration ranging from 60 ms to 200 ms and were selected by one neurologist. This represents that the data presented in this study may have either mapped the morphology of the database as well the sensitivity and speciicity of the neurologist. More data is necessary to complete the full range of spike events (from 20 ms to 200 ms) and selected by various specialists. However, in this case, this work provided means on how to measure the variability of the border effect and the distortions caused by its use.
A inal comment is that for an EEG spike detector based on the WT, it is not possible to avoid the use of one of those border extension algorithms presented here. Nevertheless, by choosing the right border extension for the selected wavelet will reduce to a minimal the distortions in the WT results, improving the detector performance.
Overall, this work has shown the importance of selecting the right border extension algorithm to enhance the performance of an EEG spike detector. To the best of our knowledge, this is the irst publication to present results of a careful study about the inluence of the border extension in an EEG spike detector based on the WT. From the experiments showed in this study, the border extension inluences the detection result according to the number of coeficients of the wavelet being used for feature extraction.
Figure 6. ROC curves of wavelets (a) DB5 with border SP1 and (b) Sym4 with border SP1. The values of sensitivity, speciicity, accuracy,
and FPR, were obtained by the threshold level denoted by the shortest Euclidean distance between the ROC curve and the ideal classiier (TPR=1, FPR=0).
The wavelets frequently found in the literature used for EEG spike detection have up to 8 coeficients, and for these wavelets, the SP0 border extension is the more adequate. The border extensions PER, PPD, ZPD and ASYMH had the worst performance and they are not adequate for EEG spike detection. The border extension SYMH is adequate for wavelets with 12, 18, 24, 30, and 40 coeficients. SYMW presented the best results for wavelets with 10 and 16 coeficients, while ASYMW proved to be more adequate for wavelets with 20 and 62 coeficients. The results obtained in this study evaluated the discrete wavelet transform and its inherent border extension algorithm exclusively for EEG spike detection. For signals of different nature and context, it remains open which mother wavelet and border extension is more adequate.
Acknowledgements
We would like to give special thanks to Pequeno Príncipe Hospital in Curitiba, PR, Brazil, and its staff for all the support provided during this research and for the Coordination for the Improvement of Higher Level Personnel (CAPES), for inancially supporting this work.
References
Adeli H, Ghosh-Dastidar S, Dadmehr N. A wavelet-chaos methodology for analysis of EEGs and EEG subbands to detect seizure and epilepsy. IEEE Transactions on Biomedical Engineering. 2007; 54(2):205-11. http://dx.doi.org/10.1109/ TBME.2006.886855. PMid:17278577.
Birot G, Kachenoura A, Albera L, Benar C, Wendling F. Automatic detection of fast ripples. Journal of Neuroscience Methods. 2013; 213(2):236-49. http://dx.doi.org/10.1016/j. jneumeth.2012.12.013. PMid:23261773.
Chatrian G, Bergamini L, Dondey M, Klass D. A glossary of terms most commonly used by clinical electroencephalographers. Electroencephalography and Clinical Neurophysiology. 1974; 37(5):538-48. http://dx.doi.org/10.1016/0013-4694(74)90099-6. PMid:4138729.
Correa AG, Orosco L, Diez P, Laciar E. Automatic detection of epileptic seizures in long-term EEG records. Computers in Biology and Medicine. 2015; 57:66-73. http://dx.doi. org/10.1016/j.compbiomed.2014.11.013. PMid:25531725.
Daubechies I. The wavelet transform, time-frequency localization and signal analysis. IEEE Transactions on Information Theory. 1990; 36(5):961-1005. http://dx.doi. org/10.1109/18.57199.
Duda RO, Hart PE, Stork DG. Pattern classification. 2nd ed. New York: Wiley Interscience; 2001.
Ercelebi E, Subasi A. Classification of EEG for epilepsy diagnosis in wavelet domain using artificial neural network and multi linear regression. In: Signal Processing and
Communications Applications; 2006 Apr 17-19; Antalya. New York: IEEE; 2006. p. 1-4.
Erkel ARV, Pattynama PMT. Receiver operating characteristic (ROC) analysis: basic principles and applications in radiology. European Journal of Radiology. 1998; 27(2):88-94. http:// dx.doi.org/10.1016/S0720-048X(97)00157-5. PMid:9639133.
Fawcett T. An introduction to ROC analysis. Pattern Recognition Letters. 2006; 27(8):861-74. http://dx.doi. org/10.1016/j.patrec.2005.10.010.
Gajic D, Djurovic Z, Gennaro S, Gustafsson F. Classification of EEG signals for detection of epileptic seizures based on wavelets and statistical pattern recognition. Biomedical Engineering: Applications, Basis and Communications. 2014; 26(02):1450021. http://dx.doi.org/10.4015/ S1016237214500215.
Gotman J. A computer system to assist in the evaluation of the EEGs of epileptic patients. Behavior Research Methods and Instrumentation. 1981; 4(4):525-31. http://dx.doi. org/10.3758/BF03202062.
Indiradevi KP, Elias E, Sathidevi PS, Nayak SD, Radhakrishnan K. A multi-level wavelet approach for automatic detection of epileptic spikes in the electroencephalogram. Computers in Biology and Medicine. 2008; 38(7):805-16. http://dx.doi. org/10.1016/j.compbiomed.2008.04.010. PMid:18550047.
Inuso G, Foresta FL, Mammone N, Morabito FC. Brain activity investigation by EEG processing: wavelet analysis, kurtosis and renyi’s entropy for artifact detection. In: International Conference on Information Acquisition – ICIA 07; 2007 July 9-11; Jeju City, Korea. New York: IEEE; 2007. p. 195-200.
Kalayci T, Ozdamar O, Erdol N. The use of wavelet transform as a preprocessor for the neural network detection of EEG spikes. In: Proceedings of the 1994 IEEE Southeastcon ’94. Creative technology transfer: a global affair; 2014 Apr 10-13; Miami, USA. New York: IEEE; 1994. Vol. 1, p. 1-3. http://dx.doi.org/10.1109/SECON.1994.324252.
Katunin A. Reduction of boundary effect during structural damage identification using wavelet transform. Selected Engineering Problems. 2012; 1:97-102.
Kumar Y, Dewal ML, Anand RS. Epileptic seizures detection in EEG using DWT-based ApEn and artificial neural network. Signal, Video and Image Processing. 2014; 8(7):1323-34. http://dx.doi.org/10.1007/s11760-012-0362-9.
Lasko T, Bhagwat J, Zou K, Ohno-machado L. The use of receiver operating characteristic curves. Journal of Biomedical Informatics. 2005; 38(5):404-15. http://dx.doi. org/10.1016/j.jbi.2005.02.008. PMid:16198999.
Mallat SG. A theory for multiresolution signal decomposition: the wavelet representation. IEEE Transactions on Pattern Analysis and Machine Intelligence. 1989; 11(7):674-93. http://dx.doi.org/10.1109/34.192463.
Mirzaei A, Ayatollahi A, Vavadi H. Statistical analysis of epileptic activities based on histogram and wavelet-spectral entropy. Biomedical Science and Engineering. 2011; 4(03):207-13. http://dx.doi.org/10.4236/jbise.2011.43029.
Pacola ER, Quandt VI, Liberalesso PBN, Pichorim SF, Gamba HR, Sovierzoski MA
Montanari L, Basu B, Spagnoli A, Broderick BM. A padding method to reduce edge effects for enhanced damage identification using wavelet analysis. Mechanical Systems and Signal Processing. 2015; 52-53:264-77. http://dx.doi. org/10.1016/j.ymssp.2014.06.014.
Noachtar S, Binnie C, Ebersole J, Mauguière F, Sakamoto A, Westmoreland B. A glossary of terms most commonly used by clinical electroencephalographers and proposal for the report form the EEG Findings. Munich: Elsevier; 1999.
Nunes TM, Coelho AL, Lima CAM, Papa JP, Albuquerque VHC. EEG signal classification for epilepsy diagnosis via optimum path forest: a systematic assessment. Neurocomputing. 2014; 136:103-23. http://dx.doi.org/10.1016/j.neucom.2014.01.020.
Ocak H. Automatic detection of epileptic seizures in EEG using discrete wavelet transform and approximate entropy. Expert Systems with Applications. 2009; 36(2):2027-36. http://dx.doi.org/10.1016/j.eswa.2007.12.065.
Pacola ER, Quandt VI, Schneider FK, Sovierzoski MA. The wavelet transform border effect in EEG spike signals. In: World Congress on Medical Physics and Biomedical Engineering; 2012 May 26-31; Beijing, China. Heidelberg: Springer; 2012. p. 593-6.
Pincus SM. Approximate entropy as a measure of system complexity. Proceedings of the National Academy of Sciences of the United States of America. 1990; 88(6):2297-301. http://dx.doi.org/10.1073/pnas.88.6.2297. PMid:11607165.
Quandt VI, Pacola ER, Pichorim SF, Gamba HR, Sovierzoski MA. Pulmonary crackle characterization: approaches in the use of discrete wavelet transform regarding border effect, mother-wavelet selection, and subband reduction. Research on Biomedical Engineering. 2015; 31(2):148-59. http:// dx.doi.org/10.1590/2446-4740.0639.
Sadati N, Mohseni H, Maghsoudi A. Epileptic seizure detection using neural fuzzy networks. In: International Conference on Fuzzy Systems; 2006 July 16-21; Vancouver, Canada. New York: IEEE; 2006. p. 596-600.
Shuren Q, Zhong J. Extraction of feature information in EEG signal by virtual EEG instrument with the functions of time-Frequency analysis. In: Proceedings of 6th International Image and Signal Processing and Analysis; 2009 Sept 16-18; Salzburg. New York: IEEE; 2009. p. 7-11.
Su H, Liu Q, Li J. Boundary effects reduction in wavelet transform for time-frequency analysis. WSEAS Transactions on Signal Processing. 2012; 8:169-79.
Ubeyli ED. Combined neural network model employing wavelet coefficients for EEG signals classification. Digital Signal Processing. 2009; 19(2):297-308. http://dx.doi. org/10.1016/j.dsp.2008.07.004.
Vavadi H, Ayatollahi A, Mirzaei A. A wavelet-approximate entropy method for epileptic activity detection from EEG and its sub-Bands. Biomedical Science and Engineering. 2010; 3(12):1182-9. http://dx.doi.org/10.4236/jbise.2010.312154.
Veneri G, Federighi P, Rosini F, Federico A, Rufa A. Spike removal through multiscale wavelet and entropy analysis of ocular motor noise: a case study in patients with cerebellar disease. Journal of Neuroscience Methods. 2011; 196(2):318-26. http://dx.doi.org/10.1016/j.jneumeth.2011.01.006. PMid:21262262.
Wang C, Zou J, Zhang J, Zhang Z, Zhang C. Classifying detection of epileptic EEG based on approximate entropy in wavelet domain. In: 2nd International Conference on Biomedical Engineering and Informatics; 2009 October 17-19; Tianjin. New York: IEEE; 2009. p. 1-5.
World Health Organization. Fact sheet n° 999: epilepsy [Internet]. Geneva: WHO; 2015 [cited 2015 July 24]. Available from: http://www.who.int/mediacentre/factsheets/fs999/en/
Xu B, Song A. Pattern recognition of motor imagery EEG using Wavelet transform. Journal of Biomedical Science and Engineering Research Publishing. 2008; 1(01):64-7. http://dx.doi.org/10.4236/jbise.2008.11010.
Youden W. Index for rating diagnostic tests. Cancer. 1950; 3(1):32-5. http://dx.doi.org/10.1002/1097-0142(1950)3:1<32::AID-CNCR2820030106>3.0.CO;2-3. PMid:15405679.
Authors
Edras Reily Pacola1*, Veronica Isabela Quandt1, Paulo Breno Noronha Liberalesso2, Sergio Francisco Pichorim1,
Humberto Remigio Gamba1, Miguel Antonio Sovierzoski3
1 Programa de Pós-graduação em Engenharia Elétrica e Informática Industrial – CPGEI, Universidade Tecnológica Federal
do Paraná – UTFPR, Avenida Sete de Setembro, 3165, CEP 80230-901, Curitiba, PR, Brazil.
2 Neuropediatric Department, Hospital Pequeno Príncipe, Curitiba, PR, Brazil.
3 Programa de Pós-graduação em Engenharia Biomédica – PPGEB, Universidade Tecnológica Federal do Paraná –
UTFPR, Curitiba, PR, Brazil.