www.atmos-meas-tech.net/5/913/2012/ doi:10.5194/amt-5-913-2012
© Author(s) 2012. CC Attribution 3.0 License.
Measurement
Techniques
Multi-sensor Aerosol Products Sampling System (MAPSS)
M. Petrenko1,2, C. Ichoku2, and G. Leptoukh2,†
1Earth System Science Interdisciplinary Center, University of Maryland, College Park, Maryland, USA 2NASA Goddard Space Flight Center, Greenbelt, Maryland, USA
†deceased
Correspondence to:M. Petrenko ([email protected])
Received: 14 November 2011 – Published in Atmos. Meas. Tech. Discuss.: 26 January 2012 Revised: 10 April 2012 – Accepted: 12 April 2012 – Published: 4 May 2012
Abstract. Global and local properties of atmospheric aerosols have been extensively observed and measured using both spaceborne and ground-based instruments, especially during the last decade. Unique properties retrieved by the dif-ferent instruments contribute to an unprecedented availabil-ity of the most complete set of complimentary aerosol mea-surements ever acquired. However, some of these measure-ments remain underutilized, largely due to the complexities involved in analyzing them synergistically. To characterize the inconsistencies and bridge the gap that exists between the sensors, we have established a Multi-sensor Aerosol Prod-ucts Sampling System (MAPSS), which consistently sam-ples and generates the spatial statistics (mean, standard de-viation, direction and rate of spatial variation, and spatial correlation coefficient) of aerosol products from multiple spaceborne sensors, including MODIS (on Terra and Aqua), MISR, OMI, POLDER, CALIOP, and SeaWiFS. Samples of satellite aerosol products are extracted over Aerosol Robotic Network (AERONET) locations as well as over other loca-tions of interest such as those with available ground-based aerosol observations. In this way, MAPSS enables a direct cross-characterization and data integration between Level-2 aerosol observations from multiple sensors. In addition, the available well-characterized co-located ground-based data provides the basis for the integrated validation of these prod-ucts. This paper explains the sampling methodology and concepts used in MAPSS, and demonstrates specific exam-ples of using MAPSS for an integrated analysis of multiple aerosol products.
1 Introduction
Atmospheric aerosol parameters are routinely retrieved from an array of ground-based and spaceborne sensors and archived for public access, especially since the 1990s (Hol-ben et al., 1992, 1998; Herman et al., 1997; Husar et al., 1997; Deuz´e et al., 1999; Mishchenko et al., 1999; Igna-tov and Stowe, 2002; Chu et al., 2002; Remer et al., 2002; Hsu et al., 2004; Ichoku et al., 2005; Torres et al., 2007; Winker et al., 2007; Levy et al., 2009). However, the inte-grated use of these observations is greatly complicated by the numerous discrepancies and differences that exist be-tween the sensors and their aerosol products, including dis-similar spatial and temporal resolutions, archival strategies, approaches to quality control, and so forth (Kahn et al., 2007; Liu and Mishchenko, 2008; Li et al., 2009). The problem is further complicated by the differences in the algorithms, un-derlying assumptions, and uncertainties involved in creating the products.
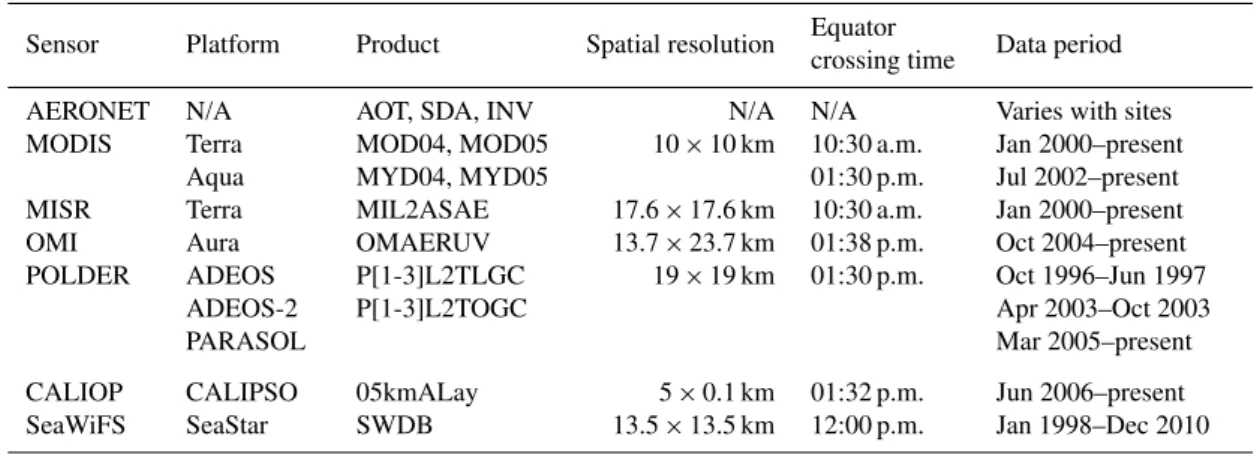
Table 1.Atmospheric aerosol measurement instruments and products supported in MAPSS. The indicated local equatorial crossing times are based on the original orbital designs, and can change during the lifetimes of the satellites.
Sensor Platform Product Spatial resolution Equator
crossing time Data period AERONET N/A AOT, SDA, INV N/A N/A Varies with sites MODIS Terra
Aqua
MOD04, MOD05 MYD04, MYD05
10×10 km 10:30 a.m. 01:30 p.m.
Jan 2000–present Jul 2002–present MISR Terra MIL2ASAE 17.6×17.6 km 10:30 a.m. Jan 2000–present
OMI Aura OMAERUV 13.7×23.7 km 01:38 p.m. Oct 2004–present POLDER ADEOS
ADEOS-2 PARASOL
P[1-3]L2TLGC P[1-3]L2TOGC
19×19 km 01:30 p.m. Oct 1996–Jun 1997 Apr 2003–Oct 2003 Mar 2005–present CALIOP CALIPSO 05kmALay 5×0.1 km 01:32 p.m. Jun 2006–present SeaWiFS SeaStar SWDB 13.5×13.5 km 12:00 p.m. Jan 1998–Dec 2010
and Directionality of the Earth’s Reflectances (POLDER) on Parasol and its heritage ADEOS and ADEOS-2 satel-lites, the Cloud-Aerosol Lidar with Orthogonal Polarization (CALIOP) on Calipso, as well as aerosol retrievals using the Deep Blue algorithm from the Sea-viewing Wide Field-of-view Sensor (SeaWiFS) aboard the SeaStar spacecraft. Like the original MAPSS, this multi-sensor version is also based on the collocation of the satellite data products over the global AERosol Robotic NETwork (AERONET) of ground-based sun-photometer stations and over other important sites. The relevant characteristics of the aerosol data products from the different sensors are described in Sect. 2, while the details of the MAPSS sampling concepts are explained in Sect. 3. The implementation of MAPSS on the Web, online data access and analysis approaches, and user tips are de-scribed in Sect. 4. Section 5 discusses possible applications of the proposed system, followed by conclusions in Sect. 6.
2 Supported aerosol products
This work focuses on aerosol observations from multiple ground-based and spaceborne instruments; the supported in-struments, products, and some of their key characteristics are outlined in Table 1. It is pertinent to note that all satellite data products supported in MAPSS are derived directly from the retrieval level aerosol products (Level 2); the Level 2 data represents the highest available spatial resolution for each product/sensor combination and is free of aggregation arti-facts that can be present in data at Level 3 (Levy et al., 2009; Zhang and Reid, 2010; Hyer et al., 2011). The remainder of this section provides a brief description of each of the prod-ucts supported in MAPSS, while highlighting unique aerosol properties reported in these products.
AERONET (http://aeronet.gsfc.nasa.gov) sun-photometers measure aerosol properties using ground-based observations of solar direct and diffuse radiances in three observation configurations (direct solar, principal plane,
The MISR (http://www-misr.jpl.nasa.gov) aerosol product (MIL2ASAE) features aerosol retrievals based on observa-tions from 9 independent camera angles. Multiple viewing angles allow MISR to measure certain aerosol properties that are not available from the other instruments (e.g., aerosol par-ticle size). Furthermore, MISR multiple cameras enable re-trievals under conditions that are unfavorable to single-view (e.g., nadir) instruments, such as over bright surfaces or sun glint, where the other instruments are unable to make reliable retrievals in the visible wavelengths.
The OMI (http://www.knmi.nl/omi/research/instrument/ index.php) aerosol product (OMAERUV) measures the near-UV (near ultraviolet) aerosol absorption and extinction opti-cal depth, as well as single scattering albedo, among other aerosol properties. Moreover, OMI is capable of retrieving absorption optical depth in partially cloudy conditions that usually pose a challenge to other aerosol instruments.
The POLDER (http://www.icare.univ-lille1.fr/parasol) aerosol land product (PxL2TLGC) and aerosol ocean product (PxL2TOGC) are derived from measuring spectral, directional, and polarized properties of reflected solar radi-ation. One of the main features of the POLDER instrument is its utilization of polarization properties of the measured radiation for retrieving anthropogenic aerosol optical depth.
The CALIOP (http://www-calipso.larc.nasa.gov) aerosol product (05kmALay) represents atmospheric curtain slices portraying the vertical distribution of aerosols and clouds in the atmosphere, including the density and certain properties of individual aerosol layers.
The SeaWiFS (http://disc.sci.gsfc.nasa.gov/dust/) aerosol product (SWDB) uses the Deep Blue (Hsu et al., 2004) algo-rithm to derive aerosol optical thickness and ˚Angstr¨om ex-ponent. The key features of this product are the retrievals of aerosol properties over both bright desert and vegetated sur-faces, and a highly precise calibration of the SeaWiFS sensor. Since each of the foregoing data sets has a few versions be-cause of the periodic revisions and updates of their retrieval algorithms over time, the data versions that were current at the time of MAPSS development were processed. Collection 051 was processed for both Terra and Aqua MODIS, Ver-sion 0022 for MISR, VerVer-sion 003 for OMI, VerVer-sion 3-01 for CALIOP, Version K for POLDER, Version 003 for SeaWiFS (preliminary version), Version 2 for the AERONET AOD and INV products, and Version 4.1 for the AERONET SDA prod-uct. Therefore, unless otherwise specified, all of the illustra-tions and analyses shown in this paper are based on these data versions for the respective satellite sensors, and Version 2 for AERONET.
3 Data sampling and analysis
The proposed framework expands on the concepts of the sampling approach that was developed by Ichoku et al. (2002), and used for validation and analysis of MODIS
aerosol products using AERONET measurements (Remer et al., 2002; Chu et al., 2002; Ichoku et al., 2003, 2005). In the original approach, the spatial aerosol measurements acquired aboard the Terra and Aqua spacecraft were sampled within 50×50 km areas, centered over AERONET sun photometer measurement sites, as well as over certain other point loca-tions where the satellite aerosol data samples are required. The pixel containing the ground station was determined by finding a pixel with the minimal Euclidian distance between the longitude/latitude coordinates of the center of this pixel and those of the ground station. Next, the extent of the sam-pling area was determined by finding surrounding pixels lo-cated no more than 25 km from the central pixel, based on the Euclidean distance between their longitude and latitude coor-dinates. In turn, temporal measurements from each ground-based location were sampled at each satellite overpass time in 1-h sampling segments (i.e., 30 min before and 30 min after the overpass).
The Multi-sensor Aerosol Products Sampling System (MAPSS) described in this paper uses a similar sampling ap-proach and includes data sampling from a wider variety of spaceborne aerosol sensors, as outlined in Table 1. To ac-commodate the various resolutions of the extended set of the supported aerosol products and to make their ground sampled areas as equivalent as possible, instead of sampling within the nominal 50×50-km square used for MODIS in the
Fig. 1.Overview of the sampling framework used in MAPSS. Sam-pling of each spatial spaceborne aerosol product involves extract-ing values of the pixels that fall within an approximate radius of 27.5 km from the chosen locations. Similarly, ground-based tempo-ral observations in a particular location are sampled from measure-ments taken within 30 min before and 30 min after a satellite passes over this location.
Table 1), the maximum number of pixels within the 55-km diameter sample space at nadir for the different sensors are as follows: MODIS – 25, MISR – 9, OMI – 8, POLDER – 9, CALIOP – 11, and SeaWiFS – 16.
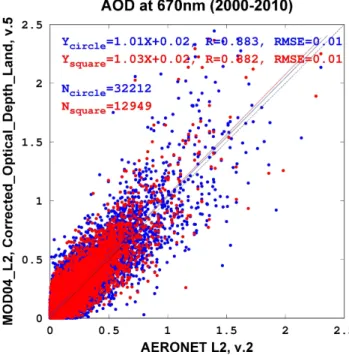
To determine the effects (if any) of using the circular (in-stead of square) sample space on the sample statistics, means of Terra MODIS Collection 5 AOD derived from both sample spaces (i.e., 50×50-km square and 55-km diameter circle) were calculated and plotted against corresponding statistics from AERONET for comparison (Fig. 2). The results indi-cate that the difference in the shape of the sampling space has only a small effect on the derived sample statistics of the data. However, it was found that the circle-based sampling produced approximately 22 % fewer data points: 2 394 624 data points were generated for the studied 10-yr period using the square-based sampling, while only 1 881 858 data points were produced using the circle-based sampling. This differ-ence can be explained by recalling that, when the ground sta-tion is located off-nadir of the sensor or off-center of the cen-tral pixel in the sample space, in order to maintain a uniform sampling area, the number of pixels in a circle-based sam-ple can be much reduced even down to 1, depending on the sensor observation geometry and how far the ground station is located off-nadir. This can result in a null subset, if none of the reduced number of sample points contains aerosol re-trieval. In contrast, the number of pixels in the square-based samples remains roughly constant regardless of the retrieval
Fig. 2.Impact of the sampling approach on the correlation coeffi-cient (R) between meansof AERONET AOD and Terra MODIS Collection 005 AOD (QA = 3) at 670 nm over land. Circle-based sampling used in the new MAPSS shows results similar to the square-based sampling used in the original MAPSS.
geometry conditions, resulting in the larger number of data points. Additionally, the further inspection of the data re-vealed that, while the number of the data points decreased uniformly over most of the sampling locations, it increased in certain locations, including islands, coastal areas, and lo-cations in high latitudes. This difference can be attributed to the greater accuracy of the Haversine formula used in the new circle-based sampling compared to the Euclidean distance approach that was used previously. In the MAPSS applica-tion, the Haversine formula is accurate within approximately 200 m, which allows a high precision for improving sampling in the above-mentioned areas, where aerosol retrievals are scarcer.
3.1 Statistics of sampled data
on the “valid range” pair of values specified in the metadata for some of the data products. Where such valid range is not specified in the data, a quantitatively reasonable valid range is assumed. For instance, 0–180◦is set as the valid range for “solar zenith angle” because this is the known normal range for this type of zenith-to-nadir angular parameter. Further-more, since fill values (usually large negative numbers like
−9999) are used in the different data sets to indicate non-retrieval or other data gaps, as well as other spurious values that may occur in any of the data products, they are automati-cally excluded from the statistics calculations. No other filter-ing is applied to the data before the statistics are calculated. The statistics include:
– ndat– total number of data points sampled (e.g., num-ber of pixels contained within the 55-km sample space in a satellite dataset);
– nval– number of sampled data points with valid data for use in the statistics calculation;
– cval– value of the central sampling data point in a sub-set. For the spaceborne data, this is the point in the sam-ple that has the smallest distance to the ground station. For the ground-based data, this is the point in the sample that is the closest in time to the overpass of the satellite; – mean– mean of the subset;
– medn– median of the subset; – mode– mode of the subset;
– sdev – sample standard deviation of the subset (note: whennval≤1, this value is undefined as opposed
to zero).
It is important to note thatmean,median, andsdevare com-puted only for continuous datasets (i.e., datasets comprising real numbers). On the other hand,mode is computed only for discrete datasets (i.e., datasets comprising only integer numbers, for example, integer data quality flags).
It is pertinent to note that, since the ground-based AERONET measurements are sampled and recorded in the MAPSS archive for every satellite overpass, in cases where multiple satellites pass over a particular location within a 1-h timeframe (e.g., satellites in the A-Train formation), a single AERONET measurement can be sampled and recorded in the archive multiple times. It is recommended to account for this duplication when further aggregation of the AERONET data in the MAPSS archive is performed, in order to avoid possi-ble oversampling issues.
3.2 Characterizing the spatio-temporal variability of the data
The sampling of the satellite aerosol data beyond the pixels lying directly over the ground stations is intended to provide
not only the average values of the measured parameters, but also their local variability and other characteristics (over the 55-km sample space around the station) that can enhance detailed scientific research and validation. Therefore, in ad-dition to computing the basic statistical parameters, a lin-ear multiple regression plane is fitted to each spatial subset, and a linear regression line to each temporal subset (Fox, 1997; Ichoku et al., 2002). Based on this fit, the following additional statistics are computed:
– slop– slope of the fitted plane or line;
– slaz– azimuth (direction) of the slope of the plane; – mcoc/lcoc– multiple correlation coefficient (for a
spa-tial subset regressed on the lat/lon coordinates of the sample points) or linear correlation coefficient (for a temporal subset regressed on the measurement times of the ground-based data samples such as those of AERONET).
These (slop,slaz, andmcoc/lcoc) statistics are not computed unless the number of sampled valid data points is sufficient to obtain a statistically robust fit for the plane or line. To en-sure that this condition is met, the shape, size and maximum number of pixels that fall within the nadir sampling area of each sensor were carefully examined. Based on this em-pirical analysis, the minimal required number of valid data points to fit a plane was determined for each sensor so that these points do not form a degenerate plane; in other words, the data points in a subset should not all fall on the same line. In this way, the minimal numbers of valid data points re-quired to fit a plane were set for the different aerosol products as: MODIS – 10, MISR – 5, OMI – 4, POLDER – 5, SeaW-iFS – 7. Likewise, the minimal number of valid data points required to fit a line for AERONET and CALIOP aerosol products was set to 2, as this is the minimal number of points that can be used to uniquely define a line.
Fig. 3.True-color picture of Alaska forest fires acquired by the Terra MODIS sensor on 15 August 2005 at 22:15 UTC over Bo-nanza Creek AERONET station. The smaller circle in the center of the picture shows the location of the station, while the larger circle highlights the MAPSS sampling area over this station. The red arrow represents the azimuth of the slope of the fitted plane (slaz= 194.86). In this particular case, the azimuth is co-directional with the flow of the wind and indicates the direction of the smooth (slop= 22.38) gradient of aerosol loading in the area, produced by the wind. Please note that the thick smoke plume in the left part of the sampling area has no AOD retrieval. MAPSS parameters for this case:slaz: 194.86,slop: 22.38,mcoc: 0.53,mean: 0.8,cval: 0.74,
sdev: 0.1,ndat: 14,nval: 11.
3.3 Quality assurance (QA) data
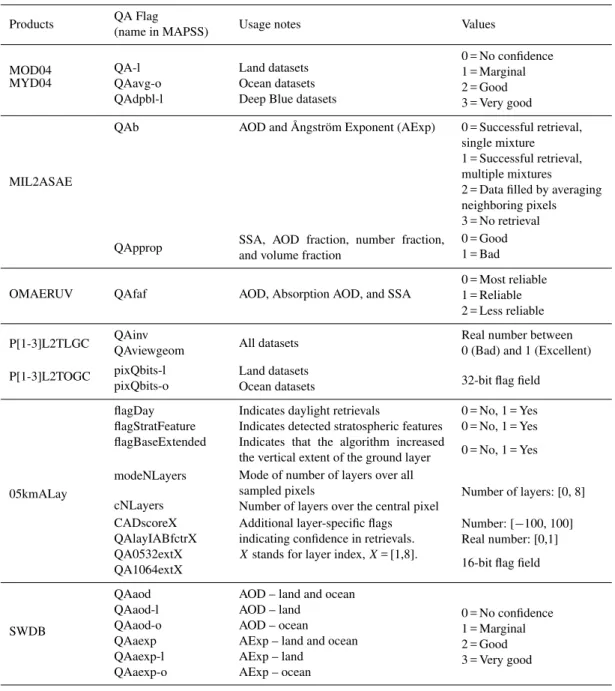
The Level-2 aerosol products from all of the satellite sen-sors supported in MAPSS include quality assurance/quality control (QA) flags that indicate the “trustworthiness” of in-dividual pixels in these datasets. For MODIS and SeaWiFS, aerosol QA flags are integer numbers ranging from 0 to 3, with 3 representing the highest quality. For the MISR and OMI data, the reverse is the case (i.e., 0 is the highest qual-ity). Finally, for POLDER and CALIOP, QA data are a com-bination of one or more flags, most of which are real num-bers ranging between 0 and 1, where 1 indicates the high-est quality. Table 2 provides a short summary of the dis-cussed QA flags, while for detailed guidelines on the us-age of these flags, depending on a particular science appli-cation, it is advised to consult the up-to-date science team recommendations for the analyzed products.
The QA values are set by the product retrieval algorithms and can be used to screen the data of pixels with potentially uncertain or erroneous retrievals or even invalid values. To
Fig. 4.True-color picture of Alaska forest fires acquired by the Aqua MODIS sensor on 15 August 2005 at 22:30 UTC over Bo-nanza Creek AERONET station. The smaller circle in the center of the picture shows the location of the station, while the larger circle highlights the MAPSS sampling area over this station. The red arrow represents the azimuth of the slope of the fitted plane (slaz= 164.83). In this case, the arrow points from the pixels in the sample with the highest AOD (thick smoke plume) to the pix-els with the lowest AOD (thin smoke plume), as indicated by the steeper slope of the fitted plane (slop= 48.53). Please note that in this case MODIS was able to successfully retrieve AOD in the thick smoke plume in the left part of the sampling area. MAPSS param-eters for this case:slaz: 164.83,slop: 48.53,mcoc: 0.52,mean: 0.9,
cval: 0.81,sdev: 0.3,ndat: 21,nval: 19.
facilitate such screening, MAPSS extracts the QA flags over the sampling area and computes the statistical mode for in-teger QA flags and mean for real QA flags. These statistical modes of the integer QA flags and means of the real QA flags provide an equivalent of a single number quality assessment for each sample, and can be used to screen the corresponding subset statistics, as demonstrated in Fig. 5.
Table 2.Summary of the quality assurance/quality control (QA) flags and their values for the aerosol products supported in MAPSS. Note that “Land” and “Ocean” are used to indicate aerosol products retrieved over Land and Ocean, respectively.
Products QA Flag
(name in MAPSS) Usage notes Values
MOD04 MYD04
QA-l QAavg-o QAdpbl-l
Land datasets Ocean datasets Deep Blue datasets
0 = No confidence 1 = Marginal 2 = Good 3 = Very good
MIL2ASAE
QAb
QApprop
AOD and ˚Angstr¨om Exponent (AExp)
SSA, AOD fraction, number fraction, and volume fraction
0 = Successful retrieval, single mixture 1 = Successful retrieval, multiple mixtures 2 = Data filled by averaging neighboring pixels 3 = No retrieval 0 = Good 1 = Bad
OMAERUV QAfaf AOD, Absorption AOD, and SSA
0 = Most reliable 1 = Reliable 2 = Less reliable
P[1-3]L2TLGC
P[1-3]L2TOGC
QAinv QAviewgeom pixQbits-l pixQbits-o
All datasets
Land datasets Ocean datasets
Real number between 0 (Bad) and 1 (Excellent)
32-bit flag field
05kmALay
flagDay flagStratFeature flagBaseExtended
modeNLayers
cNLayers CADscoreX QAlayIABfctrX QA0532extX QA1064extX
Indicates daylight retrievals
Indicates detected stratospheric features Indicates that the algorithm increased the vertical extent of the ground layer Mode of number of layers over all sampled pixels
Number of layers over the central pixel Additional layer-specific flags indicating confidence in retrievals.
Xstands for layer index,X= [1,8].
0 = No, 1 = Yes 0 = No, 1 = Yes
0 = No, 1 = Yes
Number of layers: [0, 8]
Number: [−100, 100]
Real number: [0,1]
16-bit flag field
SWDB
QAaod QAaod-l QAaod-o QAaexp QAaexp-l QAaexp-o
AOD – land and ocean AOD – land
AOD – ocean AExp – land and ocean AExp – land
AExp – ocean
0 = No confidence 1 = Marginal 2 = Good 3 = Very good
this subset; (b)meanandcvalvalues were based on all pixels in a subset, but only if the mode of QA flags over this sub-set was “Best” (i.e., 3 for MODIS and 0 for OMI); (c)mean andcvalvalues were based only on those pixels in a subset that had the “Best” QA flag. The additional factor consid-ered in the comparison was the number of the data pixels in the compared subsets (i.e.,nval).
It was found that the screening of the aerosol parameter subset statistics by their QA mode produces results that are similar to the screening of individual pixels by their QA be-fore computing the statistics, although the former method re-sults in slightly fewer data points, since an entire subset can
be rejected based on the average QA value even if some of its component individual pixels have good QA flags. However, this is a small trade-off compared to the increased amount of effort involved in pre-screening before statistics.
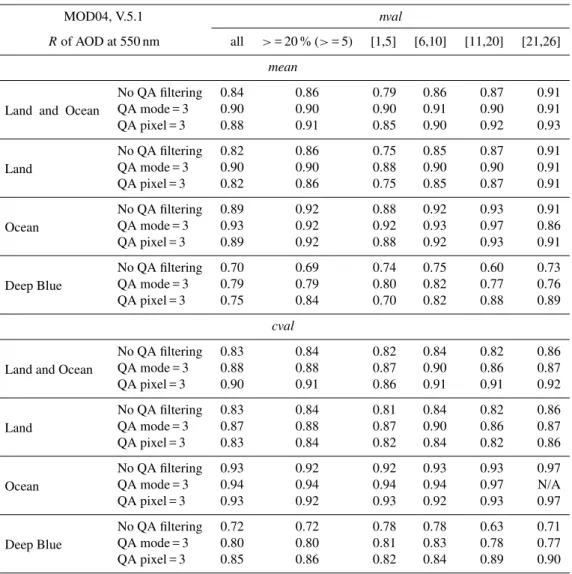
Table 3.Correlation coefficient (R) betweenmean values of AERONET AOD and Terra MODIS AOD at 550 nm depending on different MODIS data screening scenarios, and also betweencval (value of the central pixel in the sample) values of these two products. Factors considered for the screening include QA (Quality Assurance) flags of individual data pixels, mode of QA flags of all valid pixels in the sample, andnval(number of valid pixels in the sample). MODIS QA value of 3 indicates the data with the best quality. Correlation values for themediansof AOD are not shown as they are only marginally different from the reported values for themeansof AOD. AERONET data was interpolated to 550 nm and screened to havenvalof at least 4.
MOD04, V.5.1 nval
Rof AOD at 550 nm all >= 20 % (>= 5) [1,5] [6,10] [11,20] [21,26]
mean
Land and Ocean
No QA filtering 0.84 0.86 0.79 0.86 0.87 0.91 QA mode = 3 0.90 0.90 0.90 0.91 0.90 0.91 QA pixel = 3 0.88 0.91 0.85 0.90 0.92 0.93
Land
No QA filtering 0.82 0.86 0.75 0.85 0.87 0.91 QA mode = 3 0.90 0.90 0.88 0.90 0.90 0.91 QA pixel = 3 0.82 0.86 0.75 0.85 0.87 0.91
Ocean
No QA filtering 0.89 0.92 0.88 0.92 0.93 0.91 QA mode = 3 0.93 0.92 0.92 0.93 0.97 0.86 QA pixel = 3 0.89 0.92 0.88 0.92 0.93 0.91
Deep Blue
No QA filtering 0.70 0.69 0.74 0.75 0.60 0.73 QA mode = 3 0.79 0.79 0.80 0.82 0.77 0.76 QA pixel = 3 0.75 0.84 0.70 0.82 0.88 0.89
cval
Land and Ocean
No QA filtering 0.83 0.84 0.82 0.84 0.82 0.86 QA mode = 3 0.88 0.88 0.87 0.90 0.86 0.87 QA pixel = 3 0.90 0.91 0.86 0.91 0.91 0.92
Land
No QA filtering 0.83 0.84 0.81 0.84 0.82 0.86 QA mode = 3 0.87 0.88 0.87 0.90 0.86 0.87 QA pixel = 3 0.83 0.84 0.82 0.84 0.82 0.86
Ocean
No QA filtering 0.93 0.92 0.92 0.93 0.93 0.97 QA mode = 3 0.94 0.94 0.94 0.94 0.97 N/A QA pixel = 3 0.93 0.92 0.93 0.92 0.93 0.97
Deep Blue
No QA filtering 0.72 0.72 0.78 0.78 0.63 0.71 QA mode = 3 0.80 0.80 0.81 0.83 0.78 0.77 QA pixel = 3 0.85 0.86 0.82 0.84 0.89 0.90
somewhat less reliable results than the screening of indi-vidual pixels, where highernvalvalues are also associated with the less reliable correlations to the AERONET measure-ments. These observations indicate a certain inhomogene-ity in the uncertainties that are present in these two aerosol products, such that, in some cases, high biases in individ-ual pixels might overwhelm the statistics derived from the sample set. For instance, a significant (>20 %) overestima-tion of AOD in certain OMI pixels due to sub-pixel cloud contamination (e.g., Torres et al., 1998) can cause such a bias, although a more detailed study is needed to characterize this quantitatively.
4 Data management and accessibility
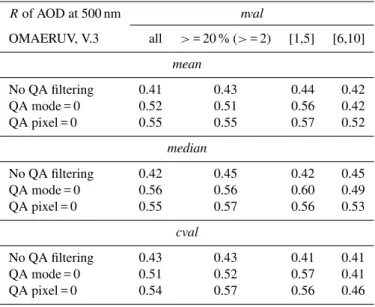
Table 4.Correlation coefficient (R) betweenmeans,medians, andcvals(value of the central pixel in the sample) of AERONET AOD and OMI AOD at 500 nm depending on different OMI data screening scenarios. Factors considered for the screening include QA (Quality Assurance) flags of individual data pixels, mode of QA flags of all valid pixels in the sample, andnval(number of valid pixels in the sample). OMI QA value of 0 indicates the data with the best quality. AERONET data was interpolated to 500 nm and screened to havenvalof at least 4. OMI data was additionally screened to exclude data points with AOD>= 6, which comprise 130 of approximately 50 000 data points when computing the statistics for “No QA filtering”, and 5 of approximately 35 000 data points when computing the statistics for “QA mode = 0”.
Rof AOD at 500 nm nval
OMAERUV, V.3 all >= 20 % (>= 2) [1,5] [6,10]
mean
No QA filtering 0.41 0.43 0.44 0.42 QA mode = 0 0.52 0.51 0.56 0.42 QA pixel = 0 0.55 0.55 0.57 0.52
median
No QA filtering 0.42 0.45 0.42 0.45 QA mode = 0 0.56 0.56 0.60 0.49 QA pixel = 0 0.55 0.57 0.56 0.53
cval
No QA filtering 0.43 0.43 0.41 0.41 QA mode = 0 0.51 0.52 0.57 0.41 QA pixel = 0 0.54 0.57 0.56 0.46
4.1 Batch processing
An automated software system has been developed to per-form the multi-sensor aerosol sampling and statistical analy-sis in batch mode at pre-specified times. The MAPSS sys-tem interrogates the list of ground sites to determine the current list of sites over which data sampling is to be per-formed. It then fetches the aerosol data products from the on-line data sources of the supported satellite sensors to extract data subsets and derive their relevant statistics, as described in the previous section. Similarly, available AERONET data are obtained and sampled to derive corresponding tempo-ral statistics. These analyses are performed on a daily ba-sis, and the derived subset statistics are archived in sim-ple comma-separated text (CSV) files that are easily acces-sible online (http://modis-atmos.gsfc.nasa.gov/MAPSS/; as of August 2011, this archive contained over 1 420 000 CSV files). However, in some cases, there may be a delay of sev-eral days between the time the data becomes available in a particular sensor’s data repository and the time the extracted subset statistics become accessible in MAPSS. This delay is associated with the time required for data retrieval and processing. Also, there are likely to be some data gaps re-sulting from the inability of the different sensor algorithms to retrieve certain aerosol parameters due to unfavorable conditions, such as certain types of surface characteristics, clouds in reflective bands, sun glint over ocean, or even data downtime for sensor calibrations.
4.2 The MAPSS database and data structure
The multi-sensor aerosol data analysis requires exploration of how to organize such a diverse set of data in a coher-ent, user-friendly, manner to facilitate access and analysis. While a basic examination of the data can be effectively per-formed using the described comma-separated text (CSV) file archive, the sheer amount of the sampled data and the lim-itations of the text file access make a more sophisticated analysis less practical. Therefore, it was necessary to estab-lish a relational database that would streamline the access and the querying of the data. For this purpose, a dedicated PostgreSQL (http://www.postgresql.org) database was cre-ated, with the data structure designed to precisely reflect the logical organization of the sampled data.
The database is organized as a collection of individual data records, where each data record stores a sampled set of mea-surements that are acquired by a specific sensor at a specific location and at a specific time, and a corresponding list of an-cillary data, including the measurement geometry (e.g., solar zenith at the time of the measurement, sensor azimuth, etc.) and QA information. Additionally, each data record is asso-ciated with data provenance information such as the name of the aerosol data file sampled, and the location of the cen-tral sampling point (cval) in this file. This information pro-vides for quick access to the original data and allows for more detailed exploration of data points of interest.
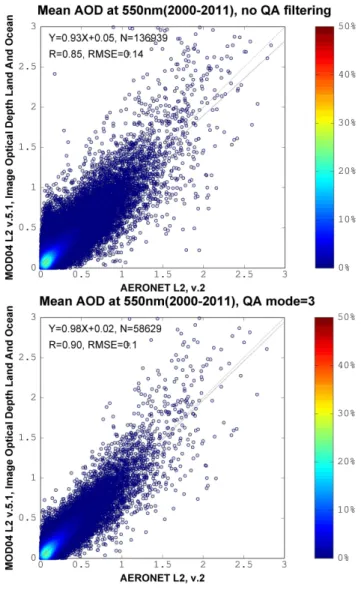
Fig. 5.Correlation coefficient (R) between themeansof AERONET AOD and MODIS AOD at 550 nm: (a) without QA screening, and (b) with the screening by the MODIS QA mode = 3 (Best). AERONET data was interpolated to 550 nm. The color scale high-lights the data density, indicating the percent of all data points that are distributed in a particular area of the plot.
a specific aerosol sensor, as described in Sects. 3.1 and 3.2. For example, AOD, Fine Mode Fraction, Top of Atmosphere (TOA) Reflectance, and other aerosol parameters in the Aqua MODIS aerosol product (MYD04), sampled at 18:08 UTC over the GSFC site on 6 July 2010, comprise a single data record, whereasmean,sdev,mcoc,and other statistics com-puted from the data sample for AOD at 550 nm constitute a single statistics record.
The database is routinely populated with the most cur-rent information from the MAPSS CSV files. In Au-gust 2011, the database contained 28 818 432 data records and 1 613 178 051 statistics records. This size, however, poses a set of database maintenance challenges, where the operations necessary to keep the database consistent and
Fig. 6.Web MAPSS data selection interface. In this example, a user has selected GSFC (USA) sampling location. He/she has also se-lectedmeansof two aerosol products (i.e., AOD from MODIS and OMI) and requested to output data only with the best QA flags. The selected time period is from 1 September 2007 to 1 December 2007. A pop-up message displays a summary for the OMI AOD at 500 nm data set.
up-to-date require a substantial computation time. Therefore, the information in the database can be less current than the information in the CSV archive.
It is expected that as new product versions become avail-able, they will also be extracted and organized in the MAPSS database, such that it would also be possible, if desired, to ac-cess and compare different versions of aerosol retrievals from the same sensor.
4.3 Web MAPSS
Fig. 7.A time series plot comparingmeansof MODIS and OMI AOD at GSFC, produced by Web MAPSS for the parameters shown in Fig. 6. Note that this is just an illustration of the Web MAPSS graphic output, and not to be considered as a fair comparison, as the Aqua-MODIS data shown on this plot reports AOD at 550 nm, whereas Aura-OMI AOD measurements are reported at 500 nm.
a graphic plot of the data, as shown in Fig. 7. The selected data sets are also formatted and staged for download as a comma-separated CSV text file. In this way, Web MAPSS allows the user to quickly and intuitively assess a combina-tion of aerosol properties from multiple satellite sensors col-located with AERONET ground-based measurements over one or more ground locations, without having to download vast amounts of data from disparate product archives. In ad-dition, MAPSS provides documentation explaining the basic attributes of each sampled product, complete with links to the relevant algorithm theoretical basis documents (ATBD) of the original products, thereby saving the time needed for locating these documents and facilitating an exploration of unfamiliar aerosol products.
5 Applications
Several possible applications of the data sampled by the MAPSS system have been envisioned. For example, the sam-pled data can be used for comparing spaceborne observations with corresponding ground-based measurements. Based on such comparison, it would be possible to assess the accuracy of aerosol retrievals from multiple spaceborne instruments in a manner similar to the validation studies of the MODIS aerosol products (Chu et al., 2002; Remer et al., 2002, 2005, 2008; Ichoku et al., 2003, 2005; Levy et al., 2010).
Simultaneous comparison of aerosol retrieval accuracy from multiple satellite sensors can help investigate the
Fig. 8.An example of aerosol analysis using MAPSS: a scatter plot showing the squared correlation coefficient (R2)between themeans
of AERONET AOD and AOD retrieved by different spaceborne sensors in 2003–2011 over Evora (Portugal) and Bondville (USA). Data were screened using the following set of QA flags: MODIS QA = 3 (Best), MISR QA<= 1 (Successful retrieval), OMI QA = 0 (Best).
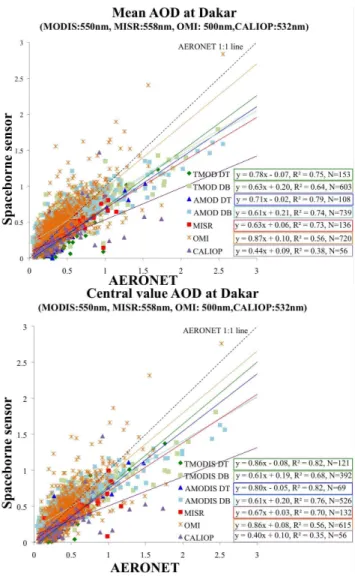
Fig. 9.An example of aerosol analysis using MAPSS: a scatter plot between AOD retrieved by AERONET and several spaceborne sen-sors in 2000–2011 over Dakar (Senegal). The top plot shows the squared correlation coefficient (R2)betweenmeansof subset val-ues, while the bottom plot comparescvalsof subset values (central data point values). Data were screened using the following set of QA flags: MODIS (land) QA = 3 (Best), MISR QA<=1 (Successful retrieval), OMI QA = 0 (Best).
(TMOD DB), Aqua MODIS Dark Target – land (AMOD DT), Aqua MODIS Deep Blue – land (AMOD DB), MISR, OMI, and CALIOP. A comparison of the regression equa-tions and squared correlation coefficients from the different sensors over the two locations highlight differences that exist in aerosol retrievals from multiple sensors.
Also, the spatial statistics collected by MAPSS can pro-vide an insight into the spatial consistency of spaceborne retrievals. For example, Fig. 9 shows linear regression fits of (a)mean, and (b) central values (i.e., cval) of AOD re-trievals from the same set of satellite sensors against the cor-responding interpolated AERONET data. Themeanandcval plots show fairly similar fits, with the MODIScvalfits being
Fig. 10.An example of aerosol analysis using MAPSS: differences (deltas) inmeans of AOD between ground-based and spaceborne observations in 2003–2010 over Dakar, plotted against the number of aerosol layers detected over this location. Data were screened using the following set of QA flags: OMI QA = 0, POLDER (Ocean) Inversion QA>0.7.
slightly better, indicating that spaceborne MODIS AOD re-trievals directly over Dakar (Senegal) are more accurate than the overall retrievals in the area surrounding Dakar. This could probably be explained by difficulties associated with retrieving aerosol properties over complex mixed environ-ments due to their inherent surface inhomogeneities, partic-ularly given the tendency for the occurrence of complex mix of marine aerosols, Saharan dust, urban pollution, and smoke from biomass burning in that region.
based on layer retrievals from Calipso-CALIOP. In part, this difference can be explained by the possibility that multiple layers in a column can indicate multiple aerosol types and a multimodal size distribution, in contrast to the single aerosol layer monomodal models assumed in the retrieval algorithms of these instruments (Deuz´e et al., 1999; Torres et al., 1998). Also, the high sensitivity of the OMI algorithm to aerosol layer height and the low sensitivity of the POLDER algo-rithm to non-polarizing particles might further contribute to the observed phenomenon (Boucher and Tanre, 2000; Torres et al., 2007).
Finally, the MAPSS database can be used as a data source for other aerosol investigation projects. For example, the AeroStat system (http://giovanni.gsfc.nasa.gov/aerostat/) uses the MAPSS database for assessing systematic biases that can possibly exist in aerosol measurements retrieved by different sensors.
6 Conclusions
The Multi-sensor Aerosol Products Sampling System (MAPSS) provides a consistent sampling approach that en-ables easy and direct inter-comparison and ground-based val-idation of the diverse aerosol products from different satellite sensors in a uniform and consistent way. Prospective users of MAPSS are encouraged to study data usage guidelines and precautions provided in Sects. 3.1–3.3, in order to avoid pos-sible data quality and oversampling biases.
The range of statistics collected in MAPSS facilitates the investigation of various spatio-temporal properties of aerosols, as observed from multiple sensors with comple-mentary capabilities, thereby helping to expand our under-standing of the distribution and environmental impact of aerosols from different perspectives at local scales, with the possibility of extension by aggregation to global scales. In-deed, the readily available unified access to distinct aerosol parameters from multiple sensors provides a platform for acquiring a more complete understanding of the inter-relationships that may exist between the different physical properties of aerosols, which cannot all be measured from one or even a few sensors. It is expected that the MAPSS sys-tem will open the way for a multitude of synergistic aerosol studies, some of which have probably not been considered till date.
Acknowledgements. Support for the development of this project has been provided by NASA HQ under Grant Number NNX08AN39A through the ROSES 2007 ACCESS Program based on a proposal entitled: “Integrated validation, intercomparison, and analysis of aerosol products from multiple satellites”. We thank the science and support teams of MODIS, MISR, OMI, POLDER, CALIOP, SeaWiFS and AERONET for retrieving and making available their respective aerosol products, as well as for providing assistance during the development of MAPSS sampling for these products. We
also thank the Principal Investigators (PIs) of AERONET sites and their staff for establishing and maintaining these sites. In addition, we would like to thank the Giovanni team for developing and hosting the MAPSS database and the Web MAPSS user interface. Lastly, our colleague, Gregory Leptoukh, suddenly passed away while this paper was in review. He was a great visionary in the area of facilitating scientific data compatibility and analysis, as well as assuring data quality and enabling multi-sensor data fusion. He made significant contributions not only in this paper but also in the field of remote sensing data analysis at large. We wish to dedicate this paper to his memory.
Edited by: V. Amiridis
References
Acker, J. and Leptoukh, G.: Online Analysis Enhances Use of NASA Earth Science Data, EOS, Trans. Am. Geophys. Union, 88, p. 14, doi:10.1029/2007EO020003, 2007.
Berrick, S., Leptoukh, G., Farley, J., and Rui, H.: Gio-vanni: A Web services workflow-based data visualization and analysis system, IEEE T. Geosci. Remote, 47, 106–113, doi:10.1109/TGRS.2008.2003183, 2009.
Boucher, O. and Tanr´e, D.: Estimation of the aerosol perturba-tion to the Earth’s radiative budget over oceans using POLDER satellite aerosol retrievals, Geophys. Res. Lett., 27, 1103–1106, doi:10.1029/1999GL010963, 2000.
Chu, D. A., Kaufman, Y. J., Ichoku, C., Remer, L. A., Tanre, D., and Holben, B. N.: Validation of MODIS aerosol opti-cal depth retrieval over land, Geophys. Res. Lett., 29, 8007, doi:10.1029/2001GL013205, 2002.
Deuz´e, J. L., Herman, M., Goloub, P., Tanr´e, D., and Marc-hand, A.: Characterization of aerosols over ocean from POLDER/ADEOS-1, Geophys. Res. Lett., 26, 1421–1424, doi:10.1029/1999GL900168, 1999.
Eck, T., Holben, B., Reid, J., Dubovik, O., Smirnov, A., O’Neill, N., Slutsker, I., and Kinne, S.: Wavelength dependence of the opti-cal depth of biomass burning, urban, and desert dust aerosols, J. Geophys. Res., 104, 31333–31349, doi:10.1029/1999JD900923, 1999.
Fox, J.: Applied Regression Analysis, Linear Models, and Related Methods, Thousand Oaks: SAGE Publications, 1997.
Herman, M., Deuz´e, J. L., Devaux, C., Goloub, P., Br´eon, F. M., and Tanr´e, D.: Remote sensing of aerosols over land sur-faces including polarization measurements and application to POLDER measurements, J. Geophys. Res., 102, 17039–17049, doi:10.1029/96JD02109, 1997.
Holben, B. N., Vermote, E., Kaufman, Y. J., Tanre, D., and Kalb, V.: Aerosol retrieval over land from AVHRR data – application for atmospheric correction, IEEE T. Geosci. Remote, 30, 212–222, doi:10.1109/36.134072, 1992.
Holben, B. N., Eck, T. F., Slutsker, I., Tanre, D., Buis, J. P., Setzer, A., Vermote, E., Reagan, J. A., Kaufman, Y. J., Nakajima, T., Lavenu, F., Jankowiak, I., and Smirnov, A.: AERONET – A fed-erated instrument network and data archive for aerosol charac-terization, Remote Sens. Environ., 66, 1–16, doi:10.1016/S0034-4257(98)00031-5, 1998.
Remote, 42, 557–569, doi:10.1109/TGRS.2004.824067, 2004. Husar, R. B., Prospero, J. M., and Stowe, L. L.:
Character-ization of tropospheric aerosols over the oceans with the NOAA advanced very high resolution rediometer optical thick-ness operational product, J. Geophys. Res., 102, 16889–16910, doi:10.1029/96JD04009, 1997.
Hyer, E. J., Reid, J. S., and Zhang, J.: An over-land aerosol opti-cal depth data set for data assimilation by filtering, correction, and aggregation of MODIS Collection 5 optical depth retrievals, Atmos. Meas. Tech., 4, 379–408, doi:10.5194/amt-4-379-2011, 2011.
Ichoku, C., Chu, D. A., S. Mattoo, Kaufman, Y. J., Re-mer, L. A., Tanre, D., Slutsker, I., and Holben, B. N.: A spatio-temporal approach for global validation and analysis of MODIS aerosol products, Geophys. Res. Lett., 29, 8006, doi:10.1029/2001GL013206, 2002.
Ichoku, C., Remer, L. A., Kaufman, Y. J., Levy, R., Chu, D. A., Tanre, D., and Holben, B. N.: MODIS observation of aerosol and estimation of aerosol Radiative forcing over south-ern Africa during SAFARI 2000, J. Geophys. Res., 108, 8499, doi:10.1029/2002JD002366, 2003.
Ichoku, C., Remer, L. A., and Eck, T. A.: Quantitative evaluation and intercomparison of morning and afternoon Moderate Res-olution Imaging Spectroradiometer (MODIS) aerosol measure-ments from Terra and Aqua, J. Geophys. Res., 110, D10S03, doi:10.1029/2004JD004987, 2005.
Ignatov, A. and Stowe, L.: Aerosol Retrievals from Indi-vidual AVHRR Channels. Part I: Retrieval Algorithm and Transition from Dave to 6S Radiative Transfer Model, J. Atmos. Sci., 59, 313–334, doi:10.1175/1520-0469(2002)059<0313:ARFIAC>2.0.CO;2, 2002.
Kahn, R. A., Garay, M. J., Nelson, D. L., Yau, K. K., Bull, M. A., Gaitley, B. J., Martonchik, J. V., and Levy, R. C.: Satellite-derived aerosol optical depth over dark water from MISR and MODIS: Comparisons with AERONET and implica-tions for climatological studies, J. Geophys. Res., 112, D18205, doi:10.1029/2006JD008175, 2007.
Levy, R. C., Leptoukh, G. G., Kahn, R., Zubko, V., Gopalan, A., and Remer, L. A.: A Critical Look at Deriving Monthly Aerosol Optical Depth From Satellite Data, IEEE T. Geosci. Remote, 47, 2942–2956, doi:10.1109/TGRS.2009.2013842, 2009.
Levy, R. C., Remer, L. A., Kleidman, R. G., Mattoo, S., Ichoku, C., Kahn, R., and Eck, T. F.: Global evaluation of the Collection 5 MODIS dark-target aerosol products over land, Atmos. Chem. Phys., 10, 10399–10420, doi:10.5194/acp-10-10399-2010, 2010. Li, Z., Zhao, X., Kahn, R., Mishchenko, M., Remer, L., Lee, K.-H., Wang, M., Laszlo, I., Nakajima, T., and Maring, H.: Uncertain-ties in satellite remote sensing of aerosols and impact on monitor-ing its long-term trend: a review and perspective, Ann. Geophys., 27, 2755–2770, doi:10.5194/angeo-27-2755-2009, 2009.
Liu, L. and Mishchenko, M. I.: Toward unified satellite climatol-ogy of aerosol properties: direct comparisons of advanced level 2 aerosol products, J. Quant. Spectrosc. Ra., 109, 2376–2385, doi:10.1016/j.jqsrt.2008.05.003, 2008.
Mishchenko, M. I., Geogdzhayev, I. V., Cairns, B., Rossow, W. B., and Lacis, A. A.: Aerosol retrievals over the ocean by use of channels 1 and 2 AVHRR data: sensitivity anal-ysis and preliminary results, Appl. Opt., 38, 7325–7341, doi:10.1364/AO.38.007325, 1999.
Remer, L. A., Tanre, D., Kaufman, Y. J., Ichoku, C., Mattoo, S., Levy, R., Chu, D. A., Holben, B. N., Dubovik, O., Smirnov, A., Martins, J. V., Li, R.-R., and Ahmad, Z.: Validation of MODIS aerosol retrieval over ocean, Geophys. Res. Lett., 29, 8008, doi:10.1029/2001GL013204, 2002.
Remer, L. A., Kaufman, Y. J., Tanre, D., Mattoo, S., Chu, D. A., Martins, J. V., Li, R. -R., Ichoku, C., Levy, R. C., Kleidman, R. G., Eck, T. F., Vermote, E., and Holben, B. N.: The MODIS aerosol algorithm, products and validation, J. Atmos. Sci., 62, 947–973, doi:10.1175/JAS3385.1, 2005.
Remer, L. A., Kleidman, R. G., Levy, R. C., Kaufman, Y. J., Tanre, D., Mattoo, S., Martins, J. V., Ichoku, C., Koren, I., Yu, H., and Holben, B. N.: Global aerosol climatology from the MODIS satellite sensors, J. Geophys. Res., 113, D14S07, doi:10.1029/2007JD009661, 2008.
Sinnott, R. W.: Virtues of the Haversine, Sky and Telescope, 68, p. 159, 1984.
Smirnov, A., Holben, B. N., Eck, T. F., Dubovik, O., and Slutsker, I.: Cloud screening and quality control algorithms for the AERONET database, Remote Sens. Environ., 73, 337–349, doi:10.1016/S0034-4257(00)00109-7, 2000.
Torres, O., Bhartia, P. K., Herman, J. R., Ahmad, Z., and Gleason, J.: Derivation of aerosol properties from satellite measurements of backscattered ultraviolet radiation: Theoretical basis, J. Geophys. Res., 103, 17099–17110, doi:10.1029/98JD00900, 1998. Torres, O., Tanskanen, A., Veihelmann, B., Ahn, C., Braak, R.,
Bhartia, P. K., Veefkind, P., and Levelt, P.: Aerosols and surface UV products from Ozone Monitoring Instrument ob-servations: An overview, J. Geophys. Res., 112, D24S47, doi:10.1029/2007jd008809, 2007.
Winker, D. M., Hunt, W. H., and McGill, M. J.: Initial perfor-mance assessment of CALIOP, Geophys. Res. Lett., 34, L19803, doi:10.1029/2007GL030135, 2007.