ACPD
15, 20709–20741, 2015Evaluation of VIIRS, GOCI, and MODIS
Collection 6 AOD retrievals
Q. Xiao et al.
Title Page
Abstract Introduction
Conclusions References
Tables Figures
◭ ◮
◭ ◮
Back Close
Full Screen / Esc
Printer-friendly Version Interactive Discussion
Discussion
P
a
per
|
Discussion
P
a
per
|
Discussion
P
a
per
|
Discussion
P
a
per
|
Atmos. Chem. Phys. Discuss., 15, 20709–20741, 2015 www.atmos-chem-phys-discuss.net/15/20709/2015/ doi:10.5194/acpd-15-20709-2015
© Author(s) 2015. CC Attribution 3.0 License.
This discussion paper is/has been under review for the journal Atmospheric Chemistry and Physics (ACP). Please refer to the corresponding final paper in ACP if available.
Evaluation of VIIRS, GOCI, and MODIS
Collection 6 AOD retrievals against
ground sunphotometer measurements
over East Asia
Q. Xiao1, H. Zhang2, M. Choi3, S. Li1,4, S. Kondragunta2, J. Kim3, B. Holben5, R. C. Levy5, and Y. Liu1
1
Emory University, Rollins School of Public Health, Atlanta, GA, USA
2
National Oceanic and Atmospheric Administration, Greenbelt, Maryland, USA
3
Yonsei University, Seoul, South Korea
4
State Key Laboratory of Remote Sensing Science, Beijing, China
5
NASA Goddard Space Flight Center, Greenbelt, Maryland, USA
Received: 23 June 2015 – Accepted: 21 July 2015 – Published: 3 August 2015
Correspondence to: Y. Liu ([email protected])
ACPD
15, 20709–20741, 2015Evaluation of VIIRS, GOCI, and MODIS
Collection 6 AOD retrievals
Q. Xiao et al.
Title Page
Abstract Introduction
Conclusions References
Tables Figures
◭ ◮
◭ ◮
Back Close
Full Screen / Esc
Printer-friendly Version Interactive Discussion
Discussion
P
a
per
|
Discussion
P
a
per
|
Discussion
P
a
per
|
Discussion
P
a
per
|
Abstract
Persistent high aerosol loadings together with extremely high population density have raised serious air quality and public health concerns in many urban centers in East Asia. However, ground based air quality monitoring is relatively limited in this area. Re-cently, satellite retrieved Aerosol Optical Depth (AOD) at high resolution has become
5
a powerful tool to characterize aerosol patterns in space and time. Using ground AOD measurements from the Aerosol Robotic Network (AERONET) and the Distributed Re-gional Aerosol Gridded Observation Networks (DRAGON)-Asia Campaign, as well as from handheld sunphotometers, we evaluated emerging aerosol products from the Visible Infrared Imaging Radiometer Suite (VIIRS) aboard the Suomi National
Polar-10
orbiting Partnership (S-NPP), the Geostationary Ocean Color Imager (GOCI) aboard the Communication, Ocean, and Meteorology Satellite (COMS), and Terra and Aqua Moderate Resolution Imaging Spectroradiometer (MODIS) (Collection 6) in East Asia in 2012 and 2013. In the case study in Beijing, when compared with AOD measured by handheld sunphotometers, 51 % of VIIRS Environmental Data Record (EDR) AOD,
15
33 % of VIIRS Intermediate Product (IP) AOD, 31 % of GOCI AOD, 26 % of Terra MODIS C6 3 km AOD, and 16 % of Aqua MODIS C6 3 km AOD fell within the refer-ence expected error (EE) envelop (±0.05±0.15 AOD). Comparing against AERONET
measurements over the Japan–South Korea region, 64 % of EDR, 37 % of IP, 62 % of GOCI, 39 % of Terra MODIS and 56 % of Aqua MODIS C6 3 km AOD fell within the
20
ACPD
15, 20709–20741, 2015Evaluation of VIIRS, GOCI, and MODIS
Collection 6 AOD retrievals
Q. Xiao et al.
Title Page
Abstract Introduction
Conclusions References
Tables Figures
◭ ◮
◭ ◮
Back Close
Full Screen / Esc
Printer-friendly Version Interactive Discussion
Discussion
P
a
per
|
Discussion
P
a
per
|
Discussion
P
a
per
|
Discussion
P
a
per
|
1 Introduction
The rapid economic growth and increasing fossil fuel usage have led to increasing air pollutant emission in East Asia. From 1980–2003, the emissions of black carbon, or-ganic carbon, SO2, and NOxincreased by 28, 30, 119, and 176 %, respectively (Ohara
et al., 2007). The continuous air quality degradation together with high population
den-5
sity have raised serious public health concerns in this region. Among commonly mon-itored air pollutants, particulate matter (PM), especially fine particulate matter (PM2.5, airborne particles with an aerodynamic diameter less than or equal to 2.5 µm), is noted for its adverse health impacts, such as increased cardiovascular and respiratory mor-bidity and mortality (Pope III et al., 2009; Cao et al., 2012). The severe PM pollution in
10
East Asia has attracted worldwide attention and ground PM monitoring networks have been developed in some East Asian countries, like China, Japan and South Korea. For instance, in South Korea, PM10together with other important air pollutants have been measured by a dense ground-based network, called “Air Korea”, by the Ministry of Environment (https://www.airkorea.or.kr/eng/real/realTime). However, ground based
15
monitoring networks have two main limitations: uneven distribution and limited cover-age. For example, the majority of air quality monitoring stations in China are located in large cities and the monitoring network only covers about 360 out of the approximately 2860 municipalities. These two limitations of ground PM measurements result in insuf-ficient information to conduct studies about PM sources, distribution, and consequent
20
health impacts in East Asia, which can negatively impact policy making.
The extensive spatial coverage and growing time series of satellite retrievals al-low researchers to better characterize aerosol patterns spatially and temporally. The most widely used satellite aerosol sensor, the Moderate Resolution Imaging Spectro-radiometer (MODIS), has 36 spectral bands, acquiring data in wavelength from 0.41 to
25
ACPD
15, 20709–20741, 2015Evaluation of VIIRS, GOCI, and MODIS
Collection 6 AOD retrievals
Q. Xiao et al.
Title Page
Abstract Introduction
Conclusions References
Tables Figures
◭ ◮
◭ ◮
Back Close
Full Screen / Esc
Printer-friendly Version Interactive Discussion
Discussion
P
a
per
|
Discussion
P
a
per
|
Discussion
P
a
per
|
Discussion
P
a
per
|
around 10:30 and 13:30 LT, respectively. Several algorithms have been developed to re-trieve aerosol optical depth (AOD) from MODIS data over land, such as the Dark-Target (Levy et al., 2013) algorithm and the Deep-Blue (Hsu et al., 2013) algorithm, providing AOD retrievals at 550 nm with global coverage. However, the widely used 10 km res-olution MODIS aerosol products cannot depict urban-scale PM2.5heterogeneity (Cao
5
et al., 2012). To resolve small-scale aerosol features, e.g. point PM2.5 sources, and
to assess the regional particle air pollution exposure, satellite aerosol products with higher resolutions and acceptable accuracy are urgently needed.
In response to the requirement of aerosol retrievals with higher spatial resolution, several emerging satellite aerosol products have become available recently. The Visible
10
Infrared Imaging Radiometer Suite (VIIRS), is a multi-disciplinary scanning radiome-ter with 22 spectral bands covering from 0.412–12.05 µm and is designed as a new generation of operational satellite sensors that are able to provide aerosol products with similar quality to MODIS (Jackson et al., 2013). VIIRS is on board the NASA-NOAA Suomi National Polar-orbiting Partnership (S-NPP) launched in October 2011,
15
and passes over the study area daily at approximately 1:30 p.m. LT. The VIIRS aerosol product reached validated maturity level in January 2013. The characteristics of the in-strument and the aerosol retrieval algorithms are documented in detail elsewhere (Liu et al., 2014) and briefly described here. VIIRS provides two AOD products: the Inter-mediate Product (IP) and the Environmental Data Record (EDR). The VIIRS aerosol
20
retrieval is performed at pixel level (∼0.75 km) spatial resolution globally as the IP that
employs information from Navy Aerosol Analysis and Prediction System (NAAPS) and Global Aerosol Climatology Project (GACP) to fill in missing observations (Vermote et al., 2014). The IP is then aggregated to 6 km spatial resolution as the EDR, a level 2 aerosol product, through quality checking and excluding information from the NAAPS
25
ACPD
15, 20709–20741, 2015Evaluation of VIIRS, GOCI, and MODIS
Collection 6 AOD retrievals
Q. Xiao et al.
Title Page
Abstract Introduction
Conclusions References
Tables Figures
◭ ◮
◭ ◮
Back Close
Full Screen / Esc
Printer-friendly Version Interactive Discussion
Discussion
P
a
per
|
Discussion
P
a
per
|
Discussion
P
a
per
|
Discussion
P
a
per
|
MODIS level 2 aerosol products over land (±0.05±0.15 AOD), with a bias of−0.01 (Liu
et al., 2014).
The Geostationary Ocean Color Imager (GOCI) is a geostationary Earth orbit sensor, providing hourly multi-spectral aerosol data eight times per day from 09:00 to 16:00 Korean LT. It covers a 2500 km×2500 km sampling area, centered at [130◦E, 36◦N]
5
in East Asia, at 500 m resolution with eight spectral channels at 412, 443, 490, 555, 660, 680, 745, and 865 nm, respectively (Lee et al., 2010). GOCI is aboard South Korea’s Communication, Ocean, and Meteorology Satellite (COMS) that were launched in June 2010. The retrieval algorithm of its aerosol product, Yonsei aerosol retrieval algorithm, was originally based on the NASA MODIS algorithm and provides level 2
10
AOD retrievals at 6 km spatial resolution (Lee et al., 2010, 2012). The GOCI aerosol product allows AOD values range between −0.1 and 5.0. A previous study reported
that during a two-month period (1 April to 31 May 2011), the GOCI AOD retrievals agreed well with the AERONET AOD measurements (R2=0.84) over East Asia (Park et al., 2014).
15
To meet the need for finer resolution aerosol products, a 3 km aerosol product was introduced as part of the MODIS Collection 6 delivery. The 3 km aerosol product in-cludes a quality flag ranging between 0 and 3 to indicate the quality of each retrieval and the valid AOD values range between−0.1 and 5.0. The retrieval algorithm of the
3 km product is documented in detail by Remer et al. (2013) and a global evaluation
20
based on six months of Aqua data against ground sunphotometer AOD measurements indicates that 63 % of the retrievals fell into the EE with a bias of 0.03 over land (Remer et al., 2013). Munchak et al. (2013) reported that in the Baltimore–Washington, D.C. area, an urban/suburban region, 68 % of the 3 km retrievals from 20 June to 31 July 2011 fell into the EE with a bias of 0.013.
25
ACPD
15, 20709–20741, 2015Evaluation of VIIRS, GOCI, and MODIS
Collection 6 AOD retrievals
Q. Xiao et al.
Title Page
Abstract Introduction
Conclusions References
Tables Figures
◭ ◮
◭ ◮
Back Close
Full Screen / Esc
Printer-friendly Version Interactive Discussion
Discussion
P
a
per
|
Discussion
P
a
per
|
Discussion
P
a
per
|
Discussion
P
a
per
|
widely used for the characterization of aerosol and validation of satellite retrievals (Eck et al., 1999; Holben et al., 1998). However, previous evaluation studies with AERONET data focused on the temporal accuracy, i.e. examined if the retrieved AOD can track the day-to-day variability of aerosol loadings. Evaluation of satellite aerosol products’ ability to track small scale aerosol spatial variability is limited because the permanent
5
AERONET stations can be tens or even hundreds of kilometers apart, leading to in-sufficient information required for a precise evaluation at high resolution. In response to the lack of ground AOD measurements at comparable spatial resolutions relative to satellite aerosol products, AERONET conducted several campaigns, which deployed additional temporary sunphotometers in selected regions and provided ground AOD
10
measurements at a higher resolution. One of these campaigns, the Distributed Re-gional Aerosol Gridded Observation Network (DRAGON)-Asia Campaign in Japan and South Korea, lasted from 15 February to 31 May 2012 and provided a rare opportu-nity to validate these emerging satellite aerosol products (Petrenko et al., 2011; Sano et al., 2012). Another issue with previous evaluation studies is that few of them focused
15
specifically on urban areas with higher pollution levels, greater disease burden and more complex aerosol patterns. Our work contributes to the validation effort of these emerging satellite products by employing ground measurements at finer resolution, ex-tending the study period to one year, and conducting a mobile sampling experiment in the urban core of Beijing.
20
In this work, we quantitatively evaluate whether the latest VIIRS, GOCI and MODIS aerosol products can provide reliable AOD measurements and accurately characterize the spatial pattern of AOD over the urban areas in East Asia. Ground AOD measure-ments from AERONET, DRAGON-Asia, and handheld sunphotometers were collected over a period of one and a half years. The rest of the paper is organized such that
25
ACPD
15, 20709–20741, 2015Evaluation of VIIRS, GOCI, and MODIS
Collection 6 AOD retrievals
Q. Xiao et al.
Title Page
Abstract Introduction
Conclusions References
Tables Figures
◭ ◮
◭ ◮
Back Close
Full Screen / Esc
Printer-friendly Version Interactive Discussion
Discussion
P
a
per
|
Discussion
P
a
per
|
Discussion
P
a
per
|
Discussion
P
a
per
|
2 Data and methods
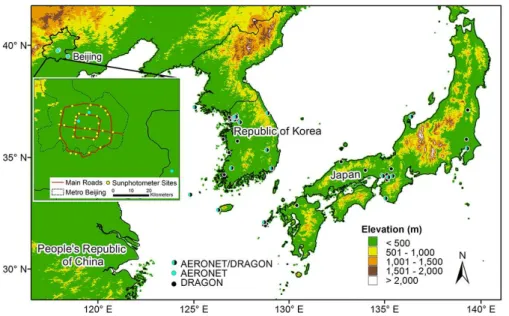
2.1 Study area
The study area is approximately 2500 km×1100 km, centered at [128.5◦E, 35.5◦N]
in East Asia, covering eastern China, South Korea and Japan (Fig. 1). This domain is within the overlapping region of all satellite datasets and ground measurements,
5
and covers large urban centers, suburban areas, and rural areas. We also conducted a mobile sampling study in Metro Beijing along three major roads (Fig. 1). The study period is from January 2012 to June 2013.
2.2 Remote sensing data
The satellite aerosol products used in this study are from VIIRS, GOCI, Aqua MODIS
10
and Terra MODIS sensors (Table 1). VIIRS data before May 2012 are not avail-able because the sensor was in an early checkout phase and lacked a validated cloud mask (Liu et al., 2014). Thus, only EDR and IP pixels from May 2012 to June 2013 with high quality were processed. Similarly, GOCI aerosol retrievals from Jan-uary 2012 to June 2013 were filtered by its assigned quality and only high quality
15
(Quality Flag=3) retrievals were included. The Aqua and Terra MODIS C6 3 km data from January 2012 to June 2013 were obtained from the Goddard Space Flight Cen-ter (http://ladsweb.nascom.nasa.gov/data). Only retrievals with high quality (Quality Flag=3) were included in the analysis. The quality control criteria of these five satellite aerosol products are shown in Table 1.
20
2.3 Ground measurements
The characteristics of ground AOD measurement datasets are shown in Table 2. There were 18 permanent AERONET stations in the study area during the study period, supplemented by 24 temporary stations during the DRAGON-Asia Campaign. The DRAGON stations distributed nearly uniformly in two urban centers, Osaka in Japan
ACPD
15, 20709–20741, 2015Evaluation of VIIRS, GOCI, and MODIS
Collection 6 AOD retrievals
Q. Xiao et al.
Title Page
Abstract Introduction
Conclusions References
Tables Figures
◭ ◮
◭ ◮
Back Close
Full Screen / Esc
Printer-friendly Version Interactive Discussion
Discussion
P
a
per
|
Discussion
P
a
per
|
Discussion
P
a
per
|
Discussion
P
a
per
|
(7 stations) and Seoul in South Korea (11 stations), approximately 10 km apart. Other DRAGON stations were located across Japan and South Korea which can be tens to hundreds of kilometers apart. AERONET stations measure AOD at eight spectral bands between 340 and 1020 nm. To compare with satellite retrievals, AOD at 550 nm was calculated using a quadratic log-log fit from AERONET measurements at
wave-5
lengths 440 and 675 nm. Near-real time level 2.0 AERONET/DRAGON data in Japan– South Korea region and level 1.5 AERONET data in Beijing were downloaded from the Goddard Space Flight Center (http://aeronet.gsfc.nasa.gov/). The Level 1.5 AOD data are cloud-screened but not quality-assured (Smirnov et al., 2000); however, our prelim-inary results indicate that the level 1.5 daily average AOD values agreed well with the
10
level 2.0 data, with a slope of 1.0 and zero intercept. Thus, we used the level 1.5 data in the case study in Beijing because level 2.0 data are not available for some AERONET stations.
To analyze the intra-city aerosol variability, we conducted ground measurements of AOD by a handheld sunphotometer (model 540 Microtops II, Solar Light Company, Inc.)
15
at the Metro Beijing area in 2012 and 2013. Ground measurements were conducted on every cloud-free day at pre-selected sites that distributed roughly 6 km apart along the 3rd and the 5th Ring Roads and the Chang’an Avenue of Beijing. This sampling took place between 09:30 and 14:00 LT, and 5–10 repeated measurements were made at each site. To control the quality of the ground data, we used the median value of
20
the repeated measurements as ground truth to eliminate the impact of extreme val-ues and only included measurements with the ratio of standard deviation over median AOD less than 2.0. Our comparison of Microtops AOD measurements with nearby AERONET data yielded a slope of∼0.95 and a correlation coefficient of∼0.8
(Sup-plement, Text S1).
25
2.4 Data integration and analytical methods
ACPD
15, 20709–20741, 2015Evaluation of VIIRS, GOCI, and MODIS
Collection 6 AOD retrievals
Q. Xiao et al.
Title Page
Abstract Introduction
Conclusions References
Tables Figures
◭ ◮
◭ ◮
Back Close
Full Screen / Esc
Printer-friendly Version Interactive Discussion
Discussion
P
a
per
|
Discussion
P
a
per
|
Discussion
P
a
per
|
Discussion
P
a
per
|
constructed, corresponding to the spatial resolution of each satellite product. Satellite aerosol data from different sensors were remapped to this 6 km grid (for VIIRS EDR and GOCI products) or 3 km grid (for VIIRS IP and MODIS C6 3 km products) with respect to their spatial resolution.
Two types of comparisons were conducted: the temporal comparison, which
com-5
pared satellite AOD retrievals against ground measurements from AERONET stations during one year from July 2012 to June 2013; and the spatial comparison, which com-pared satellite AOD retrievals against high spatial resolution ground measurements from DRAGON stations or the handheld sunphotometer. The temporal comparisons and spatial comparisons differ in study periods (Table 2): the temporal comparison
pe-10
riod was the longest overlap period covered by all five satellite products and the spatial comparison period allows the maximum sample size.
For the temporal comparison of VIIRS EDR data, we averaged valid AOD retrievals in each 3×3 grid cells sampling buffer (18 km×18 km) centered at each ground AERONET
station. The average AOD values were then compared with the mean AERONET AOD
15
within a 1 h time window (±30 min around the satellite overpass time). We employed
this smaller spatial averaging window than the widely used 27.5 km-radius-circle buffer suggested by the Multi-sensor Aerosol Products Sampling System (MAPSS) (Petrenko et al., 2011) in order to examine the performance of these finer resolution products at the scale of their expected application conditions. We used the typical 1 h time window
20
because previous analysis indicates that changing the time window matters little to validation results (Remer et al., 2013) and the 1 h time window yields a larger database for the validation. For the spatial comparison of VIIRS EDR data, we used single 6 km pixels covering each ground measurement location, i.e. DRAGON station or handheld sunphotometer measurement location, and compared the AOD retrieval values with
25
ACPD
15, 20709–20741, 2015Evaluation of VIIRS, GOCI, and MODIS
Collection 6 AOD retrievals
Q. Xiao et al.
Title Page
Abstract Introduction
Conclusions References
Tables Figures
◭ ◮
◭ ◮
Back Close
Full Screen / Esc
Printer-friendly Version Interactive Discussion
Discussion
P
a
per
|
Discussion
P
a
per
|
Discussion
P
a
per
|
Discussion
P
a
per
|
used the 13:00 LT retrievals in the comparison in order to make the validation results comparable among these satellite products.
For the temporal comparison of VIIRS IP data, we developed averaged valid AOD retrievals falling in the 3 km grid cell centered at each ground AERONET station. Since the IP pixel is at approximately 750 m spatial resolution, this sampling buffer averaged
5
to a 4×4 pixel group. The average AOD values were compared against average AOD from the corresponding AERONET station within the 1 h time window. In the spatial comparison of VIIRS IP, we also used the 3 km sampling buffer due to the lack of ground measurements at finer resolutions. Thus, the VIIRS IP data is oversampled in the spatial comparison. For the temporal comparison of Aqua and Terra MODIS C6
10
3 km data, we employed the 3 km grid and averaged valid AOD retrievals in each 3×3
grid cells centered at each ground AERONET station to compare with the mean AOD within the 1 h time window. For the spatial comparison of MODIS C6 3 km data, we used the individual 3 km pixel AOD value falling on each ground measurement location to compare with average AOD from the corresponding DRAGON station within the 1 h
15
time window or the median AOD from the handheld sunphotometer at the correspond-ing location.
In summary, for VIIRS EDR and GOCI products, the temporal and spatial compar-ison buffer was 18 km×18 km and 6 km×6 km, respectively. For the VIIRS IP
prod-uct, the temporal and spatial comparison employed the same 3 km×3 km buffer. For
20
MODIS C6 3 km product, the temporal and spatial comparison buffer was 9 km×9 km
and 3 km×3 km, respectively. The examples of buffers used in the temporal and spatial
comparisons for each satellite products are shown in Supplement (Fig. S1). It is no-table that both MODIS and VIIRS pixels were stretched toward the edge of the scan. For example, the 3 km×3 km MODIS pixels become approximately 6 km×12 km toward
25
ACPD
15, 20709–20741, 2015Evaluation of VIIRS, GOCI, and MODIS
Collection 6 AOD retrievals
Q. Xiao et al.
Title Page
Abstract Introduction
Conclusions References
Tables Figures
◭ ◮
◭ ◮
Back Close
Full Screen / Esc
Printer-friendly Version Interactive Discussion
Discussion
P
a
per
|
Discussion
P
a
per
|
Discussion
P
a
per
|
Discussion
P
a
per
|
In epidemiological studies, in order to improve the coverage of satellite aerosol data to provide exposure estimates, spatial aggregation is widely used. In our analysis, we constructed quality flags for each matchup of satellite and ground AOD measure-ments to obtain better coverage without losing accuracy. For the temporal validation, matchups with at least 20 % coverage of both satellite data and ground measurements
5
(Levy et al., 2013), e.g., having two or more satellite pixels within the sampling buffer and at least two AERONET/DRAGON measurements within the 1 h time window, were marked as “High Quality”; matchups with less than 20 % satellite pixels falling in the sampling buffer but one or more pixels located within the grid cell centered on the ground stations were marked as “Medium Quality”; while other matchups were marked
10
as “Low Quality”. In the spatial validation, because the best scenario matchup is sup-posed to have one or more satellite pixels within the one-grid cell sampling buffer and two or more AERONET/DRAGON measurements during the one hour time window, we only assigned two quality levels: “High Quality” for matches in the best scenario, and “Low Quality” for all others. Only matchups with high and medium quality were included
15
in our validations and we also conducted a comparison, shown as Table S2, including all the matchups regardless of their quality to examine the influence of sampling bias. In addition, we conduct sensitivity analyses on VIIRS IP AOD retrievals including both high and degraded quality retrievals (Supplement, Table S1) and for the GOCI product at hourly scale (Supplement, Table S4) with respect to its eight hourly observations
20
per day. In the hourly comparison, we constructed hourly average AERONET AOD as the ground measured true value and employed the same 3×3 grid cells temporal
comparison sampling buffer.
2.5 Evaluation metrics
Several statistical metrics were used to describe the performance of satellite aerosol
25
cor-ACPD
15, 20709–20741, 2015Evaluation of VIIRS, GOCI, and MODIS
Collection 6 AOD retrievals
Q. Xiao et al.
Title Page
Abstract Introduction
Conclusions References
Tables Figures
◭ ◮
◭ ◮
Back Close
Full Screen / Esc
Printer-friendly Version Interactive Discussion
Discussion
P
a
per
|
Discussion
P
a
per
|
Discussion
P
a
per
|
Discussion
P
a
per
|
relation between satellite retrievals and ground AOD measurements; bias describes the average difference between satellite retrievals and ground AOD measurements; slope is the slope of the linear regression with satellite retrievals as the dependent variable and ground AOD measurements as the independent variable; and percent of retrievals falling within the expected error (EE) range. For the consistency of this metrics among
5
different aerosol products, we employed the same EE,±(0.05+0.15AOD), that is
es-tablished by MODIS C5 aerosol products over land in this study.
3 Results and discussion
3.1 Spatial variations of aerosol loadings
A previous study (Remer et al., 2005) indicated that the aerosol loading is
homoge-10
neous at horizontal scales within 200 km. However, that study is conducted over the ocean, which provides a homogeneous surface, leading to reduced aerosol spatial variability. The variability of aerosol loading at local scales in urban areas with complex land surface and meteorological conditions are expected to be greater. We assessed the intra city spatial variations of aerosol loadings over Beijing, Osaka, and Seoul with
15
handheld sunphotometer and DRAGON-Asia AOD measurements in 2012. First, we calculated the great circle distance between each of two handheld sunphotometer mea-surement sites or DRAGON sites which are less than 20 km apart. Then we stratified the site to site distance by increments of 750 m and calculate the station to station cor-relation coefficient of daily average AOD within each distance stratum. The
measure-20
ments from DRAGON sites in Osaka and Seoul and the measurements from handheld sunphotometers in Beijing were processed separately due to differences in instrumen-tation. Only handheld sunphotometer measurements in Beijing from 15 February to 31 May 2012 were included to ensure that the measurement period at these three locations is the same.
ACPD
15, 20709–20741, 2015Evaluation of VIIRS, GOCI, and MODIS
Collection 6 AOD retrievals
Q. Xiao et al.
Title Page
Abstract Introduction
Conclusions References
Tables Figures
◭ ◮
◭ ◮
Back Close
Full Screen / Esc
Printer-friendly Version Interactive Discussion
Discussion
P
a
per
|
Discussion
P
a
per
|
Discussion
P
a
per
|
Discussion
P
a
per
|
Figure 2a shows the correlation coefficient of daily AOD by binned distance and Fig. 2b shows the site specific average AOD with the regional average AOD subtracted in these three cities. Figure 2a indicates that the DRAGON AOD measurements were highly correlated within a 20 km spatial range with a correlation coefficient larger than 0.9. However, the result from handheld sunphotometer measurements in Beijing
sug-5
gests that the spatial correlation coefficients declined slowly as the distance among two measurement locations increased up to 12 km. The correlation coefficient increased slightly when the distance among two measurement locations are beyond 12 km. This can be explained by the clustered distribution of ground measurement locations in Bei-jing: these long location-to-location distances only occur when the two locations are
10
located along the Chang’an Avenue and vehicle exhaust is one of the major sources of aerosol in Beijing, thus these AOD measurements are highly correlated. The dif-ferent aerosol spatial variability trends in Beijing and in the DRAGON domain can be attributed to the following reason: the DRAGON-Asia campaign provides real time ob-servation but our ground measurement in Beijing provides one obob-servation at each site
15
per day, so that the average daily AOD from DRAGON may have smoothed away some of the spatial heterogeneity.
Even though the aerosol loadings are highly related spatially, the AOD value may differ among nearby stations (Fig. 2b). In Beijing, the difference in average AOD be-tween two neighboring sites that are∼6 km apart can be as high as 0.4, about 49 %
20
of the regional mean AOD value. The measurements from DRAGON stations show smaller difference in average AOD relative to that in Beijing, but the difference between two neighboring sites can still be greater than 0.1 in Seoul, 23 % of the regional mean AOD value. These results indicate that spatial contrast in aerosol loading exists at local scale and finer resolution satellite aerosol products are needed to better characterize
25
ACPD
15, 20709–20741, 2015Evaluation of VIIRS, GOCI, and MODIS
Collection 6 AOD retrievals
Q. Xiao et al.
Title Page
Abstract Introduction
Conclusions References
Tables Figures
◭ ◮
◭ ◮
Back Close
Full Screen / Esc
Printer-friendly Version Interactive Discussion
Discussion
P
a
per
|
Discussion
P
a
per
|
Discussion
P
a
per
|
Discussion
P
a
per
|
3.2 The Beijing sampling experiment
The GOCI aerosol product provided the highest coverage in the temporal compari-son over Beijing with 73 % available retrievals relative to AERONET measurements at 13:00, followed by the VIIRS IP (42 %), VIIRS EDR (41 %), MODIS Terra C6 3 km prod-uct (40 %), and MODIS Aqua C6 3 km prodprod-uct (38 %) (Supplement, Table S1). Table 3
5
shows the statistical metrics from the temporal and spatial comparisons over Beijing. In the temporal comparison, the GOCI product provided the most accurate AOD re-trievals, which slightly overestimated AOD by 0.02 on average. Other aerosol products significantly overestimated AOD and the average bias in the temporal comparison for VIIRS EDR, VIIRS IP, Aqua and Terra MODIS C6 3 km products were 0.11, 0.25, 0.21,
10
and 0.29, respectively. Though GOCI AOD retrievals agreed well with ground mea-surements in the temporal comparison, with 55 % of GOCI AOD retrievals at 13:00 falling within the EE, only 31 % of GOCI AOD retrievals fell within the EE in the spatial comparison. The comparison including all eight hourly GOCI observations represented reduced average hourly coverage (59 %), a smaller average bias (−0.006), and a larger
15
proportion of retrievals fell within EE (59 %). Thus, the GOCI product resolved the tem-poral and spatial variability of aerosol loadings at its designed temtem-poral and spatial resolutions, but it tracked the small-scale spatial variability less well than the temporal variability in Beijing.
VIIRS EDR product performed well in Beijing in both the temporal and spatial
com-20
parisons, with 52 and 51 % of retrievals fell within EE in the temporal and spatial com-parison, respectively. Although VIIRS IP had a relatively large positive bias (0.25) in the temporal comparison, it provided acceptable coverage with 33 % retrievals falling within the EE in the spatial comparison, resolving valuable information of small-scale aerosol variability in urban areas. MODIS C6 3 km product had the largest high bias
25
ACPD
15, 20709–20741, 2015Evaluation of VIIRS, GOCI, and MODIS
Collection 6 AOD retrievals
Q. Xiao et al.
Title Page
Abstract Introduction
Conclusions References
Tables Figures
◭ ◮
◭ ◮
Back Close
Full Screen / Esc
Printer-friendly Version Interactive Discussion
Discussion
P
a
per
|
Discussion
P
a
per
|
Discussion
P
a
per
|
Discussion
P
a
per
|
2013). It is notable that the R2 values of the MODIS C6 3 km products is the highest
in the spatial comparisons (0.68 for Aqua and 0.85 for Terra) and the linear regres-sion statistics indicates that the low percent of retrievals falling within EE is mainly due to a relatively constant positive offset: the intercepts for Aqua and Terra are 0.22 and 0.30, respectively. One possible explanation of the positive bias of MODIS and VIIRS
5
products is that our study domain is highly urbanized with bright surfaces, therefore is challenging for the Dark Target algorithm.
3.3 The temporal evaluation of AOD over Japan–South Korea region
We first looked at the AOD retrievals distribution on one clear day, 7 May 2012, during the DROGAN period (Fig. 3). Figure 3 indicates that the sampling strategies and cloud
10
masks differ in these five satellite aerosol products, resulting in different patterns of missing data. GOCI provided the best coverage with almost no missing data over this region. VIIRS products and MODIS products showed similar missing in the center of the map; while VIIRS products showed more missing in the lower right corner but MODIS products showed more missing in the upper right corner. VIIRS and MODIS
15
pixels are stretched toward the edge of the scan. VIIRS and MODIS products tended to overestimate AOD values in the urban area (Seoul), but GOCI provided accurate AOD estimates in this region. Though these 3 km products showed similar spatial distribution patterns to the 6 km products, the 3 km products demonstrated greater heterogeneity, which is valuable to analyze local aerosol sources and estimate personal air pollution
20
exposure.
Similar to the comparisons in Beijing, the GOCI aerosol products provided the high-est coverage in the temporal comparison over Japan–South Korea region, with 74 % re-trievals relative to AERONET measurements, followed by VIIRS EDR (63 %), VIIRS IP (50 %), Terra MODIS C6 3 km (26 %), and Aqua MODIS C6 3 km (24 %) (Supplement,
25
ACPD
15, 20709–20741, 2015Evaluation of VIIRS, GOCI, and MODIS
Collection 6 AOD retrievals
Q. Xiao et al.
Title Page
Abstract Introduction
Conclusions References
Tables Figures
◭ ◮
◭ ◮
Back Close
Full Screen / Esc
Printer-friendly Version Interactive Discussion
Discussion
P
a
per
|
Discussion
P
a
per
|
Discussion
P
a
per
|
Discussion
P
a
per
|
C6 product is not shown here because it passes the study region in the morning, lead-ing to potential differences in AOD distribution relatives to other sensors that pass the study region in the afternoon. This histogram is plotted with relative frequency rather than the total number of retrievals because these aerosol products differ in sampling strategies, leading to different total number of matchups. VIIRS EDR, VIIRS IP, and
5
GOCI products showed a similar mode of distribution to AERONET measurements, with the peak probability around 0.2. The distribution of Aqua MODIS C6 3 km AOD had the peak around 0.3, indicating that the Aqua MODIS C6 3 km product tended to overestimate AOD in general. A previous study also reported that the MODIS C6 3 km product had a decreased proportion of low AOD values and an increased proportion of
10
high AOD values (Remer et al., 2013) relative to the 10 km product over land, leading to a higher global average AOD. The VIIRS IP product also tended to overestimate AOD, with higher percentage of retrievals occurring at high AOD values. The distribution of GOCI data provided the best fit with AERONET data, with a correlation coefficient of 0.95, followed by VIIRS EDR (r =0.93), VIIRS IP (r =0.77), and MODIS Aqua C6 3 km 15
product (r=0.76). The difference in the distributions of these satellite aerosol products
can be partly explained by different retrieval assumptions including aerosol models, different surface reflectance and different global sampling strategies. Moreover, these satellite aerosol products differ in the valid AOD retrieval ranges, leading to differences in the distribution of extremely high and low AOD values.
20
The temporal comparisons over Japan–South Korea region showed more retrievals falling within the EE and smaller biases relative to comparisons in Beijing. Figure 5 is the frequency scatter plots showing the results of temporal comparisons over Japan– South Korea region and the corresponding box plots showing the difference between satellite AOD retrievals and ground observations. GOCI retrievals were highly
corre-25
aver-ACPD
15, 20709–20741, 2015Evaluation of VIIRS, GOCI, and MODIS
Collection 6 AOD retrievals
Q. Xiao et al.
Title Page
Abstract Introduction
Conclusions References
Tables Figures
◭ ◮
◭ ◮
Back Close
Full Screen / Esc
Printer-friendly Version Interactive Discussion
Discussion
P
a
per
|
Discussion
P
a
per
|
Discussion
P
a
per
|
Discussion
P
a
per
|
age bias (0.01), and 66 % of retrievals fell in the EE (Table 4, GOCI all obs.). The box plot indicates that GOCI retrievals overestimated AOD at high AOD values (AOD>0.6)
(Fig. 5). Thus, the GOCI product tracked the daily variability of aerosol loadings well and it provided additional information to study short-term aerosol trends. Similarly, 64 % of VIIRS EDR retrievals fell into the EE with a slightly higher bias (0.05) and a slightly
5
lowerR2 of 0.74 (Table 4). This positive bias is consistent with a previous global
val-idation study, which reports a 0.01 bias of VIIRS EDR in East Asia (Liu et al., 2014). Though the VIIRS EDR product tended to overestimate AOD at low (AOD<0.3) and
high AOD values (AOD>1.0), it agreed well with the AERONET measurements when
AOD ranged between 0.3 and 1.0 (Fig. 5).
10
The VIIRS IP had linear regression slope close to 1 (1.03) against AERONET ob-servations, but it had a consistent positive bias of 0.15 on average. Only 37 % of VIIRS IP retrievals fell within the EE. The scatter plot indicates that the IP retrievals varied substantially, especially when the AOD values were low. MODIS C6 3 km products had a high positive bias of 0.08 for Aqua and 0.16 for Terra. Consistent with what was
re-15
ported by a previous global evaluation study, we observed that the MODIS C6 3 km products tended to overestimate AOD and the bias increased with AOD values (Remer et al., 2013). 56 % of the Aqua MODIS C6 3 km retrievals and 39 % of the Terra MODIS C6 3 km retrievals fell within the EE. In general, these finer resolution aerosol products included larger bias relative to the 6 km resolution products and researchers must be
20
cautious when applying them.
Since the GOCI product provides eight hourly observations per day, to examine the temporal variability in the accuracy of GOCI aerosol retrievals, we compared the GOCI AOD retrievals with AERONET measurements stratified by hour (Supplement, Table S4). In general, the GOCI product provided high quality retrievals consistently
25
ACPD
15, 20709–20741, 2015Evaluation of VIIRS, GOCI, and MODIS
Collection 6 AOD retrievals
Q. Xiao et al.
Title Page
Abstract Introduction
Conclusions References
Tables Figures
◭ ◮
◭ ◮
Back Close
Full Screen / Esc
Printer-friendly Version Interactive Discussion
Discussion
P
a
per
|
Discussion
P
a
per
|
Discussion
P
a
per
|
Discussion
P
a
per
|
the quality of GOCI retrievals may be due to changes in scattering angle, clouds and the associated Bidirectional Reflectance Distribution Function (BRDF) effects.
3.4 The spatial evaluation of AOD over Japan–South Korea region
The mean daily AOD from different sensors and AERONET stations during the one year period from July 2012 to June 2013 are shown in Fig. 6. These five aerosol
prod-5
ucts provided similar distribution of average AOD during the one year period, with the highest values occurred in northeastern China and the Yangtze River delta, and the lowest values occurred in southern China and Japan. Several high-AOD value spots appeared along the west coast of South Korea and surrounded the Seto Inland Sea, likely due to emissions from urban centers in these regions. These five maps differ in
10
missing patterns due to their different masking approaches. The VIIRS algorithms did not retrieve AOD over inland lakes (e.g. the Taihu Lake); the GOCI product retrieved AOD over inland water; while MODIS products provided some AOD retrievals over in-land lakes, with some missing data. The GOCI product did not provide high quality retrievals at some locations in central Japan due to snow coverage in this mountain
15
region. To maintain a consistent evaluation data filtering strategy, the inland water AOD retrievals and ground observations were removed from the validation. The VIIRS EDR product showed lower AOD values in northeastern China and South Korea relative to AOD retrievals from other sensors. The VIIRS IP product also showed lower AOD val-ues in northeastern China, but provided higher AOD retrievals in northern Japan. This
20
can be explained by the system bias reported in a previous study that VIIRS retrievals tend to underestimate AOD when NDVI value is low and overestimate AOD over veg-etated surface (Liu et al., 2014). The VIIRS IP product had higher AOD values relative to the EDR product, especially over the Korean Peninsula and northern Japan. This may be due to IP’s ability to track small scale variability which were smoothed in the
25
ACPD
15, 20709–20741, 2015Evaluation of VIIRS, GOCI, and MODIS
Collection 6 AOD retrievals
Q. Xiao et al.
Title Page
Abstract Introduction
Conclusions References
Tables Figures
◭ ◮
◭ ◮
Back Close
Full Screen / Esc
Printer-friendly Version Interactive Discussion
Discussion
P
a
per
|
Discussion
P
a
per
|
Discussion
P
a
per
|
Discussion
P
a
per
|
high, like in northeastern China, though lacking AERONET measurements in this re-gion to test this hypothesis. Aqua and Terra MODIS C6 3 km aerosol products showed similar spatial distribution in AOD retrievals, with higher AOD values in urban areas, e.g. over the Yangtze River Delta and North China Plain in China. GOCI presented some high AOD values in local regions such as western South Korea, around the Seto
5
Inland Sea, and over northeastern China. However, it showed lower AOD values over the Yangtze River Delta in China. This result is consistent with the temporal comparison results shown in Fig. 5 that the GOCI product slightly overestimated AOD at high AOD values (AOD>0.6). Compared with the ground measurements, all these five aerosol
products overestimated AOD in Japan, where the average AOD values were relatively
10
low. VIIRS EDR tended to slightly underestimate AOD over the Seoul region. The lack of ground measurements, especially in northeast China, makes it impossible to quan-titively evaluate the spatial distribution of these aerosol products in China.
Results of the spatial comparison over DRAGON-Asia region are shown in Table 4. Satellite aerosol products performed better in tracking the day-to-day variability relative
15
to tracking their spatial patterns. In the spatial comparison, all the satellite aerosol products showed lower R2 and larger offset with less retrievals falling into the EE. GOCI product provided the highest accuracy, with a small positive bias of 0.03 and 48 % of retrievals falling in the EE, followed by VIIRS EDR, with a positive offset of 0.16 and 41 % of retrievals falling in the EE. In contrast, VIIRS IP and MODIS C6 3 km
20
had large positive offsets and less than 30 % of retrievals falling within the EE due to larger noise related with the finer resolution. The MODIS C6 3 km and VIIRS IP aerosol products introduced sporadic unrealistic high AOD retrievals over urban areas that are avoided more successfully by VIIRS EDR and GOCI products. Though these finer resolution aerosol products did not fully track the spatial trends of aerosol loading
25
at their designed resolution, they provide additional information about aerosol spatial distribution and will benefit exposure assessments at local scales.
ACPD
15, 20709–20741, 2015Evaluation of VIIRS, GOCI, and MODIS
Collection 6 AOD retrievals
Q. Xiao et al.
Title Page
Abstract Introduction
Conclusions References
Tables Figures
◭ ◮
◭ ◮
Back Close
Full Screen / Esc
Printer-friendly Version Interactive Discussion
Discussion
P
a
per
|
Discussion
P
a
per
|
Discussion
P
a
per
|
Discussion
P
a
per
|
region (Supplement, Table S2). There is no significant change in the evaluation met-rics after including matchups with low quality. Thus, the validation results are robust and there is no evidence for sampling bias. We validated the VIIRS IP AOD retrievals with degraded quality over Japan–South Korea region and observed lower correlation coefficient, higher bias, and less retrievals falling within the EE in both the temporal
5
and spatial comparisons (Supplement, Table S3). This result suggests to use only high quality VIIRS IP retrievals. We also validated the GOCI AOD retrievals with different quality over Japan–South Korea region. Including medium and low quality GOCI re-trievals decreases the accuracy, but significantly increased the coverage (Supplement, Table S5). By including the retrievals with quality flag equals to both 3 and 2, the
cover-10
age increased from 27 to 38 % in the temporal comparison over the Japan–South Korea region, while the average bias increased by 0.01 and the percentage of retrievals falling within the EE decreased by 7 %. Thus, including retrievals with medium quality might be acceptable, depending on study objectives. Due to the relative small number of matched observations, analysis of the correlation between quality of satellite aerosol
15
retrievals and satellite viewing angles were beyond the scope of this analysis. How-ever, previous studies reported that towards the edge of the scan, VIIRS EDR tends to underestimate AOD over land (Liu et al., 2014).
4 Conclusions
In this work, the intra city variability of aerosol loadings were examined with ground
20
measurements from the DRAGON-Asia campaign and our mobile sampling campaign in Beijing. Five emerging high resolution satellite aerosol products are evaluated by comparing them with ground measurements from AERONET, DRAGON, and hand-held sunphotometers over East Asia in 2012 and 2013. We observed variability in both correlation coefficient and average AOD values among ground AOD
measure-25
ACPD
15, 20709–20741, 2015Evaluation of VIIRS, GOCI, and MODIS
Collection 6 AOD retrievals
Q. Xiao et al.
Title Page
Abstract Introduction
Conclusions References
Tables Figures
◭ ◮
◭ ◮
Back Close
Full Screen / Esc
Printer-friendly Version Interactive Discussion
Discussion
P
a
per
|
Discussion
P
a
per
|
Discussion
P
a
per
|
Discussion
P
a
per
|
higher coverage relative to the higher resolution products, VIIRS IP, Terra and Aqua MODIS C6 3 km products, in both temporal comparisons and spatial comparisons; satellite aerosol products resolved the day-to-day aerosol loading variability better than the spatial aerosol loading variability; satellite products performed less well in Beijing relative to in the Japan–South Korea region, indicating that retrieval in urban areas
5
is challenging. The performance of these aerosol products in Beijing and at regional scale over Japan–South Korea region demonstrates that satellite aerosol products can track the small scale variability of aerosol loadings and high resolution satellite aerosol products provide valuable information for analyzing small scale air pollution, detecting point sources and estimating individual air pollution exposure. Future studies with
ad-10
ditional ground measurements at small spatial and temporal scale will help us analyze air pollution patterns and further validate satellite products.
The Supplement related to this article is available online at doi:10.5194/acpd-15-20709-2015-supplement.
Acknowledgement. The work of Y. Liu and Q. Xiao was partially supported by the NASA Ap-15
plied Sciences Program (grants NNX11AI53G and NNX14AG01G, PI: Y. Liu). We would like to acknowledge the AERONET team, I. Sano and the DRAGON-Japan team, the Yonsi team and their collaborators in S. Korea, and CARSNET and CAS teams in and around Beijing for providing data support in this study. The AERONET project is supported NASA EOS project office, and by Hal B. Maring, Radiation Sciences Program, NASA Headquarters.
ACPD
15, 20709–20741, 2015Evaluation of VIIRS, GOCI, and MODIS
Collection 6 AOD retrievals
Q. Xiao et al.
Title Page
Abstract Introduction
Conclusions References
Tables Figures
◭ ◮
◭ ◮
Back Close
Full Screen / Esc
Printer-friendly Version Interactive Discussion
Discussion
P
a
per
|
Discussion
P
a
per
|
Discussion
P
a
per
|
Discussion
P
a
per
|
References
Cao, J., Xu, H., Xu, Q., Chen, B., and Kan, H.: Fine particulate matter constituents and car-diopulmonary mortality in a heavily polluted Chinese city, Environ. Health Persp., 120, 373– 378, 2012.
Eck, T. F., Holben, B. N., Reid, J. S., Dubovik, O., Smirnov, A., O’Neill, N. T., 5
Slutsker, I., and Kinne, S.: Wavelength dependence of the optical depth of biomass burning, urban, and desert dust aerosols, J. Geophys. Res.-Atmos., 104, 31333–31349, doi:10.1029/1999jd900923, 1999.
Green, M., Kondragunta, S., Ciren, P., and Xu, C.: Comparison of GOES and MODIS aerosol optical depth (AOD) to aerosol robotic network (AERONET) AOD and IMPROVE PM2.5mass 10
at Bondville, Illinois, JAPCA J. Air Waste Ma., 59, 1082–1091, 2009.
Holben, B., Eck, T., Slutsker, I., Tanre, D., Buis, J., Setzer, A., Vermote, E., Reagan, J., Kauf-man, Y., and Nakajima, T.: AERONET – a federated instrument network and data archive for aerosol characterization, Remote Sens. Environ., 66, 1–16, 1998.
Hsu, N. C., Jeong, M. J., Bettenhausen, C., Sayer, A. M., Hansell, R., Seftor, C. S., Huang, J., 15
and Tsay, S. C.: Enhanced Deep Blue aerosol retrieval algorithm: the second generation, J. Geophys. Res.-Atmos., 118, 9296–9315, doi:10.1002/jgrd.50712, 2013.
Jackson, J. M., Liu, H., Laszlo, I., Kondragunta, S., Remer, L. A., Huang, J., and Huang, H. C.: Suomi-NPP VIIRS aerosol algorithms and data products, J. Geophys. Res.-Atmos., 118, 12673–12689, 2013.
20
Lee, J., Kim, J., Song, C. H., Ryu, J.-H., Ahn, Y.-H., and Song, C.: Algorithm for retrieval of aerosol optical properties over the ocean from the Geostationary Ocean Color Imager, Re-mote Sens. Environ., 114, 1077–1088, 2010.
Lee, J., Kim, J., Yang, P., and Hsu, N. C.: Improvement of aerosol optical depth retrieval from MODIS spectral reflectance over the global ocean using new aerosol models archived from 25
AERONET inversion data and tri-axial ellipsoidal dust database, Atmos. Chem. Phys., 12, 7087–7102, doi:10.5194/acp-12-7087-2012, 2012.
Levy, R. C., Mattoo, S., Munchak, L. A., Remer, L. A., Sayer, A. M., Patadia, F., and Hsu, N. C.: The Collection 6 MODIS aerosol products over land and ocean, Atmos. Meas. Tech., 6, 2989–3034, doi:10.5194/amt-6-2989-2013, 2013.
ACPD
15, 20709–20741, 2015Evaluation of VIIRS, GOCI, and MODIS
Collection 6 AOD retrievals
Q. Xiao et al.
Title Page
Abstract Introduction
Conclusions References
Tables Figures
◭ ◮
◭ ◮
Back Close
Full Screen / Esc
Printer-friendly Version Interactive Discussion
Discussion
P
a
per
|
Discussion
P
a
per
|
Discussion
P
a
per
|
Discussion
P
a
per
|
Liu, H., Remer, L. A., Huang, J., Huang, H. C., Kondragunta, S., Laszlo, I., Oo, M., and Jack-son, J. M.: Preliminary evaluation of S-NPP VIIRS aerosol optical thickness, J. Geophys. Res.-Atmos., 119, 3942–3962, 2014.
Munchak, L. A., Levy, R. C., Mattoo, S., Remer, L. A., Holben, B. N., Schafer, J. S., Hostetler, C. A., and Ferrare, R. A.: MODIS 3 km aerosol product: applications over land 5
in an urban/suburban region, Atmos. Meas. Tech., 6, 1747–1759, doi:10.5194/amt-6-1747-2013, 2013.
Ohara, T., Akimoto, H., Kurokawa, J., Horii, N., Yamaji, K., Yan, X., and Hayasaka, T.: An Asian emission inventory of anthropogenic emission sources for the period 1980–2020, Atmos. Chem. Phys., 7, 4419–4444, doi:10.5194/acp-7-4419-2007, 2007.
10
Park, M. E., Song, C. H., Park, R. S., Lee, J., Kim, J., Lee, S., Woo, J.-H., Carmichael, G. R., Eck, T. F., Holben, B. N., Lee, S.-S., Song, C. K., and Hong, Y. D.: New approach to monitor transboundary particulate pollution over Northeast Asia, Atmos. Chem. Phys., 14, 659–674, doi:10.5194/acp-14-659-2014, 2014.
Petrenko, M., Ichoku, C., and Leptoukh, G.: Multi-sensor Aerosol Products Sampling System 15
(MAPSS), Atmos. Meas. Tech., 5, 913–926, doi:10.5194/amt-5-913-2012, 2012.
Pope III, C. A., Ezzati, M., and Dockery, D. W.: Fine-particulate air pollution and life expectancy in the United States, New Engl. J. Med., 360, 376–386, 2009.
Remer, L. A., Kaufman, Y., Tanré, D., Mattoo, S., Chu, D., Martins, J. V., Li, R.-R., Ichoku, C., Levy, R., and Kleidman, R.: The MODIS aerosol algorithm, products, and validation, J. Atmos. 20
Sci., 62, 947–973, 2005.
Remer, L. A., Mattoo, S., Levy, R. C., and Munchak, L. A.: MODIS 3 km aerosol product: algo-rithm and global perspective, Atmos. Meas. Tech., 6, 1829–1844, doi:10.5194/amt-6-1829-2013, 2013.
Sano, I., Mukai, S., Holben, B., Nakata, M., Yonemitsu, M., Sugimoto, N., Fujito, T., Hiraki, T., 25
Iguchi, N., and Kozai, K.: DRAGON-West Japan campaign in 2012: regional aerosol mea-surements over Osaka, in: Proc. SPIE 8523, Remote Sensing of the Atmosphere, Clouds, and Precipitation IV, 85231 M, 2012.
Smirnov, A., Holben, B. N., Eck, T. F., Dubovik, O., and Slutsker, I.: Cloud-screening and qual-ity control algorithms for the AERONET database, Remote Sens. Environ., 73, 337–349, 30
doi:10.1016/S0034-4257(00)00109-7, 2000.
ACPD
15, 20709–20741, 2015Evaluation of VIIRS, GOCI, and MODIS
Collection 6 AOD retrievals
Q. Xiao et al.
Title Page
Abstract Introduction
Conclusions References
Tables Figures
◭ ◮
◭ ◮
Back Close
Full Screen / Esc
Printer-friendly Version Interactive Discussion
Discussion
P
a
per
|
Discussion
P
a
per
|
Discussion
P
a
per
|
Discussion
P
a
per
|
Table 1.Characteristics and quality control criteria of satellite aerosol products.
Dataset Including Criteria Resolution Coverage
VIIRS EDR Quality Flag=High 6 km, daily Global
VIIRS IP Quality Flag=High 0.75 km, daily Global
GOCI Quality Flag=3 6 km, 8 hourly obs. per day East Asia
Auqa MODIS C6 3 km Quality Flag=3 3 km, daily Global
ACPD
15, 20709–20741, 2015Evaluation of VIIRS, GOCI, and MODIS
Collection 6 AOD retrievals
Q. Xiao et al.
Title Page
Abstract Introduction
Conclusions References
Tables Figures
◭ ◮
◭ ◮
Back Close
Full Screen / Esc
Printer-friendly Version Interactive Discussion
Discussion
P
a
per
|
Discussion
P
a
per
|
Discussion
P
a
per
|
Discussion
P
a
per
|
Table 2.Characteristics of ground AOD measurement datasets.
Temporal Comparison Spatial Comparison
Beijing Data Set AERONET Microtops II
Including Criteria Level 1.5 Median/SD<2
Study Period Jul 2012–Jun 2013 Jan 2012–Jun 2013
East Asia Data Set AERONET DRAGON
Including Criteria Level 2.0 Level 2.0
ACPD
15, 20709–20741, 2015Evaluation of VIIRS, GOCI, and MODIS
Collection 6 AOD retrievals
Q. Xiao et al.
Title Page
Abstract Introduction
Conclusions References
Tables Figures
◭ ◮
◭ ◮
Back Close
Full Screen / Esc
Printer-friendly Version Interactive Discussion
Discussion
P
a
per
|
Discussion
P
a
per
|
Discussion
P
a
per
|
Discussion
P
a
per
|
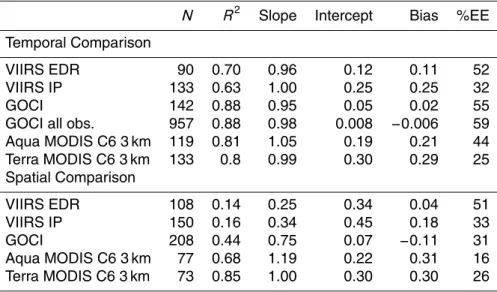
Table 3. Statistics of the temporal and spatial comparisons between satellite retrievals and ground AOD measurements at 550 nm in Beijing.
N R2 Slope Intercept Bias %EE
Temporal Comparison
VIIRS EDR 90 0.70 0.96 0.12 0.11 52
VIIRS IP 133 0.63 1.00 0.25 0.25 32
GOCI 142 0.88 0.95 0.05 0.02 55
GOCI all obs. 957 0.88 0.98 0.008 −0.006 59
Aqua MODIS C6 3 km 119 0.81 1.05 0.19 0.21 44
Terra MODIS C6 3 km 133 0.8 0.99 0.30 0.29 25
Spatial Comparison
VIIRS EDR 108 0.14 0.25 0.34 0.04 51
VIIRS IP 150 0.16 0.34 0.45 0.18 33
GOCI 208 0.44 0.75 0.07 −0.11 31
Aqua MODIS C6 3 km 77 0.68 1.19 0.22 0.31 16
ACPD
15, 20709–20741, 2015Evaluation of VIIRS, GOCI, and MODIS
Collection 6 AOD retrievals
Q. Xiao et al.
Title Page
Abstract Introduction
Conclusions References
Tables Figures
◭ ◮
◭ ◮
Back Close
Full Screen / Esc
Printer-friendly Version Interactive Discussion
Discussion
P
a
per
|
Discussion
P
a
per
|
Discussion
P
a
per
|
Discussion
P
a
per
|
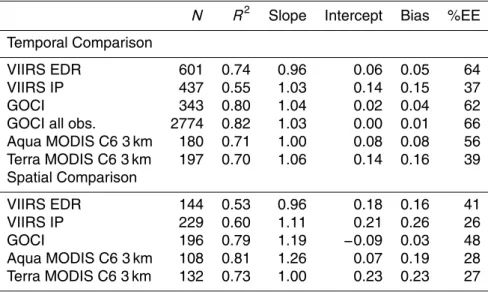
Table 4. Statistics of the temporal and spatial comparisons between satellite retrievals and ground AOD measurements at 550 nm over East Asia.
N R2 Slope Intercept Bias %EE
Temporal Comparison
VIIRS EDR 601 0.74 0.96 0.06 0.05 64
VIIRS IP 437 0.55 1.03 0.14 0.15 37
GOCI 343 0.80 1.04 0.02 0.04 62
GOCI all obs. 2774 0.82 1.03 0.00 0.01 66
Aqua MODIS C6 3 km 180 0.71 1.00 0.08 0.08 56
Terra MODIS C6 3 km 197 0.70 1.06 0.14 0.16 39
Spatial Comparison
VIIRS EDR 144 0.53 0.96 0.18 0.16 41
VIIRS IP 229 0.60 1.11 0.21 0.26 26
GOCI 196 0.79 1.19 −0.09 0.03 48
Aqua MODIS C6 3 km 108 0.81 1.26 0.07 0.19 28
ACPD
15, 20709–20741, 2015Evaluation of VIIRS, GOCI, and MODIS
Collection 6 AOD retrievals
Q. Xiao et al.
Title Page
Abstract Introduction
Conclusions References
Tables Figures
◭ ◮
◭ ◮
Back Close
Full Screen / Esc
Printer-friendly Version Interactive Discussion
Discussion
P
a
per
|
Discussion
P
a
per
|
Discussion
P
a
per
|
Discussion
P
a
per
|
Figure 2. (a) The station to station correlation coefficients of daily mean AOD stratified by distance over (left) DRAGON-Asia region (right) Beijing region. The line is the Loess curvy.
ACPD
15, 20709–20741, 2015Evaluation of VIIRS, GOCI, and MODIS
Collection 6 AOD retrievals
Q. Xiao et al.
Title Page
Abstract Introduction
Conclusions References
Tables Figures
◭ ◮
◭ ◮
Back Close
Full Screen / Esc
Printer-friendly Version Interactive Discussion
Discussion
P
a
per
|
Discussion
P
a
per
|
Discussion
P
a
per
|
Discussion
P
a
per
|