Abstract— This paper reports an effective method of packaging a
fiber Bragg grating (FBG) for the simultaneous measurement of temperature and strain. The technique consists of embedding two fiber Bragg grating sensors inside a polymeric material with different geometrical characteristics. The mechanical and thermal characterizations of the optical transducer were performed. Then a matrix equation used measurements of the wavelength shifts from the two sensors and yielded information about the temperature and strain coefficients. The preliminary results demonstrate the feasibility of the encapsulation technique allowing measurements of temperature and strain in smart structures and harsh environments. The experimental procedure provides robustness to the sensor and the matrix equation approach has the potential to determine simultaneously the strain and temperature coefficients.
Index Terms— Fiber Bragg gratings, packaging, strain and temperature
measurement.
I. INTRODUCTION
The advancement of all the areas in science and technology depends on performance of the
measuring processes that are necessary while investigating the corresponding natural phenomena.
Therefore, in most applications, a sensor should have a reduced size and mass and be capable of
measuring parameters without failure in a wide range of hostile environments and situations. In
addition, it must be immune to electromagnetic interferences, have a high sensitivity and an
acceptable resolution, as well as a low acquisition cost and maintenance.
It is difficult to find a device like those, but the optical fiber sensors have a large set of such
characteristics, making them appropriate for a series of applications. The use of such sensors in the
industrial, military, chemical, petrochemical, telecom, medical and aerospace sectors illustrates the
diversity of measurands that can be detected with them, while their flexibility and adaptability to
several fields of technology can be considered as additional characteristics [1]-[4].
One can mention other distinguished characteristics of those sensors, namely, low transmission
A technique to package Fiber Bragg Grating
Sensors for Strain and Temperature
Measurements
Uilian Dreyer, Kleiton de Morais Sousa, Jonas Somenzi, Ivo de Lourenço Junior, Jean Carlos Cardozo da Silva
Electrical Engineering Graduated Program – PPGEE, Federal University of Technology – Paraná, Pato Branco, Brazil, ZIP 85503-390. E-mail:{ kleitonsousa, lourenco, jeanccs}@utfpr.edu.br
Valmir de Oliveira, Hypolito José Kalinowski
losses (considering the distance between the point of measurement and the interrogation system,
which can reach several kilometers); multiplexing capability; electrical passivity; measurand results
coded into wavelength or intensity, and the possibility of using the same fiber as the sensor element
and the communication channel.
Many projects involving the concept of smart structures would preferably use fiber optic sensors. In
smart structures they can be found inside the beams of bridges, and also in applications to monitor the
convergence of tunnels, the structure of dams, heritage structures and pipelines, among others [5]-[8].
[ Since the sensor can be appropriately inserted in the structures, the information at the local point of
measurement could be directly obtained in a quasi-distributed configuration, avoiding the influence of
external disturbances as it is the case when the sensor is installed on the surface of the structure or at a
point where the measurand would be indirectly obtained.
For this application, fiber Bragg gratings (FBG) form a class of sensors that is being widely used.
The description of its embedded use in smart structures can be found in the scientific literature
[9]-[13], to name a few. [9], [10], [11], [12], [13].
Fiber Bragg gratins are periodic structures imprinted usually in the core of an optical fiber that
cause the refractive index to have a periodic modulation along its length. A beam of light guided in
the core of the fiber will then be gradually diffracted by each of the periods of the modulation and the
wavelengths that satisfy the Bragg condition will constructively add in the counter-propagating
direction. This phenomenon will produce a signal reflected by the FBG that has an optical spectrum
with a band centered at approximately the wavelength that satisfied the condition [14].
These structures can be represented by a set of transversal consecutive planes having the same
disturbed refractive index in the core. From the characteristics of those planes, like their magnitude,
period and envelope of the refractive index along the FBG, one is able to tune the coupling of the
propagating mode to another counter propagating mode at a certain wavelength. In this case, the
Bragg wavelength is represented by:
(1)
where B is the Bragg wavelength, or resonance wavelength, effis the effective refractive index of
the incident mode in the FBG and is the period of the modulation along the FBG.
Any effect that induces changes on the properties of the optical fiber with the FBG, like mechanical
or thermal changes, may cause changes in the period or in the refractive index and this will shift the
resonance wavelength. The changes in the FBG geometry and in the refractive index may force
variations in the phase, intensity and polarization of the propagating signal. This dependence allows
the FBG to be used as sensors that measure such disturbances.
In order to determine the sensitivity to those disturbances, equation (1) can produce the differential
that represents the behavior of the Bragg wavelength with disturbances in temperature (T) and length
effT
K
K
s TB
(
,
T
)
deformation of the sensor (l). The change in the resonance wavelength is then given by equation (2)
after developing the differential of equation (1):
(2)
where l is the length of the FBG and T is the temperature. (¶neff /¶l) represents the sensitivity of
effective index to length changes of L, or the elasto-optic properties of the fiber, while (¶neff /¶T) is
related to the sensitivity of the index to thermal changes of ∆T, or the thermo-optic properties.
(¶ L /¶ T) is related to the thermal expansion sensitivity of the sensor and (¶ L /¶ L), to the length
change in the FBG period caused by a length change.
In (2), a change in ΔλB is caused by mechanical and thermal disturbances in the sensor, either
changing the refractive index or the period of the FBG. Therefore, the monitoring of the spectrum of
the FBG reflected signal would allow the determination of this shift. Since the sensor is sensitive to
both types of perturbations, one cannot distinguish if the wavelength shift was caused by a mechanical
change or a thermal one. Kersey in [15] states that is unfortunate that, even having this immense
breadth of potential application, the sensors do also tend to exhibit serious cross-sensitivity issues.
This can be illustrated by the number of researchers that have written papers on the elimination of
temperature dependence of a strain gauge, or a pressure sensor, or likewise, the effects of polarization
on the sensitivity of such sensors. These practical limitations of fiber sensors – indeed, while
interesting to be experimentally and theoretically explored, often result in fiber sensors providing
weak competitive advantages over conventional sensor systems, thus limiting their value. This issue
is, of course, key to the sustainable success of a fiber optic sensor in any true commercial application.
A few techniques have been used to overcome such inconvenient cross-sensitivity [16]-[18].
In this work, an encapsulation process is described such as to be used with an FBG for the
simultaneous measurement of temperature and strain. It is based on the work described Mokhtar et al.
[10] and is theoretically based on the idea that a change in temperature and strain in the sensor causes
a shift of the resonance wavelength through the effects of mechanical and thermal expansion, and the
thermo-optic and elasto-optic effect on the refractive index.
II. SIMULTANEOUS MEASUREMENT OF TEMPERATURE AND STRAIN
One of the drawbacks using FBGs to measure temperature and strain is the cross-sensitivity that
does not allow one to distinguish the measurands while determining the Bragg wavelength shift.
The change in Bragg wavelength can be written in a more compact form as a function of strain and
temperature changes by:
(3)
D
l
B=
2
L
h
eff
l
+
h
eff
L
l
æ
è
ç
ö
ø
÷
D
l
+
2
L
h
eff
T
+
h
effWhere B represents the change in Bragg wavelength,
K
sis the strain sensitivity andK
T is thetemperature sensitivity; the changes in strain and temperature are represented by
and T,respectively.
When a second FBG subject to the same strain and temperature, one can determine the Bragg
wavelength change of each sensor from the matrix form of equation (3):
1 1 1 2 2 2 T B T B K K
K K T
(4)
The indexes 1 and 2 refer to the first and second FBG, respectively.
The response of both FBGs that have different sensitivities can be combined into a linear system
and be solved to produce the temperature and strain change values. It is natural to think that the same
system can be extended to any number of sensors.
In this case with two sensors, one can find
and T by solving equation (4):2 1 1
2 1 2
1 T T B
B
K K
K K
T D
(5)
where DK K1 T2K K2 T1 is the determinant of the sensitivity matrix in (4).
III. EXPERIMENTAL SETUP
The developed packaging is made of a Polypropylene-Copolymer (PP) with non-uniform
dimensions such as to produce distinct effective temperature and strain coefficients for each of the
FBGs. By doing this, the coefficientsKT1 and KT2present different values, as in the case of the strain
coefficients K1 andK2, which differ from each other. With this in mind, the values of temperature
and strain can be obtained from equation (5).
For the fabrication of the sensors, a steel mold is used (SAE1020). The mold is designed to have a
shape with different heights in the two cavities of the PP piece that will embed the sensors. When the
sensor is completed, the part is pressed downwards with a system having small rods of steel which
should push the sensor to the outside. In addition, the mold has round corners to facilitate the removal
of the sensor, and a fissure such as to accommodate the optical fiber during the fabrication process.
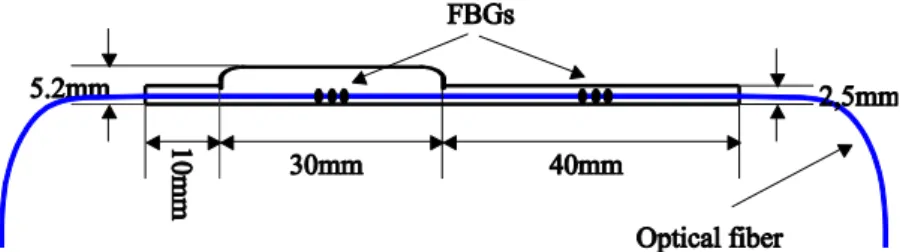
In Figure 1, the designed mold is depicted for the fabrication of the packaging. The lower side of
the packaging has a height of 2.50 mm and a length of 40.00 mm, while the other side has a height of
5.20 mm and a length of 30.00 mm. Both FBGs are located in a central region in each of the cavities
with those specified heights, as depicted in the schematic diagram in Fig. 2, where those dimensions
Figure 1 Designed mold for the fabrication of the sensors.
Figure 2 Schematic diagram of the sensor inside the designed mold where dimensions are indicated.
For the fabrication of the sensor, the PP spheres with a diameter of approximately 2.00mm must be
finely ground. This initial process guarantees that most of the spaces in the mold will be filled such as
to avoid the occurrence of air bubbles inside it and a non-uniform surface on the packaging, since in
this case it would modify the sensor response. The mold is preheated to a temperature of 200ºC for a
period of 50 minutes. The optical fiber is then positioned and the mold is filled with the ground PP.
The set is treated in an oven at a temperature of 170ºC for another 20 minutes until the melting of all
the material. After additional 20 minutes, the mold is cooled with step reductions of 20ºC in the
temperature down to the temperature of the environment. This process is important to allow the
accommodation of the PP material and to avoid the formation of bubbles near the surface of the
sensor. The device is then removed from the mold with the help of the rods of steel. During the
fabrication process, the spectrum of the reflected signal is monitored. The FBGs have initial Bragg
wavelengths at 1542.00 nm and 1536.00 nm while at a temperature of 21ºC. It is shown that the
resonance wavelengths shift to 1538.00 nm and 1528.00 nm, respectively. This behavior is caused by
the contraction of the sensor after the thermal treatment. The Bragg wavelength behavior also
demonstrates that the FBG responds to changes while inside the packaging and also that there has
been an adhesion of the fiber polymer coating to the polypropylene material. After removing the
Figure 3 The fabricated sensor after the finishing process.
For the determination of the temperature and strain sensitivities, the resonance wavelengths were
measured in experiments to separately evaluate the sensitivities. The sensor behavior was measured in
a PolyScience® calibration bath with a resolution 0.1ºC and the temperature varied from 20ºC to 70ºC
in cycles repeated five times. The strain characterization was performed in a mechanical test machine
with the sensor placed on a tensile strain test specimen. During the application of tension, the
elongation of a strain-gage on the specimen was recorded against the applied force. This process was
repeated five times. During the experiments, the FBGs were interrogated by a SI101 system with a
wavelength resolution of 1pm. The FBG interrogation system was produced by the HBM® company.
IV. RESULTS AND DISCUSSIONS
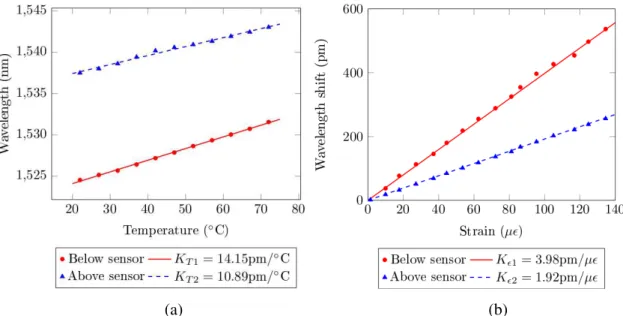
The temperature calibration curves are shown in Fig. 4(a) and the strain curves are depicted in Fig.
4(b). The averaged points from the five calibrations are shown in the corresponding curves in those
figures.
The experimental results present a linear response for the temperature and strain range, therefore
the linear characteristic for the FBGs are maintained and is not altered by the packaging.
Figure 4 Results for the calibration of the sensor in terms of temperature (a) and strain (b). Experimental data (marks) are connected by best-fit lines whose sensitivities are given below each graph.
From the experimental results, linear best fits are performed and are also identified in Fig. 4(a) and
4(b). The linear fittings present a R20.99for the calibrations in temperature and strain. An
important information concerning the linear fittings is that the sensitivities in the sensors located in
the cavities with different dimensions have different sensitivities, namely, KT114.15 pm/ Co for the
sensor in the lower part and KT2 10.09 pm/ Co for the sensor in the upper part. For the calibration of
the sensor in the lower part, the sensitivity is calculated as K13.98 pm/, and presents a
sensitivity of K21.92 pm/for the sensor in the upper part. The obtained differences are due to
the densities of the materials where the FBGs are placed. The lower part of the sensor has less
material than the upper part.
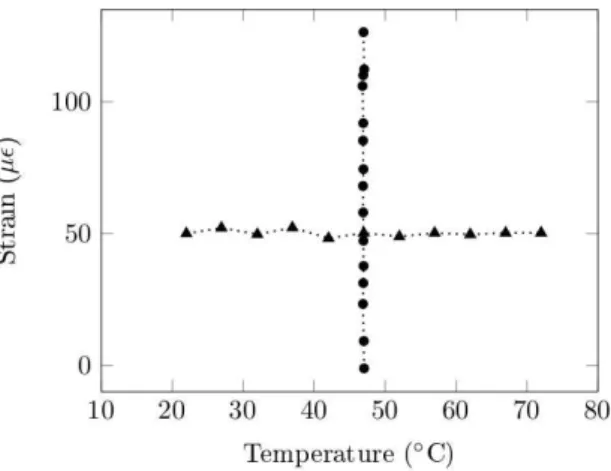
The temperature and strain coefficients that have been experimentally obtained are used in equation
(5) with the goal of producing converted values of temperature and strain corresponding to the
wavelength measured values from the FBG sensors. The result is depicted Fig. 5, where the x-axis
present the values in temperature units and the y values in strain units. This plot allows one to
demonstrate that it is possible to distinguish between temperature and strain results.
Figure 5 Sensor outputs as determined by equation (5) when subjected to various strain at a constant temperature or to varied temperature at a constant strain.
V. CONCLUSION
A packaging technique for FBG sensors has been reported, which was used to embed two FBG
sensors in a polymer material. This encapsulation proved to be robust and capable of allowing the
simultaneous measurement of strain and temperature through FBGs wavelength shifts measurements.
The main contribution of this work resides in the development of a fabrication process of a packaging
to embed the FBG sensors without the use of any type of adhesives. This represents an advantage
under the point of view of precision characteristics of the sensor and it also allows the maintenance of
the linear response of the FBG while measuring temperature or strain. In addition, to improve the
accuracy of the measured values for strain and temperature is necessary to increase the difference
between effective strain and temperature coefficients of the two sensors and this would be possible by
ACKNOWLEDGMENTS
The authors acknowledge CAPES, CNPq, FINEP, SETI and Fundação Araucária for scholarships
and funding. The FBG were fabricated in the Photo Refractive Devices Unit - UTFPR, an associate
laboratory of INCT Fotonicom.
REFERENCES
[1] B. Culshaw, “Optical Fiber Sensor Technologies: Opportunities and—Perhaps—Pitfalls,”
Journal of Lightwave Technology, vol. 22, no. 1, pp. 39–50, Jan. 2004.
[2] K. T. V. Grattan and T. Sun, “Fiber optic sensor technology: an overview,” Sensors and Actuators A: Physical, vol. 82, no. 1–3, pp. 40–61, May 2000.
[3] C. K. Kirkendall and A. Dandridge, “Overview of high performance fibre-optic sensing,”
Journal of Physics D: Applied Physics, vol. 37, no. 18, pp. R197–R216, 2004.
[4] B. Lee, “Review of the present status of optical fiber sensors,” Optical Fiber Technology, vol. 9, no. 2, pp. 57–79, Apr. 2003.
[5] H. N. Li, D. S. Li, and G. B. Song, “Recent applications of fiber optic sensors to health monitoring in civil engineering,” Engineering Structures, vol. 26, no. 11, pp. 1647–1657, 2004.
[6] B. Wang, J. G. Teng, L. D. Lorenzis, L.-M. Zhou, J. Ou, W. Jin, and K. T. Lau, “Strain
monitoring of RC members strengthened with smart NSM FRP bars,” Construction and
Building Materials, vol. 23, no. 4, pp. 1698–1711, 2009.
[7] L. Rippert, J. Papy, M. Wevers, S. V. Huffel, and K. U. Leuven, “Fibre optic sensor for
continuous health monitoring in CFRP composite materials,” Smart Structures and Materials, vol. 4693, pp. 312–323, 2002.
[8] E. Mehrani, A. Ayoub, and A. Ayoub, “Evaluation of fiber optic sensors for remote health
monitoring of bridge structures,” Materials and Structures, vol. 42, no. 2, pp. 183–199, Apr. 2008.
[9] M. Majumder, T. K. Gangopadhyay, A. K. Chakraborty, K. Dasgupta, and D. K. Bhattacharya,
“Fibre Bragg gratings in structural health monitoring—Present status and applications,”
Sensors and Actuators A: Physical, vol. 147, no. 1, pp. 150–164, 2008.
[10] M. R. Mokhtar, T. Sun, and K. T. V. Grattan, “Bragg Grating Packages With Nonuniform
Dimensions for Strain and Temperature Sensing,” IEEE Sensors Journal, vol. 12, no. 1, pp. 139–144, Jan. 2012.
[11] A. Kerrouche, W. J. O. Boyle, K. T. V. Grattan, J. W. Schmidt, and B. Taljsten, “Strain Measurement Using Embedded Fiber Bragg Grating Sensors Inside an Anchored Carbon Fiber
Polymer Reinforcement Prestressing Rod for Structural Monitoring,” IEEE Sensors Journal, vol. 9, no. 11, pp. 1456–1461, Nov. 2009.
[12] H. Ling, K. Lau, L. Cheng, and K. Chow, “Embedded fibre Bragg grating sensors for
[13] Y. J. Rao, “Recent progress in applications of in-fibre Bragg grating sensors,” Opt. Lasers Eng., vol. 31, pp. 297–324, 1999.
[14] A. Othonos, “Fiber Bragg gratings,” Review of Scientific Instruments, vol. 68, no. 12, p. 4309, 1997.
[15] A. D. Kersey, “Fiber optic sensors shine bright: industrial applications where FOS bring differentiated performance/value,” vol. 8421, pp. 1–4, 2012.
[16] O. Frazão and J. L. Santos, “Simultaneous measurement of strain and temperature using a
Bragg grating structure written in germanosilicate fibres,” Journal of Optics A: Pure and Applied Optics, vol. 6, no. 6, pp. 553–556, Jun. 2004.
[17] L. Kuo and Z. Zhen’an, “A high sensitive fiber Bragg grating strain sensor with automatic
temperature compensation,” Chinese Optics Letters, vol. 7, no. 3, pp. 191–193, 2009.
[18] X. Shu, Y. Liu, D. Zhao, B. Gwandu, F. Floreani, L. Zhang, and I. Bennion, “Dependence of temperature and strain coefficients on fiber grating type and its application to simultaneous