A vibrational spectroscopic study of the anhydrous phosphate mineral
sidorenkite Na
3
Mn(PO
4
)(CO
3
)
Ray L. Frost
a,⇑, Andrés López
a, Ricardo Scholz
b, Fernanda Maria Belotti
c, Yunfei Xi
a aSchool of Chemistry, Physics and Mechanical Engineering, Science and Engineering Faculty, Queensland University of Technology, GPO Box 2434, Brisbane, Queensland 4001, Australia
b
Geology Department, School of Mines, Federal University of Ouro Preto, Campus Morro do Cruzeiro, Ouro Preto, MG 35,400-00, Brazil
c
Federal University of Itajubá, Campus Itabira, Itabira, MG, Brazil
h i g h l i g h t s
Sidorenkite Na3Mn(PO4)(CO3) is a phosphate–carbonate of sodium and manganese.
Such a mineral with two oxyanions lends itself to vibrational
spectroscopy.
Raman bands at 1044 cm 1and 1074 cm 1are attributed to the CO
32 stretching modes.
Raman band at 959 cm 1and 1012 cm 1are assigned to the PO
43 stretching modes.
Multiple bands supports the concept of a reduction in symmetry of the carbonate anion.
g r a p h i c a l
a b s t r a c t
a r t i c l e
i n f o
Article history:
Received 10 February 2014
Received in revised form 30 June 2014 Accepted 21 August 2014
Available online 10 September 2014
Keywords:
Sidorenkite Phosphate Carbonate Raman spectroscopy Infrared spectroscopy
a b s t r a c t
Sidorenkite is a very rare low-temperature hydrothermal mineral, formed very late in the crystallization of hyperagpaitic pegmatites in a differentiated alkalic massif (Mt. Alluaiv, Kola Peninsula, Russia). Sido-renkite Na3Mn(PO4)(CO3) is a phosphate–carbonate of sodium and manganese. Such a formula with two oxyanions lends itself to vibrational spectroscopy. The sharp Raman band at 959 cm 1and 1012 cm 1are assigned to the PO43 stretching modes, whilst the Raman bands at 1044 cm 1and 1074 cm 1are attrib-uted to the CO32 stretching modes. It is noted that no Raman bands at around 800 cm 1for sidorenkite were observed. The infrared spectrum of sidorenkite shows a quite intense band at 868 cm 1with other resolved component bands at 850 and 862 cm 1. These bands are ascribed to the CO
3
2 out-of-plane bend
(m2) bending mode. The series of Raman bands at 622, 635, 645 and 704 cm 1are assigned to them4 phosphate bending modes. The observation of multiple bands supports the concept of a reduction in sym-metry of the carbonate anion fromD3hor evenC2v.
Ó2014 Elsevier B.V. All rights reserved.
Introduction
Sidorenkite Na3Mn(PO4)(CO3) is a phosphate–carbonate of sodium and manganese[1]. The mineral is anhydrous and contains
no hydroxyl units. It is a very rare low-temperature hydrothermal mineral, formed very late in the crystallization of hyperagpaitic pegmatites in a differentiated alkalic massif (Mt. Alluaiv, Kola Peninsula, Russia)[2,3]. The mineral is colorless, pale rose-red to pale pink, with surficial brownish or yellowish tint. The mineral is named in honor of Alexander V. Sidorenko (1917–1982), a Russian mineralogist.
http://dx.doi.org/10.1016/j.saa.2014.08.029 1386-1425/Ó2014 Elsevier B.V. All rights reserved.
⇑Corresponding author. Tel.: +61 7 3138 2407; fax: +61 7 3138 1804.
E-mail address:[email protected](R.L. Frost).
Contents lists available atScienceDirect
Spectrochimica Acta Part A: Molecular and
Biomolecular Spectroscopy
It is monoclinic, pseudo-orthorhombic with Point Group 2/m and Space Group: P21/m or P21. a= 8.997(4) Å, b= 6.741(2) Å, c= 5.163(2) Å [4,5]. The mineral is isostructural with bradleyite and bonshtedtite[6]. Chinh et al.[6]state that a characteristic fea-ture of their strucfea-ture is edge joining of the CO3-triangles with the Fe(Mn-, Mg-) octahedrons and Na-polygons. The layered character of the structure explains the perfect cleavage shown by the crystals. These minerals form ideal substrates for sodium ion batteries[7]. Other new minerals related to sidorenkite have been established
[8–10].
It is important to study the vibrational spectroscopy of sido-renkite as there have been very few studies of this mineral as is evidenced in the literature. In addition, sidorenkite is part of a complex paragenesis in the Kola Peninsula. Due to the large variety of minerals, spectroscopy methods can be an important tool in the study of alkaline deposits. The objective of this research is to report the Raman and infrared spectra of sidorenkite and to relate the spectra to the mineral structure.
Experimental
Samples description and preparation
The sidorenkite sample studied in this work forms part of the collection of the Geology Department of the Federal University of Ouro Preto, Minas Gerais, Brazil, with sample code SAC-149. The studied sample is from the Umba mine, Alluaiv Mt. Kovdor massif, Kola Peninsula, Russia[11]. The Kola Peninsula is located in the northeastern segment of the Precambrian Baltic Shield. During the Devonian, numerous ultramafic, alkaline and carbonatitic intrusions were emplaced over an area of more than 100,000 km2 which extends from eastern Finland to the eastern Kola Peninsula. These various ultramafic and alkaline silicate rocks found in Kovdor are considered to have been formed from several batches of a carbonated olivine melanephelinite parental magma by a mechanism involving fractional crystallization, magma mixing and/or contamination[12].
The mineral sample was gently crushed and the associated min-erals were removed under a stereomicroscope Leica MZ4. The sido-renkite studied in this work occurs as single crystals with prismatic hexagonal form up to 5 mm. Scanning electron microscopy (SEM) in the EDS mode was applied to support the mineral characterization.
Scanning electron microscopy (SEM)
Experiments and analyses involving electron microscopy were performed in the Center of Microscopy of the Universidade Federal de Minas Gerais, Belo Horizonte, Minas Gerais, Brazil (http:// www.microscopia.ufmg.br).
Sidorenkite crystals were coated with a 5 nm layer of evapo-rated carbon. Secondary Electron and Backscattering Electron images were obtained using a JEOL JSM-6360LV equipment. Qualitative and semi-quantitative chemical analyses in the EDS mode were performed with a ThermoNORAN spectrometer model Quest and were applied to support the mineral characterization.
Raman microprobe spectroscopy
Crystals of sidorenkite were placed on a polished metal surface on the stage of an Olympus BHSM microscope, which is equipped with 10, 20, and 50 objectives. The microscope is part of a Renishaw 1000 Raman microscope system, which also includes a monochromator, a filter system and a CCD detector (1024 pixels). The Raman spectra were excited by a Spectra-Physics model 127 He–Ne laser producing highly polarized light at 633 nm and
collected at a nominal resolution of 2 cm 1 and a precision of ±1 cm 1in the range between 100 and 4000 cm 1. Repeated acqui-sitions on the crystals using the highest magnification (50) were accumulated to improve the signal to noise ratio of the spectra. Raman Spectra were calibrated using the 520.5 cm 1 line of a silicon wafer. The Raman spectrum of at least 10 crystals was collected to ensure the consistency of the spectra.
Infrared spectroscopy
Infrared spectra were obtained using a Nicolet Nexus 870 FTIR spectrometer with a smart endurance single bounce diamond ATR cell. Spectra over the 4000–525 cm 1 range were obtained by the co-addition of 128 scans with a resolution of 4 cm 1and a mirror velocity of 0.6329 cm/s. Spectra were co-added to improve the signal to noise ratio.
Spectral manipulation such as baseline correction/adjustment and smoothing were performed using the Spectracalc software package GRAMS (Galactic Industries Corporation, NH, USA). Band component analysis was undertaken using the Jandel ‘Peakfit’ soft-ware package that enabled the type of fitting function to be selected and allows specific parameters to be fixed or varied accordingly. Band fitting was done using a Lorentzian–Gaussian cross-product function with the minimum number of component bands used for the fitting process. The Gaussian–Lorentzian ratio was maintained at values greater than 0.7 and fitting was under-taken until reproducible results were obtained with squared corre-lations ofr2greater than 0.995.
Results and discussion
Chemical characterization
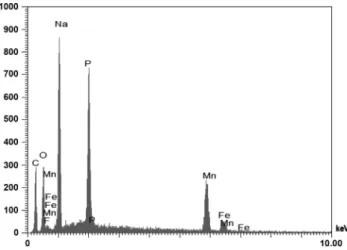
The SEM image of sidorenkite sample studied in this work is given inSupplementary informationand is given as Fig. S1. The sample corresponds to a cleavage fragment up to 4.0 mm. Qualita-tive chemical analysis shows a homogeneous phase, composed by P, Mn, Na and C. Small amount of Fe was also observed and occur in substitution to Mn (Fig. 1). Traces of fluorine were also observed.
Spectroscopy
Spectroscopy of carbonate anion in solids
Nakamoto et al. first published and tabulated the selection rules for unidenate and bidentate anions including the carbonate anion
[13]. The free ion, CO32 withD3hsymmetry exhibits four normal
Fig. 1.EDS spectra of sidorenkite.
vibrational modes; a symmetric stretching vibration (
m
1), an out-of-plane bend (m
2), a doubly degenerate asymmetric stretch (m
3) and another doubly degenerate bending mode (m
4). The symme-tries of these modes are A10 (R) + A200 (IR) + E0 (R, IR) + E00 (R, IR) and occur at 1063, 879, 1415 and 680 cm 1respectively. Generally, strong Raman modes appear around 1100 cm 1due to the sym-metric stretching vibration (m
1), of the carbonate groups, while intense IR and weak Raman peaks near 1400 cm 1are due to the antisymmetric stretching mode (m
3). Infrared modes near 800 cm 1 are derived from the out-of-plane bend (m
2). Infrared and Raman modes around 700 cm 1region are due to the in-plane bending mode (m
4). This mode is doubly degenerate for undistorted CO32 groups[13]. As the carbonate groups become distorted from regular planar symmetry, this mode splits into two components[13]. Infrared and Raman spectroscopy provide sensitive test for structural distortion of CO32.
Vibrational spectroscopy
The Raman spectrum of sidorenkite over the 100–1500 cm 1 spectral range is shown inFig. 2a. The infrared spectrum of sido-renkite over the 600–2000 cm 1 spectral range is shown in
Fig. 2b. These figures display the position and relative intensity of the Raman and infrared bands of sidorenkite. The Raman or infrared spectrum may be subdivided into subsections based upon the type of vibration being studied.
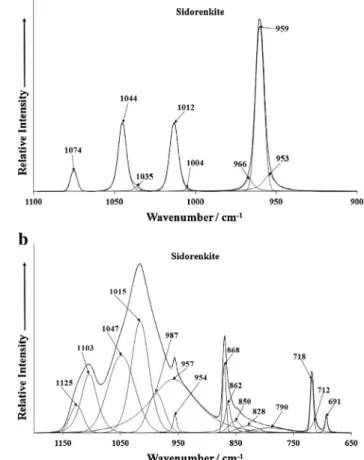
The Raman spectrum of sidorenkite over the 900–1100 cm 1is reported inFig. 3a. This spectrum is a very ‘clean’ spectrum with quite sharp Raman bands. This spectral region is where the carbon-ate and phosphcarbon-ate stretching modes are to be identified. The sharp Raman band at 959 cm 1with two low intensity shoulders at 953 and 966 cm 1 is assigned to the PO
4 3
m
1 symmetric stretchingmode. The Raman band at 1012 cm 1with a very low intensity shoulder band at 1004 cm 1is identified as the
m
3antisymmetric stretching mode of the phosphate units. The Raman band at 1044 cm 1 with a shoulder at 1035 cm 1 is attributed to the CO32m
1symmetric stretching mode and the corresponding CO32m
3antisymmetric stretching vibration is noted at 1074 cm 1. It is noted that these bands are observed for the mineral burkeite which is also a anhydrous carbonate mineral at 1062 and 1102 cm 1[14].The infrared spectrum over the 650–1200 cm 1spectral range is illustrated inFig. 3b. The infrared spectrum when compared with the Raman spectrum is quite broad. Nevertheless, infrared bands may be resolved. The feature at 957 cm 1is the infrared vibration of the PO43
m
1symmetric stretching mode. The infrared band at 1015 cm 1 is ascribed to the PO4 3
m
3 antisymmetric stretching mode. The infrared feature at 1047 cm 1which is in the envelope of the 1015 cm 1 band is attributed to the CO3 2
m
1 symmetric stretching mode. The infrared band at 1103 cm 1with a shoulder band at 1125 cm 1 are assigned to the CO3 2
m
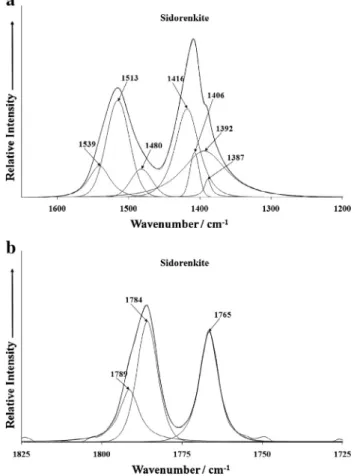
3 antisymmetric stretching mode. The infrared bands between 650 and 870 cm 1 are related to the carbonate and phosphate bending modes (and are discussed later).The infrared spectrum of sidorenkite over the 1200–1700 cm 1 spectral range and over the 1525–1200 cm 1 spectral range are reported inFig. 4a and b respectively. A series of overlapping bands are noted in this spectral region. Infrared bands are resolved at 1387, 1392, 1406, 1416, 1480, 1513 and 1539 cm 1. These bands are attributed to the CO32
m
3 antisymmetric stretching mode. Infrared bands are observed at 1765 and 1784 cm 1. It is not certain as to the assignment of these bands but they may be due to overtones or combination bands.Fig. 2.(a) Raman spectrum of sidorenkite (upper spectrum) over the 100– 1500 cm1spectral range. (b) Infrared spectrum of sidorenkite (lower spectrum)
over the 600–2000 cm1spectral range.
Fig. 3.(a) Raman spectrum of sidorenkite (upper spectrum) in the 900–1100 cm 1
The Raman spectrum of sidorenkite over the 350–700 cm 1and 100–350 cm 1 spectral ranges are displayed in Fig. 5. Infrared modes near 800 cm 1 are derived from the out-of-plane bend (
m
2). Infrared and Raman modes around 700 cm 1region are due to the in-plane bending mode (m
4). This mode is doubly degenerate for undistorted CO32 groups. As the carbonate groups become dis-torted from regular planar symmetry, this mode splits into two components. Infrared and Raman spectroscopy provide sensitive test for structural distortion of CO32 . It is noted that no Raman bands at around 800 cm 1for sidorenkite were observed. The infra-red spectrum of sidorenkite (Fig. 3b) shows a quite intense band at 868 cm 1with other resolved component bands at 850, 862 and 868 cm 1. These bands are ascribed to the CO3
2 out-of-plane bend
(
m
2) bending mode. This infrared spectrum also shows bands at 691, 712 and 718 cm 1and are assigned to the CO3 2
m
4in plane bending modes. The Raman band at 579 cm 1is attributed to them
4out of plane bending modes of the PO43 units.The Raman bands at 414 and 469 cm 1are assigned to them
2PO43 bending mode. Strong Raman bands are noted in the far low wavenumber region at 159, 202 cm 1with low intensity bands at 129, 179, 252 and 297 cm 1 are assigned to lattice modes.Conclusions
Raman spectroscopy combined with infrared spectroscopy has been used to study the mineral sidorenkite, a mineral which is found in hyperagpaitic pegmatites in a differentiated alkalic massif (Mt. Alluaiv, Kola Peninsula, Russia). The mineral may be readily determined using vibrational spectroscopy. However, Raman spec-troscopy proved more useful for the analysis of sidorenkite, no
doubt because of the smaller spot size, being the order of 1
l
m as compared with infrared spectroscopy where the spot size is at best around 25l
m.Acknowledgements
The financial and infra-structure support of the Discipline of Nanotechnology and Molecular Science, Science and Engineering Faculty of the Queensland University of Technology, is gratefully acknowledged. The Australian Research Council (ARC) is thanked for funding the instrumentation. The authors would like to acknowledge the Center of Microscopy at the Universidade Federal de Minas Gerais (http://www.microscopia.ufmg.br) for providing the equipment and technical support for experiments involving electron microscopy.
Appendix A. Supplementary material
Supplementary data associated with this article can be found, in the online version, athttp://dx.doi.org/10.1016/j.saa.2014.08.029.
References
[1]A.P. Khomyakov, E.I. Semenov, M.E. Kazakova, N.G. Shumyatskaya, Zap. Vsesoyuznogo Min. 108 (1979) 56–59.
[2]A.P. Khomyakov, A.V. Bykova, A.P. Shlikhter, Zap. Vsesoyuznogo Min. 109 (1980) 592–594.
[3]E.I. Semenov, A.P. Khomyakov, Sovetskaya Geol. (1986) 97–103.
[4]T.A. Kurova, N.G. Shumyatskaya, A.A. Voronkov, Y.A. Pyatenko, Min. Zh. 2 (1980) 65–70.
[5]T.A. Kurova, N.G. Shumyatskaya, A.A. Voronkov, Y.A. Pyatenko, Dok. Akad. Nauk SSSR 251 (1980) 605–607.
Fig. 4.(a) Infrared spectrum of sidorenkite (lower spectrum) in the 1200– 1700 cm1spectral range. (b) Infrared spectrum of sidorenkite (lower spectrum)
in the 1725–1825 cm1spectral range.
Fig. 5.(a) Raman spectrum of sidorenkite (upper spectrum) in the 350–700 cm 1
spectral range. (b) Raman spectrum of sidorenkite (lower spectrum) in the 100– 350 cm 1spectral range.
[6]T. Chinh Thi Le, T.N. Nadezhina, E.A. Pobedimskaya, A.P. Khomyakov, Min. Zh. 6 (1984) 79–84.
[7]H. Chen, Q. Hao, O. Zivkovic, G. Hautier, L.-S. Du, Y. Tang, Y.-Y. Hu, X. Ma, C.P. Grey, G. Ceder, Chem. Mat. 25 (2013) 2777–2786.
[8]A.P. Khomjakov, L.I. Polezhaeva, E.V. Sokolova, Zap. Vsesoyuznogo Min. 123 (1994) 107–111.
[9]A.P. Khomyakov, A.V. Bykova, Y.A. Malinovskii, Zap. Vsesoyuznogo Min. 109 (1980) 476–479.
[10]A.P. Khomyakov, Y.A. Malinovskii, S.M. Sandomirskaya, Zap. Vsesoyuznogo Min. 110 (1981) 600–603.
[11]P.M. Kartashov, G. Ferraris, S.V. Soboleva, N.V. Chukanov, Can. Min. 44 (2006) 1331–1339.
[12]M.J. Lee, J.I. Lee, S.D. Hur, Y. Kim, J. Moutte, E. Balaganskaya, Lithos 91 (2006) 250.
[13]K. Nakamoto, J. Fujita, S. Tanaka, M. Kobayashi, J. Amer. Chem. Soc. 79 (1957) 4904–4908.