Ray L. Frost
, Andrés López
, Ricardo Scholz
a
School of Chemistry, Physics and Mechanical Engineering, Science and Engineering Faculty, Queensland University of Technology, GPO Box 2434, Brisbane, Queensland 4001, Australia
b
Geology Department, School of Mines, Federal University of Ouro Preto, Campus Morro do Cruzeiro, Ouro Preto, MG 35400-00, Brazil
h i g h l i g h t s
We have studied the mineral sonoraite.
Using a combination of SEM with EDX and vibrational spectroscopy. Chemical analysis shows a
homogeneous composition, with predominance of Te, Fe, Ce and In with minor amounts of S.
The sharp Raman band at 3283 cm 1 assigned to the OH stretching vibration of the OH units.
g r a p h i c a l
a b s t r a c t
a r t i c l e
i n f o
Article history:
Received 18 June 2014
Received in revised form 24 September 2014
Accepted 20 March 2015 Available online 26 March 2015
Keywords:
Tellurite Sonoraite Cliffordite Keystoneite Raman spectroscopy Infrared spectroscopy
a b s t r a c t
We have undertaken a study of the tellurite mineral sonorite using electron microscopy with EDX com-bined with vibrational spectroscopy. Chemical analysis shows a homogeneous composition, with pre-dominance of Te, Fe, Ce and In with minor amounts of S. Raman spectroscopy has been used to study the mineral sonoraite an examples of group A(XO3), with hydroxyl and water units in the mineral struc-ture. The free tellurite ion hasC3vsymmetry and four modes, 2A1and 2E. An intense Raman band at 734 cm1is assigned to the
m1(TeO3)2 symmetric stretching mode. A band at 636 cm 1is assigned to them3(TeO3)2 antisymmetric stretching mode. Bands at 350 and 373 cm 1and the two bands at 425 and 438 cm 1are assigned to the (TeO
3)2 m2(A1) bending mode and (TeO3)2 m4(E) bending modes. The sharp band at 3283 cm 1assigned to the OH stretching vibration of the OH units is superimposed upon a broader spectral profile with Raman bands at 3215, 3302, 3349 and 3415 cm 1are attributed to water stretching bands. The techniques of Raman and infrared spectroscopy are excellent for the study of tellurite minerals.
Ó2015 Elsevier B.V. All rights reserved.
Introduction
The mineral sonoraite Fe3+Te4+O
3(OH)H2O is a zeolite-like tell-urite mineral with a negatively charged framework of [Fe(TeO3)] units having large open channels of 8.28 Å[1]. The mineral and related compounds have been synthesised[2–4]. A related mineral
is kinichilite Mg0.5[Mn2+Fe3+(TeO3)3]4.5H2O [5]. Emmonsite Fe23+Te34+O92H2O discovered in 1904[6]is found in the tellurium rich deposits of Mexico [7]. The importance of these tellurium bearing minerals is their open framework structures with nega-tively charged surfaces with zeolites pores [8]. Other tellurite minerals are cliffordite UTe34+O9 [9,10] and keystoneite Mg0.5[Ni2+Fe3+(TeO3)3]4.5H2O[11,12].
Raman spectroscopy has proven very useful for the study of minerals. Indeed, Raman spectroscopy has proven most useful for
http://dx.doi.org/10.1016/j.saa.2015.03.089
1386-1425/Ó2015 Elsevier B.V. All rights reserved.
⇑ Corresponding author. Tel.: +61 7 3138 2407; fax: +61 7 3138 1804.
the study of diagenetically related minerals as often occurs with many minerals. Some previous studies have been undertaken by the authors, using Raman spectroscopy to study complex secondary minerals formed by crystallization from concentrated solutions. The authors have studied sonorite using Raman spec-troscopy[13]as well as other tellurite minerals[14–19]. In this work we have extending our studies of sonorite by undertaking chemical analysis and electron microscopic studies. The aim of this paper is to present Raman and infrared spectra of natural sonorite and to discuss the spectra from a structural point of view. It is part of systematic studies on the vibrational spectra of minerals of sec-ondary origin in the oxide supergene zone and their synthetic analogs.
Experimental
Samples description and preparation
The sonoraite sample studied in this work originated from the Moctezuma mine, New Mexico. This is the, type‘ mineral i.e., the mineral is accepted as the standard for this mineral. The composi-tions have been reported by Anthony et al. (p. 658)[20].
The sample was incorporated to the collection of the Geology Department of the Federal University of Ouro Preto, Minas Gerais, Brazil, with sample code SAC-153. The sample was gently
Fig. 2.EDS analysis of sonoraite.
Fig. 1.Backscattered electron image (BSI) of a sonoraite crystal aggregate up to 0.5 mm in length.
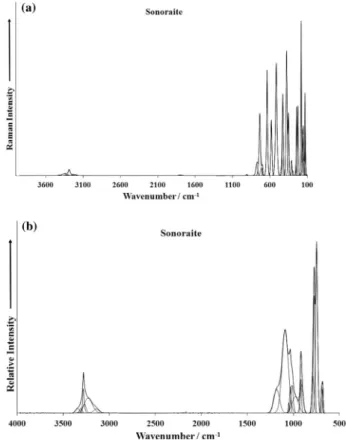
Fig. 3.(a) Raman spectrum of sonoraite over the 100–4000 cm1spectral range
(upper spectrum), (b) infrared spectrum of sonoraite over the 500–4000 cm1
spectral range (lower spectrum).
Fig. 4.(a) Raman spectrum of sonoraite (upper spectrum) in the 850–1200 cm 1
crushed and the associated minerals were removed under a stereomicroscope Leica MZ4. Qualitative and semiquantitative chemical analyses via SEM/EDS were applied to the mineral characterization.
Scanning electron microscopy (SEM)
Experiments and analyses involving electron microscopy were performed in the Center of Microscopy of the Universidade Federal de Minas Gerais, Belo Horizonte, Minas Gerais, Brazil (http://www.microscopia.ufmg.br).
Sonoraite crystals were coated with a 5 nm layer of evaporated carbon. Secondary Electron and Backscattering Electron images were obtained using a JEOL JSM-6360LV equipment. Qualitative and semi-quantitative chemical analyses in the EDS mode were performed with a ThermoNORAN spectrometer model Quest and was applied to support the mineral characterization.
Raman microprobe spectroscopy
Crystals of sonoraite were placed on a polished metal surface on the stage of an Olympus BHSM microscope, which is equipped with
10, 20, and 50 objectives. The microscope is part of a Renishaw 1000 Raman microscope system, which also includes a monochromator, a filter system and a CCD detector (1024 pixels). The Raman spectra were excited by a Spectra-Physics model 127 He–Ne laser producing highly polarized light at 633 nm and collected at a nominal resolution of 2 cm 1 and a precision of ±1 cm 1 in the range between 200 and 4000 cm 1. Repeated acquisitions on the crystals using the highest magnification (50) were accumulated to improve the signal to noise ratio of the spectra. Raman Spectra were calibrated using the 520.5 cm 1 line of a silicon wafer. The Raman spectrum of at least 10 crystals was collected to ensure the consistency of the spectra.
An image of the sonoraite crystals measured is shown in the graphical abstract. Clearly the crystals of sonoraite are readily observed, making the Raman spectroscopic measurements readily obtainable.
Infrared spectroscopy
Infrared spectra of sonoraite were obtained using a Nicolet Nexus 870 FTIR spectrometer with a smart endurance single bounce diamond ATR cell. Spectra over the 4000–525 cm 1range Fig. 5.(a) Raman spectrum of sonoraite (upper spectrum) in the 300–800 cm 1spectral range and (b) Raman spectrum of sonoraite (lower spectrum) in the 100–300 cm 1
were obtained by the co-addition of 128 scans with a resolution of 4 cm 1 and a mirror velocity of 0.6329 cm/s. Spectra were co-added to improve the signal to noise ratio.
Spectral manipulation such as baseline correction/adjustment and smoothing were performed using the Spectracalc software package GRAMS (Galactic Industries Corporation, NH, USA). Band component analysis was undertaken using the Jandel ‘Peakfit’ soft-ware package that enabled the type of fitting function to be selected and allows specific parameters to be fixed or varied accordingly. Band fitting was done using a Lorentzian–Gaussian cross-product function with the minimum number of component bands used for the fitting process. The Lorentzian–Gaussian ratio was maintained at values greater than 0.7 and fitting was under-taken until reproducible results were obtained with squared correlations ofr2greater than 0.995.
Results and discussion
Chemical characterization
The SEM image of sonoraite sample studied in this work is shown inFig. 1. The image shows a fragment of a crystal aggregate. The chemical analysis is shown in Fig. 2. Qualitative chemical analysis shows a homogeneous composition, with predominance
of Te, Fe, Ce and In with minor amounts of S. The formula of the studied mineral is (Fe3+, Ce, In)Te4+O
3(OH)H2O.
Vibrational spectroscopy
The Raman spectrum of sonoraite in the 100–4000 cm 1 spec-tral range is illustrated inFig. 3a. This spectrum shows the position of the Raman bands and their relative intensities. It is obvious that there are large parts of the spectrum where no Raman intensity is observed. Therefore, the Raman spectrum is subdivided into sec-tions according to the type of vibration being investigated. Intensity in the OH stretching region is notably low. In this way, the precise position of the bands can be detailed. The infrared spec-trum of sonoraite in the 500–4000 cm 1spectral range is shown in Fig. 3b. The reflectance spectrum starts at 500 cm 1because the ATR cell absorbs all infrared radiation below this wavenumber. As for the Raman spectrum, the infrared spectrum is subdivided into sections depending upon the type of vibration being exam-ined. The complete infrared spectrum displays the position of the infrared bands and their relative intensity.
The Raman spectrum of sonoraite over the 1000–850 cm 1 spectral range is reported in Fig. 4a. The infrared spectrum of kidwellite over the 650–1300 cm 1 spectral range is reported in Fig. 4b. Farmer[21]states that very little research has been under-taken on the vibrational spectroscopy of selenates/selenites or Fig. 6.(a) Infrared spectrum of sonoraite (upper spectrum) in the 2500–3700 cm 1spectral range and (b) infrared spectrum of sonoraite (lower spectrum) in the 1300–
stretching mode respectively.
The low wavenumber region of sonoraite in the 400–800 cm 1 region is shown inFig. 5a. The series of Raman bands at 697, 715, 734, 763 and 775 cm 1are attributed to the
m
1(TeO3)2 symmetricstretching mode. The Raman bands at 580 and 836 cm 1may be assigned to the
m
3(TeO3)2 antisymmetric stretching mode. Thetwo bands at 373 and 350 cm 1 and the two bands at 425 and 436 cm 1are assigned to the (TeO
3)2
m
2(A1) bending mode and(TeO3)2
m
4 (E) bending modes respectively. The bands at 294and 309 cm 1are attributed to FeO stretching vibrations. Raman bands in the 125 and 250 cm 1are assigned to lattice vibrations. Two sharp intense Raman bands observed at 225, 241 and 252 cm 1(Fig. 5b) are considered to be related to the OH units in their hydrogen bonding to the (TeO3)2 units. A comparison may be made with other tellurite containing minerals such as rajite, denningite, zemmanite and emmonsite. Raman bands for rajite, observed at (346, 370) and 438 cm 1 are assigned to the (Te2O5)2
m
2(A1) bending mode andm
4(E) bending modes. The veryweak Raman bands of denningite at 450 and 479 cm 1are assigned to the (Te2O5)2
m
4(E) bending modes and the bands at 349 and381 cm 1 are ascribed to the (Te
2O5)2
m
2 (A1) bending modes.Raman bands are observed at 372 and 408 cm 1for zemmanite and 397 and 414 cm 1for emmonsite, which may be due to the (TeO3)2
m
2(A1) bending mode.The Raman spectrum of sonoraite in the 3000–3600 cm 1 region is displayed inFig. 6a. The infrared spectrum of sonoraite in the 3000–3400 cm 1 region is displayed inFig. 6b. The sharp Raman band at 3283 cm 1is assigned to the OH stretching vibra-tion of the OH units. This band appears to be superimposed upon a broader spectral profile. Raman bands are observed at 3215, 3302, 3419 and 3415 cm 1which are attributed to water stretch-ing bands. The observation of multiple bands suggests that the water molecules in the unit cell of sonoraite are non-equivalent.
Conclusions
We have undertaken a study of the mineral sonoraite using a combination of electron microscopy with EDX and vibrational
for funding the instrumentation. The authors would like to acknowledge the Center of Microscopy at the Universidade Federal de Minas Gerais (http://www.microscopia.ufmg.br) for providing the equipment and technical support for experiments involving electron microscopy. L. Souza is grateful to PIBIC/UFOP/ CNPq.
References
[1]J.A. Mandarino, E. Matzat, S.J. Williams, Can. Mineral 14 (Pt. 3) (1976) 387–390. [2]R. Miletich, Monatsh. Chem. 126 (1995) 417–421.
[3]M. Wildner, Mineral Petrol. 48 (1993) 215–225.
[4]N.S. Bhuvanesh, P.S. Halasyamani, Inorg. Chem. 40 (2001) 1404–1405. [5]R. Miletich, Eur. J. Mineral 7 (1995) 509–523.
[6]W.F. Hillebrand, Am. J. Sci. 18 (1904) 433–434.
[7]R.V. Gaines, Univ. Nacl. Autonoma Mex., Inst. Geol. Bol. 75 (1965) 1–15. [8]J. Li, E. Makovicky, Neues Jahrb. Mineral. 176 (2001) 269–297.
[9]R. Fischer, M. Schlatti, J. Zemann, Anzeiger der Oesterreichischen Akademie der Wissenschaften, Math. Naturwiss. Kl. 5 (1969) 93–94.
[10] R.V. Gaines, Am. Mineral 54 (1969) 697–701.
[11]A.C. Roberts, T.S. Ercit, A.J. Criddle, G.C. Jones, R.S. Williams, F.F. Cureton II, M.C. Jensen, Mineral Mag. 58 (1994) 417–424.
[12]A.C. Roberts, M. Bonardi, J.D. Grice, T.S. Ercit, W.W. Pinch, Can. Mineral 27 (1989) 129–131.
[13]R.L. Frost, E.C. Keeffe, J. Raman Spectrosc. 40 (2009) 133–136. [14]R.L. Frost, E.C. Keeffe, Spectrochim. Acta, Part A 73 (2009) 146–149. [15]R.L. Frost, M.J. Dickfos, E.C. Keeffe, Spectrochim. Acta, Part A 71 (2009) 1512–
1515.
[16]R.L. Frost, M.J. Dickfos, E.C. Keeffe, Spectrochim. Acta, Part A 71 (2009) 1663– 1666.
[17]R.L. Frost, M.J. Dickfos, Spectrochim. Acta, Part A 72 (2009) 445–448. [18]R.L. Frost, J. Cejka, M.J. Dickfos, J. Raman Spectrosc. 40 (2009) 38–41. [19]R.L. Frost, J. Cejka, M. Weier, G.A. Ayoko, Spectrochim. Acta, Part A 65 (2006)
571–574.
[20] J.W. Anthony, R.A. Bideaux, K.W. Bladh, M.C. Nichols, Handbook of Mineralogy, Mineral Data Publishing, Tuscon, Arizona, USA, 2000.
[21] V.C. Farmer (Ed.), Mineralogical Society Monograph 4: The Infrared Spectra of Minerals, 1974.
[22] H. Siebert, Anwendungen der Schwingungsspektroskopie in der Anorganischen Chemie (Anorganische und Allgemeine Chemie in Einzeldarstellungen, Bd. 7) (Application of Vibrational Spectroscopy in Inorganic Chemistry (Monographs in Inorganic and General Chemistry, Vol. 7)), 1966.