Thermal analysis and vibrational spectroscopic characterization
of the boro silicate mineral datolite – CaBSiO
4
(OH)
Ray L. Frost
a,⇑, Yunfei Xi
a, Ricardo Scholz
b, Rosa Malena Fernandes Lima
c, Laura Frota Campos Horta
b,
Andres Lopez
aaSchool of Chemistry, Physics and Mechanical Engineering, Science and Engineering Faculty, Queensland University of Technology, GPO Box 2434, Brisbane, Queensland 4001, Australia bGeology Department, School of Mines, Federal University of Ouro Preto, Campus Morro do Cruzeiro, Ouro Preto, MG 35,400-000, Brazil
cMining Engineering Department, School of Mines, Federal University of Ouro Preto, Campus Morro do Cruzeiro, Ouro Preto, MG 35,400-00, Brazil
h i g h l i g h t s
In this work we have studied datolite CaBSiO4(OH).
It is an important mineral used for the production of special ceramics. For the immobilization of
medium-level radioactive wastes.
We have characterized datolite using vibrational spectroscopy.
The spectra are in accordance with BO0(OH) and SiO tetrahedra.
g r a p h i c a l
a b s t r a c t
a r t i c l e
i n f o
Article history:
Received 11 February 2013
Received in revised form 29 May 2013 Accepted 4 June 2013
Available online 28 June 2013
Keywords:
Thermal analysis Thermal stability Datolite Silicate Borate
Vibrational spectroscopy
a b s t r a c t
The objective of this work is to determine the thermal stability and vibrational spectra of datolite CaB-SiO4(OH) and relate these properties to the structure of the mineral. The thermal analysis of datolite
shows a mass loss of 5.83% over a 700–775°C temperature range. This mass loss corresponds to 1 water
(H2O) moleculespfu. A quantitative chemical analysis using electron probe was undertaken. The Raman
spectrum of datolite is characterized by bands at 917 and 1077 cm1assigned to the symmetric
stretch-ing modes of BO and SiO tetrahedra. A very intense Raman band is observed at 3498 cm1assigned to the
stretching vibration of the OH units in the structure of datolite. BOH out-of-plane vibrations are charac-terized by the infrared band at 782 cm1. The vibrational spectra are based upon the structure of datolite
based on sheets of four- and eight-membered rings of alternating SiO4and BO3(OH) tetrahedra with the
sheets bonded together by calcium atoms.
Ó2013 Elsevier B.V. All rights reserved.
Introduction
Borates and boron silicate minerals such as boracite, ulexite, colemanite and datolite are important materials for the production of boron compounds that are used in the manufacture of a variety of industrial products. The mineral datolite is a calcium borate silicate and has chemical formula given as CaBSiO4(OH). It has
special application as a raw material in the glass industry and in the production of special ceramics used to immobilize medium-le-vel radioactive wastes for disposal[1]and to protect from neutron radiation[2]. Other uses are in the electrical engineering[3–5]in the microfiltration processes of waste and natural water[6]and in the protection of metals[7]. With minor importance, datolite is used as a gemstone[8]. Datolite is an important mineral used for the production of special ceramics for the immobilization of medium-level radioactive wastes. Datolite is sought by mineral collectors market due to the beauty of the crystals.
1386-1425/$ - see front matterÓ2013 Elsevier B.V. All rights reserved.
http://dx.doi.org/10.1016/j.saa.2013.06.012
⇑Corresponding author. Tel.: +61 7 3138 2407; fax: +61 7 3138 1804.
E-mail address:[email protected](R.L. Frost).
Contents lists available atSciVerse ScienceDirect
Spectrochimica Acta Part A: Molecular and
Biomolecular Spectroscopy
Datolite was first described by Klaproth [9] in samples from Nødebro Iron Mine, Aust-Agder, Norway. The crystal structure was first determined by Ito and Mori[10] and later was refined by Foit et al.,[11]. The mineral crystallizes in the monoclinic sys-tem, space group P21/c, Z= 4, with cell parameters given as
a= 4.832 Å, b= 7.608 Å,c= 9.636 Å andb= 90.40°. Refinement of the structure has continued [12–14]. Datolite is member of the gadolinite-datolite group that includes gadolinite, minasgeraisite and bakerite among others[15]. As determined by Ito and Mori
[10], the structure of datolite is based on sheets of four- and eight-membered rings of alternating SiO4and BO3(OH) tetrahedra
with the sheets bonded together by calcium atoms. bridging oxy-gen atoms are bonded to one Si, one B, and one or two Ca atoms; whereas the non-bridging oxygens atoms are bonded either to one Si and two Ca or to one B, one H, and two Ca atoms.
Datolite is commonly found in cavities and veins, especially in basalts and gabbros[16]and more rarely in granitic rocks[17,18]. Datolite is considered a low temperature mineral formed by hydro-thermal activity[17,19]. In this work, spectroscopic investigation of a pure datolite sample from Italy has been carried out. The analysis includes spectroscopic characterization of the structure with infra-red and Raman spectroscopy. Electron microprobe in the WDS mode was applied in the chemical analysis and was used to support the mineral characterization. Thermogravimetric analysis was ap-plied to support the H2O determination and the formula calculation.
Experimental
Samples description and preparation
The datolite sample studied in this work was obtained from the collection of the Geology Department of the Federal University of Ouro Preto, Minas Gerais, Brazil, with sample code SAA-128. The sample is from Canossa, Reggio Emilia, Italy, where it occurs filling fractures in basaltic rocks.
The sample was gently crushed and the associated minerals were removed under a stereomicroscope Leica MZ4. The datolite single crystals were selected and phase analyzed by X-ray diffrac-tion. Scanning electron microscopy (SEM) was to study the mor-phology of the mineral.
Electron microprobe analysis (EMP)
Chemical characterization was carried via EMP. One single crys-tal was selected and prepared in epoxy resin. The single cryscrys-tal was analyzed with the performance of ten spots. The chemical analysis was carried out with a Jeol JXA8900R spectrometer from the Phys-ics Department of the Federal University of Minas Gerais, Belo Hor-izonte. For each selected element, we used the following standards and crystals: Ca – anorthite/PETJ, Si – quartz/PETJ, K – microcline/ PETJ, Na – jadeite/TAP, Al – Al2O3/TAP, Fe – siderite/LIF and F –
CaF2. B was calculated by stoichiometry and H2O was calculated
by mass loss with thermogravimetric analysis. The epoxy embed-ded datolite sample was coated with a thin layer of evaporated car-bon. The electron probe microanalysis in the WDS (wavelength dispersive spectrometer) mode was obtained at 15 kV accelerating voltage and beam current of 10 nA. Chemical formula was calcu-lated on the basis of five oxygen atoms (O, F, OH). ZAF correction was applied with support of the JEOL software XM-97312. The er-ror in measurements is considered ±2 wt.%.
Raman microprobe spectroscopy
Non-oriented crystals of datolite were placed on a polished me-tal surface on the stage of an Olympus BHSM microscope, equipped
with 10, 20, and 50objectives. The microscope is part of a
Renishaw 1000 Raman microscope system, which also includes a monochromator, a filter system and a CCD detector (1024 pixels). The Raman spectra were excited by a Spectra-Physics model 127 He-Ne laser producing highly polarized light at 633 nm and
col-lected at a nominal resolution of 2 cm1 and a precision of
±1 cm1in the range between 100 and 4000 cm1. Repeated
acqui-sitions on the crystals using the highest magnification (50) were
accumulated to improve the signal to noise ratio of the spectra. Ra-man Spectra were calibrated using the 520.5 cm1line of a silicon
wafer. The Raman spectrum of at least 10 crystals was collected to ensure the consistency of the spectra.
Infrared spectroscopy
Infrared spectra were obtained using a Nicolet Nexus 870 FTIR spectrometer with a smart endurance single bounce diamond
ATR cell. Spectra over the 4000–525 cm1 range were obtained
by the co-addition of 128 scans with a resolution of 4 cm1and a
mirror velocity of 0.6329 cm/s. Spectra were co-added to improve the signal to noise ratio.
Spectral manipulation such as baseline correction/adjustment and smoothing were performed using the Spectracalc software package GRAMS (Galactic Industries Corporation, NH, USA). Band component analysis was undertaken using the Jandel ‘Peakfit’ soft-ware package that enabled the type of fitting function to be se-lected and allows specific parameters to be fixed or varied accordingly. Band fitting was done using a Lorentzian–Gaussian cross-product function with the minimum number of component bands used for the fitting process. The Gaussian–Lorentzian ratio was maintained at values greater than 0.7 and fitting was under-taken until reproducible results were obtained with squared corre-lations ofr2greater than 0.995.
Thermogravimetric analysis – TG/DTG
Thermogravimetric analysis of the datolite mineral were ob-tained by using TA Instruments Inc. Q50 high-resolution TGA oper-ating at a 10°C/min ramp with data sample interval of 0.50 s/pt from room temperature to 1000°C in a high-purity flowing nitro-gen atmosphere (100 cm3/min). A total mass of 101.95 mg of finely
ground dried sample was heated in an open platinum crucible.
Results and discussion
Thermal data and chemical characterization
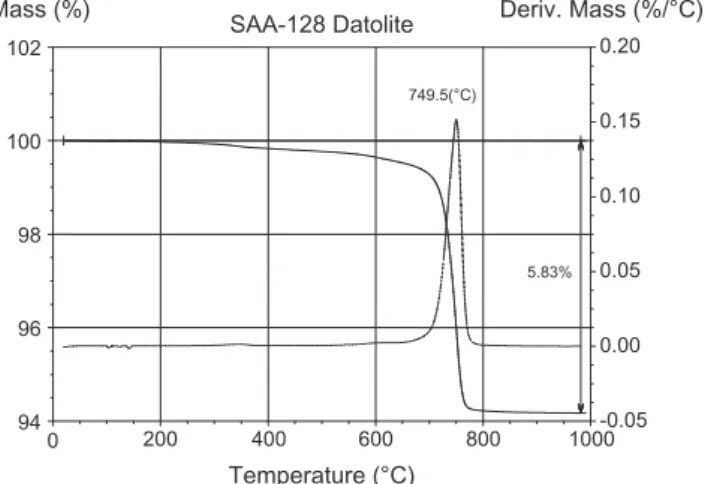
Differential thermal analysis (DTA) and thermogravimetric (TG) and DTG measurements were carried out simultaneously. The TG curve (Fig. 1) of datolite shows a total mass loss of around 5.83% on heating. TG data indicate a mass loss in a temperature range be-tween 700°C and 775°C. The DTG curve shows one main maxima, at about 749.5°C due to loosely bound water molecules. The total mass loss of 5.83% corresponds to 1 water (H2O + F) moleculespfu.
As described by Tarney et al.[20], the thermal transformation of datolite in O2atmosphere consists in the production of a
boron-containing analogue of the melilite structure, composition Ca2SiB
2-O7in accordance with the following reaction:
2CaBSiO4ðOHÞ !H2OþCa2SiB2O7þSiO2
Chemical analysis
The quantitative chemical analysis of datolite is presented in
Table 1. The composition was calculated as mean values in ten spots. The range of the chemical analysis is also presented, and shows no significant variance. The analytical accuracy can be considered as 2%. The chemical formula was calculated on the basis of 5 oxygen atoms (O, OH, F) in the structure. The chemical composition indicates a pure mineral phase, with Si and Ca as the major constit-uents in addition to B calculated by stoichiometry and H2O
calcu-lated by loss of mass via thermogravimetric analysis. The total loss of mass of 5.83% is considered to be the sum of H2O (5.75%)
and F content (0.08%). The results show traces of K, Na, Al and Fe, which replaces partially Ca and Si. The chemical formula of the stud-ied sample can be expressed as: CaB1.02(Si0.98O4)(OH0.99,F0.01). The
chemical formula shows nearly ideal composition. The F content is not significant.
Spectroscopy
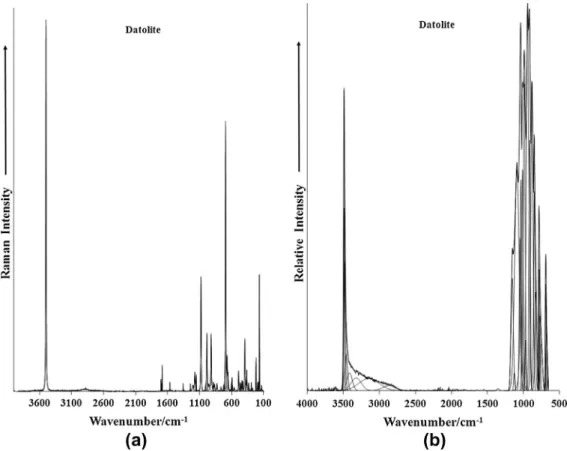
The Raman spectrum of datolite in the 100–4000 cm1spectral
range is reported inFig. 2a. This spectrum illustrates the relative intensity of the bands and their band positions. Large parts of the spectrum show little or no intensity and the spectrum is therefore, subdivided into sections based upon the types of vibration being observed. Likewise, the infrared spectrum shown inFig. 2b is sub-divided into sections.
The Raman spectrum of datolite in the 800–1400 cm1spectral
region is reported inFig. 3a. Sharp intense Raman bands are ob-served. The Raman band at 917 cm1is assigned to the BO
sym-metric stretching mode of boron in the tetrahedral structure,
whereas the Raman band at 985 cm1 is attributed to the BO
antisymmetric stretching mode. The intense Raman band at 1077 cm1is assigned to the SiO stretching vibration of tetrahedral
silicon in the datolite environment. The series of bands at 1148, 1154, 1172, 1202 and 1243 cm1are associated with the SiO
anti-symmetric stretching modes. An alternative description may be in terms of BOH in-plane bending modes, the band position of which is expected to be in the 1000–1300 cm1spectral range. It is noted
that some density functional calculations have been undertaken
[21]. However, whenever OH units and/or water units are involved in the structure then DFT calculations have proven very difficult. The problem resides with the exact position of the hydrogen atom. In comparison with the Raman spectrum, the infrared spectrum in the 500–1300 spectral range is illustrated inFig. 3b. The IR spec-tral profile is complex to say the least, with a number of overlap-ping component bands. The spectrum consists of overlapoverlap-ping bands which are attributed to the BO and SiO symmetric and anti-symmetric stretching modes. The infrared bands centered upon 782 cm1with shoulder bands at 750, 771 and 789 cm1are due
to BOH out of plane bending modes. Ross in Farmer’s treatise tab-ulated the spectral range of various vibrational modes (Table 1VIII)
[22]. Ross defined the spectra regions for various bands for trigonal and tetrahedral boron. As Ross rightly points out the spectra of bo-rate minerals depends heavily on the possible anions in the
min-eral [22]. The coordination polyhedron around the boron atom
will be either a triangle or a tetrahedron. In the case of datolite, the structure consists of linked borate triangles and tetrahedra. Thus for datolite the vibrational spectra of both structural units will be observed. The spectra of datolite are complex especially in the infrared spectrum. This is caused by the observation of bands due to four different coordination polyhedra namely BO3
3 , B(OH)3,
BO5
4 , and B(OH)4. In the case of datolite, the recurring unit is
BO3(OH).
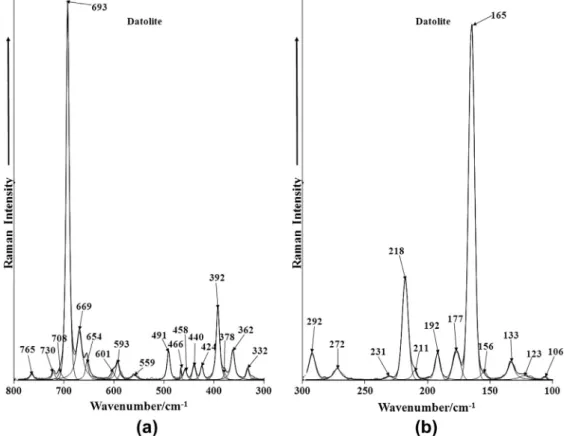
The Raman spectra of datolite in the 300–800 cm1 spectral
range and in the 100–300 cm1 spectral range are shown in
Fig. 4a and b. The first spectrum is dominated by an intense Raman
band at 693 cm1. This band is ascribed to the BO symmetric
stretching mode of tetrahedral boron. A second Raman band is observed at 669 cm1 which is also assigned to this band. The
Raman band at 392 cm1is attributed to CaO stretching vibration.
A number of bands are observed in the far low wavenumber region. An intense band is found at 165 cm1. One possible assignment is
to OCaO bending modes.
The Raman spectrum of datolite in the 2600–3800 cm1
spec-tral range is shown inFig. 5a and the infrared spectrum over the 2600–3600 cm1 spectral range is given in Fig. 5b. The Raman
spectrum displays a single sharp band at 3498 cm1. This band is
assigned to the stretching vibration of the datolite OH units. The
infrared spectrum displays a sharp band at 3491 cm1 with a
shoulder band at 3484 cm1. The infrared spectrum has a long tail
5.83% -0.05 0.00 0.05 0.10 0.15 0.20
Deriv. Mass (%/°C)
94 96 98 100 102 Mass (%)
0 200 400 600 800 1000
Temperature (°C) SAA-128 Datolite
749.5(°C)
Fig. 1.TG/DTG pattern of datolite.
Table 1
Chemical composition of datolite Canossa, Reggio Emilia, Italy (mean of 10 electron microprobe analyses). B2O3calculated by stoichiometry and H2O calculated by mass loss via thermogravimetric analysis.
Constituent wt.% Range (wt.%) Number of atoms Probe standard/crystal
SiO2 36.17 35.02–36.69 0.98 Quartz/PETJ
CaO 34.46 34.05–35.05 1.00 Anortite/PETJ
B2O3 21.76 Calculated by stoichiometry 1.02
K2O 0.01 0.00–0.02 0.00 Microcline/PETJ
Na2O 0.01 0.00–0.04 0.00 Jadeite/TAP
Al2O3 0.02 0.01–0.04 0.00 Al2O3/TAP
FeO 0.02 0.00–0.08 0.00 Siderite/LIF
H2O 5.75 Calculated by mass loss (TG) 0.99
F 0.08 0.00–0.24 0.01 CaF2/TAP
Fig. 2.(a) Raman spectrum of datolite over the 100–4000 cm1spectral range and (b) Infrared spectrum of datolite over the 500–4000 cm1spectral range.
Fig. 4.(a) Raman spectrum of datolite over the 300–800 cm1spectral range and (b) Raman spectrum of datolite over the 100–300 cm1spectral range.
and bands may be resolved at 2867, 3147, 3325, 3417 and 3463 cm1. It is interesting to compare the Raman spectrum of
dat-olite with that of ameghinite NaB3O3(OH)4. Raman bands for
ameghinite are observed at 3203, 3249 and 3385 cm1. These
bands are assigned to the symmetric stretching vibrations of the OH units. For datolite, the hydrogen bonds are bifurcated. This bir-furcation contributes to the complexity of the spectrum in the OH stretching region.
Conclusions
The mineral datolite CaBSiO4(OH) is an important mineral as it
is used to make glass for the uptake of radioactive nuclides and is useful for the disposal of radioactive waste. As such it is important to know the thermal stability of the mineral. The mineral decom-poses at 749.5°C with a mass loss of 5.83%. This mass loss corre-sponds to 1 water molecule per formula unit.
The chemical reaction is 2CaBSiO4ðOHÞ !H2OþCa2SiB2O7þSiO2
The quantitative chemical analysis determined by EMP/WDS shows a relatively simple composition and no significant substitu-tions were observed. The chemical formula can be expressed as CaB1.02(Si0.98O4)(OH0.99,F0.01). We have studied the mineral datolite
using vibrational spectroscopy and the spectra reflect the structure of datolite which is based on sheets of four- and eight-membered rings of alternating SiO4and BO3(OH) tetrahedra with the sheets
bonded together by calcium atoms. Raman and infrared bands of the borate and silicate tetrahedra are observed. A very intense Ra-man band at 3498 cm1is assigned to the OH stretching vibration
of the OH units.
Acknowledgements
The financial and infra-structure support of the Discipline of Nanotechnology and Molecular Science, Science and Engineering Faculty of the Queensland University of Technology, is gratefully acknowledged. The Australian Research Council (ARC) is thanked for funding the instrumentation. The authors would like to
acknowledge the Center of Microscopy at the Universidade Federal de Minas Gerais (http://www.microscopia.ufmg.br) for providing the equipment and technical support for experiments involving electron microscopy. R. Scholz offers thanks to FAPEMIG – Fun-dação de Amparo à Pesquisa do estado de Minas Gerais (Grant No. CRA – APQ-03998-10).
Appendix A. Supplementary material
Supplementary data associated with this article can be found, in the online version, athttp://dx.doi.org/10.1016/j.saa.2013.06.012.
References
[1]I.A. Sobolev, F.A. Lifanov, S.V. Stefanovskii, S.A. Dmitriev, N.D. Musatov, A.P. Kobelev, N.V. Zakharenko, Sov. Atom. Energy 69 (1991) 848–852.
[2]B.P. Tarasevich, L.B. Isaeva, E.V. Kuznetsov, I.A. Zhenzhurist, Glass Ceram. 47 (1991) 175–178.
[3]L.P. Konerskaya, R.G. Orlova, E.P. Bogdanis, V.D. Konerski, N.P. Guseva, Glass Ceram. 45 (1988) 199–201.
[4]E. Medvedovski, Int. Ceram. Rev. 45 (1996) 82–86.
[5]T.A. Sheveleva, A.D. Verkhoturov, S.V. Nikolenko, G.P. Komarova, V.V. Podlesov, A.M. Stolin, T.N. Shishkina, M.V. Inadze, Elektron. Obrab. Mater. 1 (1991) 26– 30.
[6]V.I. Il’in, Ogneup. Tekhniche. Keram. 9 (2003) 31–32.
[7]V.L. Zhuk, S.V. Timoofeeva, A.M. Kondratyuk, V.G. Osipov, V.V. Akulov, I.I. Bornatskii, Metallurgist 31 (1987) 88–89.
[8]Y.R. Vasil’ev, O.N. Laguta, V.G. Pavlov, A.Y. Shevko, Dokl. Akad. Nauk. 348 (1996) 644–646.
[9]M.H. Klaproth, J. Chem. 6 (1806) 107–110. [10] T. Ito, H. Mori, Acta Cryst. 6 (1953) 24–32.
[11]F.F. Foit Jr., M.W. Phillips, G.V. Gibbs, Am. Mineral. 58 (1973) 909–914. [12]Y.V. Ivanov, E.L. Belokoneva, Acta Cryst. B63 (2007) 49–55.
[13]R. Li, Z. Li, M. Mao, Y. Pan, Phys. Chem. Min. 38 (2011) 33–43.
[14]N. Perchiazzi, A.F. Gualtieri, S. Merlino, A.R. Kampf, Am. Mineral. 89 (2004) 767–776.
[15]M.E. Back, J.A. Mandarino, Min. Rec. (2008).
[16]F. Zaccarini, S. Morales-Ruano, M. Scacchetti, G. Garuti, K. Heide, Chemie Der Erde – Geochem. 68 (2008) 265–277.
[17]J.G.D. Tanago, A.L. Iglesia, Estud. Geol. 54 (1998) 181–190. [18]F. Pezzotta, V. Diella, A. Guastoni, Am. Mineral. 84 (1999) 782–789. [19]K. Taira, H. Wada, Geosci. Rep. Shizouka Univ. 26 (1999) 39–49. [20] J. Tarney, A.W. Nicol, G.F. Marriner, Mineral. Mag. 39 (1973) 158–175. [21]M.R. Hansen, G.K.H. Madsen, H.J. Jakobsen, J. Skibsted, J. Phys. Chem. A109
(2005) 1989–1997.