A vibrational spectroscopic study of the phosphate mineral
zanazziite – Ca
2
(MgFe
2+
)(MgFe
2+
Al)
4
Be
4
(PO
4
)
6
6(H
2
O)
Ray L. Frost
a,⇑, Yunfei Xi
a, Ricardo Scholz
b, Fernanda M. Belotti
c, Luiz Alberto Dias Menezes Filho
daSchool of Chemistry, Physics and Mechanical Engineering, Science and Engineering Faculty, Queensland University of Technology, GPO Box 2434, Brisbane Queensland 4001, Australia bGeology Department, School of Mines, Federal University of Ouro Preto, Campus Morro do Cruzeiro, Ouro Preto, MG 35400-00, Brazil
cFederal University of Itajubá, Campus Itabira, Itabira, MG 35903-087, Brazil
dGeology Department, Institute of Geosciences, Federal University of Minas Gerais, Belo Horizonte, MG 31270-901, Brazil
h i g h l i g h t s
"We have analyzed the phosphate mineral zanazziite and determined its formula.
"The mineral was studied by electron microprobe, Raman and infrared spectroscopy.
"Multiple bands in the bending region supports the concept of a reduction in symmetry of phosphate anion.
g r a p h i c a l
a b s t r a c t
a r t i c l e
i n f o
Article history:
Received 13 August 2012 Accepted 5 November 2012 Available online 5 December 2012
Keywords:
Raman spectroscopy Infrared spectroscopy Zanazziite
Roscherite group Greinfeinstenite Phosphate
a b s t r a c t
Zanazziite is the magnesium member of a complex beryllium calcium phosphate mineral group named roscherite. The studied samples were collected from the Ponte do Piauí mine, located in Itinga, Minas Ger-ais. The mineral was studied by electron microprobe, Raman and infrared spectroscopy. The chemical for-mula can be expressed as Ca2.00(Mg3.15,Fe0.78,Mn0.16,Zn0.01,Al0.26,Ca0.14)Be4.00(PO4)6.09(OH)4.005.69(H2O) and shows an intermediate member of the zanazziite–greinfeinstenite series, with predominance of zan-azziite member.
The molecular structure of the mineral zanazziite has been determined using a combination of Raman and infrared spectroscopy. A very intense Raman band at 970 cm 1is assigned to the phosphate symmet-ric stretching mode whilst the Raman bands at 1007, 1047, 1064 and 1096 cm 1are attributed to the phosphate antisymmetric stretching mode. The infrared spectrum is broad and the antisymmetric stretching bands are prominent. Raman bands at 559, 568, 589 cm 1are assigned to them
4out of plane bending modes of the PO4and HPO4units. The observation of multiple bands supports the concept that the symmetry of the phosphate unit in the zanazziite structure is reduced in symmetry. Raman bands at 3437 and 3447 cm 1are attributed to the OH stretching vibrations; Raman bands at 3098 and 3256 are attributed to water stretching vibrations. The width and complexity of the infrared spectral profile in con-trast to the well resolved Raman spectra, proves that the pegmatitic phosphates are better studied with Raman spectroscopy.
Ó2012 Elsevier B.V. All rights reserved.
Introduction
Zanazziite is a calcium and magnesium beryllium hydrated phosphate mineral from the rosherite group. Zanazziite arises as barrel-shaped crystals and can reach up to 4 mm. It grows along
1386-1425/$ - see front matterÓ2012 Elsevier B.V. All rights reserved.
http://dx.doi.org/10.1016/j.saa.2012.11.017
⇑Corresponding author. Tel.: +61 7 3138 2407; fax: +61 7 3138 1804.
E-mail address:[email protected](R.L. Frost).
Contents lists available atSciVerse ScienceDirect
Spectrochimica Acta Part A: Molecular and
Biomolecular Spectroscopy
side quartz or in association with others secondary phosphate min-erals, including eosphorite–childrenite, montebrasite, beryllonite, fluorapatite and brazilianite. It was first found in miarolitic cavities in the granitic pegmatite named Lavra da Ilha, near Taquaral, municipality of Itinga, in northeastern Minas Gerais, Brazil. Zanazziite is named after Dr. Pier F. Zanazzi. Zanazziite has an ideal chemical formula of Ca2Mg5Be4(PO4)6(OH)46H2O[1].
Zanazziite is one of the members of the roscherite group, which is a complex group of calcium and beryllium phosphates of general formula: Ca2(M1)2(M2)4Be4(PO4)6(OH)4X24H2O; where M1and M2
are octahedral sites. M1is occupied by Mg, Mn2+, Fe2+, Fe3+, Zn, and Al, however the Al dominant member is unknown. The M1can be also partially vacant. The M2 sites are essentially vacant, their common occupancy usually being 1/3–1/2 per formula unit. X = OH or H2O. In addition to zanazziite, others minerals in rosche-rite group are namely atencioite, footemineite, greinfenstenite, guimarãesite, roscherite and ruifrancoite[2]. Due to the complex-ity of the roscherite group, Rastsvetaeva et al. (2005) general formula as Ca2M5Be4(PO4)6(OH)4n(H2O), where M is occupied by
Mn, Fe, Zn, Mg and Al andn6.
Zanazzite belongs to the monoclinic crystal system, space group C2/c[3–5]. The unit cell parameters are:a= 15.876 ÅA0,b= 11.860 ÅA0, c= 6.607 ÅA0, and b= 95.49°. The axial ratio of zanazziite is a= 1.3391,b= 1 andc= 0.5571. There is uncertainty in analyzing zanazziites distribution of cations on M1and M2sites. The M2site in zanazziite is indistinct; it contains two Me–O bond distances, and two Me–OH bond distances. In X-ray scattering and diffraction models the data presents an approximation of the number of electrons in each atomic site, giving 17.3 e in the M2 site and 64.8 e in the M1site. The crystals in zanazziite are prismatic to bladed, usually rough, barrel-shaped, with indices {100}, {11 0} and {0 0 1}. Cleavages are on {1 00} good, and {0 1 0} distinct.
Characterization of beryllium mineral paragenesis is an impor-tant tool in the petrogenetic study of granitic and alkaline pegma-tites [6]. Be metal is an important element in industry with different applications in metallurgy, especially in the production of copper, aluminum and magnesium alloys. Due to its stiffness, light weight and dimensional stability over a wide temperature range beryllium has also importance for the defense and aerospace industry. Beryllium is also a hazardous element and is responsible to development of chronic beryllium disease (CBD)[7,8], arousing interest in the environmental sciences.
Be phosphates are relatively rare in nature and are related to the hydrothermal and supergene process in granitic pegmatites [9]. A number of 26 phosphate minerals are known in nature and approved by the International Mineralogical Association. Cˇerny´ [10] and Cˇerná et al. [11] described beryllium phosphates as secondary product of latte alteration of beryl. In recent years, spec-troscopic studies concerning phosphate minerals are increasing, especially due to their industrial and technological importance; however, only near-infrared vibrational spectroscopic data are available on zanazziite[12].
Farmer [13] divided the vibrational spectra of phosphates according to the presence, or absence of water and hydroxyl units in the minerals. In aqueous systems, Raman spectra of phosphate oxyanions show a symmetric stretching mode (
m
1) at 938 cm 1, the antisymmetric stretching mode (m
3) at 1017 cm 1, the sym-metric bending mode (m
2) at 420 cm 1 and them
4 mode at 567 cm 1 [14–16]. The value for the
m
1 symmetric stretching vibration of PO4 units as determined by infrared spectroscopy was given as 930 cm 1(augelite), 940 cm 1(wavellite), 970 cm 1 (rockbridgeite), 995 cm 1 (dufrenite) and 965 cm 1 (beraunite). The position of the symmetric stretching vibration is mineral dependent and a function of the cation and crystal structure. The fact that the symmetric stretching mode is observed in the infrared spectrum affirms a reduction in symmetry of the PO4units.
The value for the
m
2symmetric bending vibration of PO4units as determined by infrared spectroscopy was given as 438 cm 1 (aug-elite), 452 cm 1 (wavellite), 440 and 415 cm 1 (rockbridgeite), 455, 435 and 415 cm 1(dufrenite) and 470 and 450 cm 1 (bera-unite). The observation of multiple bending modes provides an indication of symmetry reduction of the PO4units. This symmetry reduction is also observed through them
3antisymmetric stretching vibrations. Augelite shows infrared bands at 1205, 1155, 1079 and 1015 cm 1; wavellite at 1145, 1102, 1062 and 1025 cm 1; rock-bridgeite at 1145, 1060 and 1030 cm 1; dufrenite at 1135, 1070 and 1032 cm 1; and beraunite at 1150, 1100, 1076 and 1035 cm 1. In the infrared study of triploidite, a basic manganese phosphate, Farmer reports the infrared spectrum with the (m
1) at 957 cm 1, (m
3) at 1090, 1058, 1030 and 1010 cm 1, (m
2) at 420 cm 1and them
4mode at 595, 570, 486 cm 1[12]. A hydroxyl stretching frequency of 3509 cm 1was given. In the spectroscopic study of strengite, in the region below to 400 cm 1, Frost and We-ier[17]described the metal stretching vibrations for MnO and also the OMnO bending modes.
In this work, samples of a pure, monomineral zanazziite from the Ponte do Piauí pegmatite, located in the municipality of Itinga, Minas Gerais, Brazil has been carried out. Studies include chemis-try via electron microprobe analysis in the WDS mode (EMP), spec-troscopic characterization of the structure with infrared and Raman spectroscopy.
Geological setting, occurrence and general appearance
The studied samples were collected from the Ponte do Piauí mine, located in the Piauí valley, municipality of Itinga. The region is well-known as an important source of rare phosphates and gem-ological minerals. The pegmatite is located in the Araçuaí pegma-tite district, one of the subdivisions of the Eastern Brazilian Pegmatite province (EBP)[18]. The Araçuaí pegmatite district cov-ers an area of about 10,000 km2, in the northern region of Minas Gerais, in the Jequitinhonha River basin, about 560 km north of Belo Horizonte.
The Ponte do Piauí is mined for gemstones and samples for the collectors market. The pegmatite is heterogeneous with well-developed mineralogical and textural zoning. The pegmatite is hosted by cordierite–biotite-quartz schists with minor intercala-tions of calcsilicate rocks of the Salinas Formation. Tourmaliniza-tion is observed in the contact between the pegmatite and the host rock. Hydrothermal and metasomatic fluids were responsible for the development of miarolitic cavities. Primary phosphates were not observed.
The primary mineral association is represented by quartz, muscovite, microcline, schorl and almandine–spessartine. The sec-ondary association is mainly composed by albite, Li bearing micas, cassiterite, elbaite and hydrothermal rose quartz. In the Ponte do Piauí pegmatite, secondary phosphates, namely eosphorite, fluor-apatite, zanazziite, occur in miarolitic cavities in association with albite, quartz and muscovite. Zanazziite grows usually along the surface of quartz and albite.
Experimental
Samples description and preparation
The mine is located in Itinga, north of Minas Gerais. To remove contaminated phases, with the support of a Stereomicroscope Leica Model EZ4, zanazziite crystals were hand selected from a sample in association with eosphorite (Fig. 1). The zanazziite crystal aggre-gates were phase analyzed by X-ray powder diffraction and scan-ning electron microscopy in the EDS mode (SEM/EDS).
Electron microprobe analysis (EMP)
A quantitative chemical analysis was carried via EMP. Two zan-azziite crystals of the same aggregate selected for this study were analyzed. The chemical formula was calculated with medium val-ues obtained in the two crystals.
The chemical analysis was carried out with a Jeol JXA8900R spectrometer from the Physics Department of the Federal Univer-sity of Minas Gerais, Belo Horizonte. For each selected element was used the following standards: Fe and Mg – olivine, Mn – rodh-onite, P and Ca – Apatite Artimex, Al – Corundum, and Zn – ZnS. Beryllium and H2O were calculated by stoichiometry. The epoxy embedded zanazziite samples were polished in the sequence of 9
l
m, 6l
m and 1l
m diamond paste MetaDIÒII Diamond Paste – Buhler, using water as a lubricant, with a semi-automatic MiniMetÒ 1000 Grinder–Polisher – Buehler. Finally, the epoxyembedded zanazziite was coated with a thin layer of evaporated carbon. The electron probe microanalysis in the WDS (wavelength dispersive spectrometer) mode was obtained at 15 kV accelerating voltage and beam current of 10 nA. Chemical formula was calculated on the basis of 34 atoms (O, OH, H2O).
Thermogravimetric analysis – TG/DTG
Thermogravimetric analysis of the reddingite mineral were ob-tained by using TA Instruments Inc. Q500 high- resolution TGA operating at a 5°C/min ramp with 6.0°C resolution from room
temperature to 1000°C in a high-purity flowing nitrogen atmo-sphere (40 cm3/min). Approximately 22 mg of finely ground dried sample was heated in an open platinum crucible. The result of the thermal analysis is given in the supplementary information.
Raman microprobe spectroscopy
Fragments of the zanazziite sample were placed on a polished metal surface on the stage of an Olympus BHSM microscope, which is equipped with 10, 20, and 50objectives. The microscope is
part of a Renishaw 1000 Raman microscope system, which also in-cludes a monochromator, a filter system and a CCD detector (1024 pixels). The Raman spectra were excited by a Spectra-Physics model 127 He–Ne laser producing highly polarized light at 633 nm and collected at a nominal resolution of 2 cm 1and a precision of ±1 cm 1in the range between 200 and 4000 cm 1. Re-peated acquisitions on the crystals using the highest magnification (50) were accumulated to improve the signal to noise ratio of the
spectra. The spectra were collected over night. Raman Spectra were calibrated using the 520.5 cm 1line of a silicon wafer. The Raman spectrum of at least 10 fragments was collected to ensure the consistency of the spectra.
Infrared spectroscopy
Infrared spectra were obtained using a Nicolet Nexus 870 FTIR spectrometer with a smart endurance single bounce diamond ATR cell. Spectra over the 4000–525 cm 1 range were obtained by the co-addition of 128 scans with a resolution of 4 cm 1and a mirror velocity of 0.6329 cm/s. Spectra were co-added to improve the signal to noise ratio. The infrared spectra are given in the sup-plementary information.
Spectral manipulation such as baseline correction/adjustment and smoothing were performed using the Spectracalc software package GRAMS (Galactic Industries Corporation, NH, USA). Band component analysis was undertaken using the Jandel ‘Peakfit’ soft-ware package that enabled the type of fitting function to be se-lected and allows specific parameters to be fixed or varied accordingly. Band fitting was done using a Lorentzian–Gaussian cross-product function with the minimum number of component bands used for the fitting process. The Gaussian–Lorentzian ratio was maintained at values greater than 0.7 and fitting was under-taken until reproducible results were obtained with squared corre-lations ofr2greater than 0.995.
Results and discussion
Chemical characterization
The quantitative chemical analysis of samples is presented in Table 1. Composition is the result of medium values of
Fig. 1.Aggregate of zanazziite and eosphorite from Ponte do Piauí mine.
Table 1
Chemical composition of zanazziite from Ponte do Piauí pegmatite (mean of chemical analysis of 2 crystals). H2O measured by mass loss and Be calculated by stoichiometry.
Constituent wt.% Number of cations Range (wt.%) Probe standard
CaO 10.26 2.14 11.25–11.27 Apatite
MgO 11.82 3.15 11.67–11.96 Olivine
FeO 5.27 0.78 5.08–5.47 Olivine
MnO 1.07 0.16 1.05–1.09 Rodhonite
ZnO 0.04 0.01 0.00–0.07 ZnS
BeO 10.30 4.00 Calculated by stoichiometry
Al2O3 2.53 0.26 2.46–2.60 Corundum
P2O5 40.58 6.09 39.99–41.18 Apatite
H2O (total) 13.00 7.69 OH – 4.00 Measured by mass loss
H2O – 5.69
measurements in 2 crystals. H2OH2O content was measured by
mass loss (ML) observed in the TG curve. The beryllium contents was calculated by stoichiometry according to the
zanazziite–greinfeinstenite series and the chemical formula was calculated on the basis of 34 oxygen atoms (O, OH, H2O) on the structure. The chemical composition indicates an intermediate
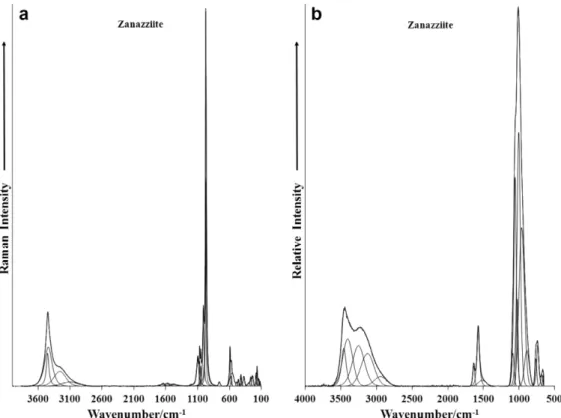
Fig. 2.(a) Raman spectrum of zanazziite over the 100–4000 cm 1spectral range. (b) Infrared spectrum of zanazziite over the 500–4000 cm 1spectral range.
member of the zanazziite–greinfeinstenite series with predomi-nance of zanazziite in relation to the greinfeinstenite end member. Impurities of Mn, Zn and Al were also measured.
The measured Ca amount is higher than the calculated value for the zanazziite–greifeinstenite series, and suggest the presence of Ca in the M site.
Fig. 4.(a) Raman spectrum of zanazziite over the 300–800 cm 1spectral range. (b) Raman spectrum of zanazziite over the 100–300 cm 1spectral range.
Chemical formula can be expressed as:
Ca2.00(Mg3.15,Fe0.78,Mn0.16,Zn0.01,Al0.26,Ca0.14)Be4.00(PO4)6.09 (OH)4.005.69(H2O)
The total occupancy of the M site is 4.5 atoms. In comparison to the general formula where M site is occupied by 5 atoms, the dif-ference can be considered due to vacancy[3].
Spectroscopy
The Raman spectrum of zanazziite in the 100–4000 cm 1 spec-tral range is illustrated in Fig. 2a. This spectrum displays the position and relative intensity of the Raman bands. It is noted and spectral intensity in the 2600–4000 cm 1 spectral region is minimal. It is noted that there are large parts of the spectrum where no intensity is observed. Thus, the spectrum is divided into sections according to the type of vibration being observed. The most intense bands are observed in the phosphate stretching region around 1000 cm 1. Significant intensity is found in the hy-droxyl stretching region. The infrared spectrum of zanazziite over the 500–4000 cm 1spectral range is shown inFig. 2b. This figure records the position and relative intensity of the infrared bands. Some strong intensity in the OH stretching region is now observed. The Raman spectrum of zanazziite in the 800–1400 cm 1 spec-tral region is reported inFig. 3a. This spectral region is the region of the phosphate stretching vibrations. The most intense band is observed at 964 and 970 cm 1. This band is attributed to the
m
1PO34 symmetric stretching vibration. Other Raman bands are ob-served at 1007, 1047, 1064 and 1096 cm 1and are assigned to the
m
3PO34 antisymmetric stretching vibration. The infrared spectrum of zanazziite is reported inFig. 3b. An intense infrared spectrum is observed. The complex spectral profile may be resolved into component bands with bands resolved at 961, 1004, 1024, 1055 and 1086 cm 1. The infrared band at 1004 is probably the
m
3PO34 symmetric stretching vibration. The latter three bands are assigned to the
m
3PO34 antisymmetric stretching vibration.
Infrared bands in the 600–800 cm 1spectral region (Fig. 3b) are attributed to hydroxyl deformation modes. This band is also ob-served in the Raman spectrum at 756 cm 1(Fig. 4a). The Raman spectrum of zanazziite in the 300–800 cm 1spectral range is re-ported inFig. 4a. This part of the Raman spectrum may be divided into three regions: (a) bands in the 550–650 cm 1spectral region (b) bands centered around 455 cm 1and (c) bands in the 300– 380 cm 1 spectral range. The first group of bands at 559, 568, 589 cm 1are assigned to the
m
4 out of plane bending modes of the PO4and HPO4units. The Raman spectrum of NaH2PO4shows Raman bands at 526, 546 and 618 cm 1. The observation of multi-ple bands in this spectral region supports the concept of symmetry reduction of both the phosphate units. The second group of bands at 404, 419, 457 and 483 cm 1are attributed to the
m
2 PO4 and HPO4 bending modes. The Raman spectrum of NaH2PO4 shows two Raman bands at 460 and 482 cm 1. The observation of multi-ple Raman bands for the zanazziite mineral supports the concept of symmetry reduction. The third group of bands at 236, 264 and 294 cm 1are attributed to metal–oxygen vibrations.
The Raman spectrum over the 2600–3800 cm 1spectral range is displayed inFig. 5a and the infrared spectrum in the same spectral region inFig. 5b. In the Raman spectrum, bands are observed at 3098, 3256, 3437 and 3447 cm 1. The bands at 3437 and 3447 cm 1 are attributed to the OH stretching vibrations of the OH units in the zanazziite structure. The first two Raman bands are assigned to water stretching modes. The infrared spectrum shows a series of overlapping bands. As for the analysis of the Raman spectrum, the two bands at 3406 and 3461 cm 1are assigned to the stretching vibrations of OH units and the two infrared bands at 3128 and 3255 cm 1are attributed to water stretching vibrations.
Interpretation of the spectra in the OH stretching region is con-firmed by the study of the bands in the 1300–1800 cm 1spectral region as is shown inFig. 6a and b. The Raman spectrum suffers from a lack of signal; nevertheless, three bands may be observed at 1466, 1569 and 1644 cm 1. This latter band is attributed to
the water bending mode and its position indicates that water is in-volved in strong hydrogen bonding. The position of the water bending mode is normally around 1625 cm 1as in liquid water. Strong water hydrogen bonding gives water bending bands in the order of 1650 cm 1. The Raman spectrum is in harmony with the infrared spectrum (Fig. 6b), where infrared bands are found at 1572 and 1636 cm 1. This latter band is assigned to the water bending mode. The band at 1572 cm 1(infrared) and 1569 cm 1 (Raman) is thought to be due to a hydroxyl deformation mode.
Conclusions
Zanazziite – Ca2(Mn, Fe2+)(Mg,Fe2+,Al)4Be4(PO4)6(OH)4
6(H2O)
was studied by electron microprobe in the WDS mode, Raman and infrared spectroscopy. The chemical characterization by elec-tron microprobe shows an intermediate member in the series zan-azziite–greinfeinstenite, with predominance of the zanazziite member. The mineral occurs in association with other secondary phosphates such as eosphorite in miarolitic cavities of granitic peg-matites. Chemical formula calculated on the basis of 34 oxygen atoms (O, OH, H2O) can be expressed as:
Ca2.00(Mg3.15,Fe0.78,Mn0.16,Zn0.01,Al0.26,Ca0.14)Be4.00(PO4)6.09 (OH)4.005.69(H2O)
Aspects of the structure of zanazziite using vibrational spectros-copy were assessed. Raman and infrared bands associated with hydrogen phosphate and phosphate units were observed. It is apparent that all three anion types exist in the structure of zanazzi-ite and these anionic types are enhanced by the basic nature of the mineral. The proton on the water units is apparently very mobile and enables the formation of the monohydrogen and dihydrogen phosphate units. Vibrational spectroscopy enabled an assessment of the molecular structure of zanazziite to be made.
Acknowledgments
The financial and infra-structure support of the Discipline of Nanotechnology and Molecular Science, Science and Engineering
Faculty of the Queensland University of Technology, is gratefully acknowledged. The Australian Research Council (ARC) is thanked for funding the instrumentation. R. Scholz thanks to FAPEMIG – Fundação de Amparo à Pesquisa do Estado de Minas Gerais (Grant No. CRA – APQ-03998-10).
Appendix A. Supplementary material
Supplementary data associated with this article can be found, in the online version, athttp://dx.doi.org/10.1016/j.saa.2012.11.017.
References
[1] P.B. Leavens, J.S. White, J.A. Nelen, Min. Rec. 21 (1990) 413.
[2] D. Atencio, P.A. Matioli, J.B. Smith, N.V. Chukanov, J.M.V. Coutinho, R.K. Rastsvetaeva, S. Möckel, Am. Min. 93 (2008) 1.
[3] R.K. Rastsvetaeva, N.V. Chukanov, I.A. Verin, Dok. Chem. 403 (2005) 160. [4] R.K. Rastsvetaeva, O.A. Gurbanova, N.V. Chukanov, Dok. Chem. 383 (2002) 78. [5] R.K. Rastsvetaeva, K.A. Rozenberg, N.V. Chukanov, S. Moeckel, Cryst. Rep. 54
(2009) 568.
[6] B. Charoy, Eur. J. Min. 11 (1999) 135.
[7] R.T. Sawyer, L.A. Maier, L.A. Kittle, L.S. Newman, Inter. Immunopharm. 2 (2002) 249.
[8] A.B. Stefaniak, G.A. Day, M.D. Hoover, P.N. Breysse, R.C. Scripsick, Tox. Vitro 20 (2006) 82.
[9] D.M. Burr, Econ. Geol. 70 (1975) 1279. [10] P. Cˇerny´, Rev. Min. Geochem. 50 (2002) 405.
[11] I. Cˇerná, P. Cˇerny´, J.B. Selway, R. Chapman, Can. Min. 40 (2002) 1339. [12] R.L. Frost, K.L. Erickson, Spectrochim. Acta A61 (2005) 45.
[13] V.C. Farmer, Mineralogical Society Monograph 4: The Infrared Spectra of Minerals, 1974.
[14] R.L. Frost, W. Martens, P.A. Williams, J.T. Kloprogge, J. Raman Spectrosc. 34 (2003) 751.
[15] R.L. Frost, W. Martens, P.A. Williams, J.T. Kloprogge, Min. Mag. 66 (2002) 1063. [16] R.L. Frost, W.N. Martens, T. Kloprogge, P.A. Williams, Neues Jahrb. Min. (2002)
481.
[17] R.L. Frost, M.L. Weier, J. Mol. Struct. 697 (2004) 207.