Modulation of Cosmic Rays at Different Cutoff Rigidity
Rekha Agarwal1 and Rajesh K. Mishra2
1Department of Physics, Govt. Model Science College (Autonomous), Jabalpur (M.P.) 482 001, India 2Computer and IT Section, Tropical Forest Research Institute,
P.O. RFRC, Mandla Road, Jabalpur (M.P.) 482 021, India
Received on 13 September, 2007
The present work deals with the study of first three harmonics of cosmic ray intensity on geo-magnetically quiet days over the period 1981-1993 for Deep River and Inuvik neutron monitoring stations having mid and low cutoff rigidity. The amplitude of first harmonic remains high for Deep River having mid cutoff rigidity as compared to Inuvik neutron monitor having low cutoff rigidity on quiet days. The diurnal amplitude significantly decreases and phase shifts towards an earlier time during solar activity minimum years at both Deep River and Inuvik. The amplitude of second harmonic significantly enhanced during solar activity minimum as well as maximum at Deep River and remains low during solar activity maximum at Inuvik, whereas the phase shifts towards an earlier time during solar maximum for both the stations. The amplitude of the third harmonic significantly enhanced during solar activity minimum at Deep River and on solar activity minimum at Inuvik, whereas the phase does not show any significant characteristics and fluctuates quite frequently. The amplitude of semi/tri-diurnal anisotropy has a good positive correlation, while the others (i.e. amplitude and phase) have very weak correlation with solar wind velocity on quiet days at Deep River station during 1981-1993. The solar wind velocity significantly remains in the range 350 to 425 km/s i.e. being nearly average on quiet days. The amplitude and direction of the anisotropy on quiet days are weakly dependent on high-speed solar wind streams for two neutron monitoring station of mid and low cutoff rigidity threshold. The amplitude as well as direction of second harmonic has a good anti-correlation with IMF Bz and the product V x Bz on quiet days at Deep River station. However, the direction of second and third harmonic has a good anti-correlation with IMF Bz and the product V x Bz on quiet days at Inuvik station.
Keywords: Cosmic ray; Quiet days; Diurnal; Semi-diurnal anisotropy; Solar wind; Interplanetary magnetic field and geo-magnetic activity
I. INTRODUCTION
Cosmic ray anisotropic variations and their characteristics are studied through the diurnal and semi-diurnal components mainly and the level of the isotropic intensity collectively pro-vides fingerprint for identifying the modulating process and the electromagnetic state of interplanetary space in the neigh-borhood of the Earth. Many workers have attempted to derive relationship between the mean daily variation and the level of solar and geomagnetic activity (Venkatesan and Badruddin, 1990). Yearly average values of the first harmonic of solar daily variation experience strong changes from year to year and with the cycle of solar activity. Amplitude and phase of diurnal anisotropy is changed with the solar activity cycles (Ahluwalia and Fikani, 1997; El-Borieet al., 1995; Sikripin and Mamrukova, 1993). Lockwood and Webber (1984) found a close relationship between the magnitude and frequency of Forbush decreases and the eleven-year cosmic ray variation. They concluded that the effect of Forbush and other transient decreases is a dominant factor in the long-term intensity mod-ulation. Forbush (1979) showed that annual means of the CR diurnal anisotropy resulted from the addition of two distinct components. One, W has its maximum in the asymptotic di-rection of 128 ˚ E of the Sun and is well approximated by a wave W with a period of two solar cycles and the other component V has its maximum in the asymptotic direction 90 ˚ E of the Sun. Ahluwalia (1988) has reported that diur-nal anisotropy is unidirectiodiur-nal during 1957-70 with direction along 1800 Hr LT (East-West) and during 1971-79 it consists
of two components; one is in the East-West direction and the other is the radial component with direction along 1200 Hr LT. Sabbah (1998) characterized the diurnal anisotropy by two components. Only one anisotropy is dominant during each magnetic state of the solar cycle. The direction of the domi-nant anisotropy vector points towards the 1800 Hr LT direc-tion during the negative state of the solar cycle and toward earlier hours during the positive state. Ballif et al. (1969) correlated Kp and Ap with the mean fluctuations in ampli-tude of IMF, which in turn is related to diffusive component of convection-diffusion theory. Ap is also found to related with solar wind velocity, which is related to the convective com-ponent of convection-diffusion theory. Agrawal (1983) and Bieber and Evenson (1997) have preferred to investigate the daily variation in cosmic ray intensity on long/short term basis performing the analysis for all days in a year; whereas, Kumar et al. (1981, 1993) have studied long/short term daily variation on geomagnetically 60 quiet days (QD). Jadhav et al. (1983) and Kumar et al. (1999) studied daily variation during days of low and high amplitude anisotropic wave trains. Sabbah (1999) calculated the diurnal variation for days with high, in-termediate and low interplanetary magnetic field (IMF) mag-nitude.
Periods of unusually large amplitude often occur in trains of several days. The average characteristics of cosmic-ray diur-nal anisotropy are adequately explained by the co-rotatiodiur-nal concept (Parker, 1964; Axford, 1965a, b). This concept sup-ports the mean diurnal amplitude in space of 0.4% along the 1800 Hr direction using the worldwide neutron monitor data. However, the observed day-to-day variation both in amplitude and time of maximum, and the abnormally large amplitudes or abnormally low amplitudes of consecutive days, cannot be explained in co-rotational terms. Moreover, the maximum in-tensity of diurnal anisotropy has not appeared in the direction of 1800 Hr, which is the nominal co-rotational phase (Mc-Craken and Rao, 1965; Rao, 1972).
The average daily variation of cosmic ray intensity gener-ally consists of diurnal variation, semi-diurnal variation and tri-diurnal variation. The amplitude of the diurnal variation at a high / middle latitude station has been found to be of the order of 0.3 to 0.4%, whereas the amplitudes of two higher harmonics is of the order of 0.02% and 0.08% respectively (Pomerantz et al., 1960). The average characteristics have also been found to vary with solar cycle, where the variation is much larger at higher energies.
A number of investigators have reported the short-term characteristics of the daily variation, where they have selected continually occurring days of high and low amplitudes of di-urnal variation (Tiwari, 1994; Agrawal et al., 1974, Tiwari, 1995). These results have pointed out significant departures in the time of maximum as well as their association with higher harmonics.
Many workers (Rao et al., 1972; Kane, 1974; Owens and Kash, 1976) used a new concept for the interpretation of the diurnal variation. McCraken et al. (1968) first suggested the extension of this new concept from the solar cosmic events to the observed diurnal variation and theoretical formulation has provided by Forman and Gleeson (1975). Several workers have attempted to find the possible origin of the ’large ampli-tude wave trains’ of cosmic ray neutron intensity to develop a suitable realistic theoretical model, which can explain the diurnal anisotropy in individual days.
Hashim and Thambyahpillai (1969) and Rao et al. (1972) have shown that the enhanced diurnal variation of large am-plitude events exhibits a maximum intensity in space around the anti-garden-hose direction (2100 Hr) and a minimum in-tensity in space around the garden-hose direction (0900 Hr). Kane (1970) and Bussoletti (1973) have noticed that quite of-ten an enhanced inof-tensity is presented along the corotational direction and it is not correlated with the garden-hose direc-tion.
The diurnal anisotropy is well understood in terms of a convective-diffusive mechanism (Forman and L.J. Gleeson, 1975). Mavromichalaki (1979) has observed that the en-hanced diurnal variation was caused by a source around 1600 Hr or by a sink at about 0400 Hr. It was pointed out that this diurnal variation by the superposition of convection and field-aligned diffusion due to an enhanced density gradient of≈8% AU−1.
II. ANALYSIS OF DATA
The amplitude and phase of the harmonics of the daily vari-ation in cosmic ray intensity are derived by Fourier Analysis (Chapmen and Bartels, 1940), by noting the hourly count-ing rate of the observed cosmic ray intensity over a period of twenty-four hours.
The Fourier analysis yields reliable measures of the am-plitude and phase on a day-to-day basis, provided the time series is reasonably stationary. However, this method can-not estimate the amplitude of the ambient anisotropy, which, for small amplitudes, contributes to large uncertainties in the Fourier coefficients.
III. HARMONIC ANALYSIS
Time dependent harmonic functionF(t)with 24 equidistant points in the interval fromt=0 tot=2πcan be expressed in terms of Fourier series
F(t) =a0+ 24
∑
N=1(ancos(nt) +bnsin(nt))
F(t) =a0+ 24
∑
N=1rncos(nt)−φn)
Wherea0 is the mean value ofF(t)for the time interval
fromt=0 to 2πandan,bnare the coefficients ofnth harmon-ics, which can be expressed as follows:
a0=
1 12
24
∑
i=1 nan= 1 12
24
∑
i=1ncosnt
bn= 1 12
24
∑
i=1nsinnt
The amplitudernand phaseφnof thenthharmonic are ex-pressed as
rn= (a2n+b2n)1/2 and
φn=tan−1an
bn
The daily variation of the cosmic ray intensity can be ade-quately represented by the superposition of first, second, third and fourth harmonics as follows:
F(t) =a1cost+b1sint+a2cos 2t+b2sin 2t+
IV. TREND CORRECTION
The daily variation in cosmic ray intensity is not strictly periodic. Thus, if the number to be analysed represents bi-hourly (or bi-hourly) means of cosmic ray intensity, the mean for hourt0(0th hour) will not, in general be the same as the
mean for hourt24 (or 24th hour) this difference on account
of secular changes, is allowed for in practice by applying a correction known as trend correction, to each of the terms.
Ify0is the value of the ordinate atx=0 (0thhour) andy12
is the value of the ordinate atx=2π(24thhour) then the trend corrected value for any hour is given by the equation
¯ yk=yk
(±δy×k) 12 Wherek=0,1,2,3, ..12
yk= uncorrected value
±δy= secular changes i.e.±δy=y12−y0
V. MODE OF ANALYSIS
The pressure corrected data (data from http://spidr.ngdc.noaa.gov/ NeutronMonitor) of Deep River (Vertical cutoff rigidity = 1.02 GV, Geog. Latitude = 46.1 ˚ N, Geog. Longitude = 282.5 ˚ E) and Inuvik (Vertical cutoff rigidity = 0.18 GV, Geog. Latitude = 68.35 ˚ N, Geog. Longitude = 226.27 ˚ E) Neutron Monitor (NM) station has been subjected to Fourier analysis for the period 1981-93 after applying the trend correction. While performing the analysis of the data all those days are discarded having more than three continuous hourly data missing.
VI. CRITERIA FOR SELECTION OF 60 QUIET DAYS
Days on which the transient magnetic variations are regu-lar and smooth are said to be magnetically quiet or calm or Q days. These are the days with low values of Ap and Kp. According to solar geophysical data (SGD) five quietest days in a month thus, 60 Q days in a year are selected. These days are called the International quiet-quiet-days or QQ days. Ku-mar et al. (KuKu-mar et al., 1993, 1998) have studied long/short term daily variation on geomagnetically 60 QD. The 60 QD are better suited for long/short term studies of daily variation. The distribution of phase and amplitude on 60 QD are more regular and some of the variations are observed more clearly (Kumar et al., 2001).
VII. RESULTS AND DISCUSSION
The study of the anisotropy of galactic cosmic-ray inten-sity is an essential tool, as it is expected to carry important information about the origin and the propagation mechanism
of the galactic cosmic rays. Numerous studies are concen-trated on the diurnal variation of cosmic ray intensity (Alania, et al., 2005; Amenomori et al., 2005; Braun et al., 2005; Koz-yarivsky etal., 2005; Moraal et al., 2005).
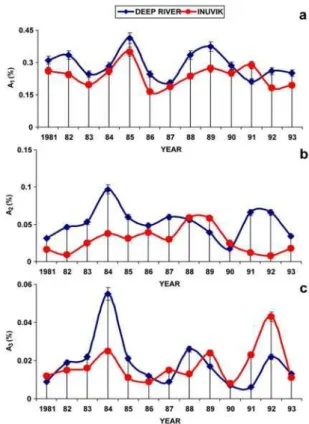
Annual average values of the amplitude of first three har-monics of daily variation in cosmic ray intensity along with statistical error bars on 60 quiet days has been plotted for two different neutron monitoring stations, Deep River with middle cut off rigidity (1.02 GV) and Inuvik with low cutoff rigidity (0.18 GV) in Fig. 1 (a, b, c). One can clearly see from the plots that the amplitude of first harmonic (A1)remains high
for Deep River as compared to Inuvik neutron monitor having low cutoff rigidity throughout the period of investigation ex-cept for the year 1991. The amplitude is found to remain low (∼0.2%) showing dips during the years 1983,1987 and 1991, whereas, remains high (∼0.4%) showing peaks during 1985 and 1989 at Deep River. The amplitude A1 remains low (∼
0.2%) showing dips during 1983, 1986 and 1992, whereas, it remains high (∼0.4%) showing peaks during 1985 and 1992 at Inuvik station. Thus the diurnal amplitudeA1significantly
decreases during 1986-87 i.e. solar activity minimum years at both Deep River and Inuvik. It is also noticed from the shape of the plots thatA1at both the stations is positively correlated
during 1981-90, whereas they are anti-correlated from 1990 onwards with each other.
FIG. 1: Average values of the amplitude (%) of first three harmonics of daily variation in cosmic ray intensity along with statistical error bars (I) on 60 QD for Deep River and Inuvik NM stations.
The semi-diurnal amplitude A2as depicted in Fig. 1b
However A2increases gradually from 1982 with some
fluctua-tions and reaches it’s maximum (0.06%) during 1988 and then decreases sharply up to 1992 at Inuvik. The semi-diurnal am-plitude A2is significantly enhanced during 1984 (solar
activ-ity minimum) and 1991-92 (solar activactiv-ity maximum) at Deep River, whereas A2significantly remains low during 1991-92
(solar activity maximum) at Inuvik. The semidiurnal ampli-tude A2is anti-correlated for the two stations during the years
1991-92 as amplitude reaches it’s maximum for one station and to minimum for the other during the same year.
The tri-diurnal amplitude A3 as depicted in Fig. 1c
in-creases sharply from 1981 and reaches it’s first maximum during 1984 at both the stations having different cutoff rigid-ity then decreases gradually and second peak occur on 1988 at Deep River and on 1989 at Inuvik. A3decreases sharply
from 1988 to 1991 then increases and reaches it’s third maxi-mum during 1992, whereas A3start increasing from 1990 and
reaches it’s third maximum on 1992 at Inuvik. The amplitude A3 significantly enhanced at Deep River during 1984 (solar
activity minimum) and at Inuvik during 1992 (solar activity maximum). It is also noticed from the shape of the plots that the amplitude A3is positively correlated with each other for
the two stations with different cut off rigidity during the pe-riod of investigation.
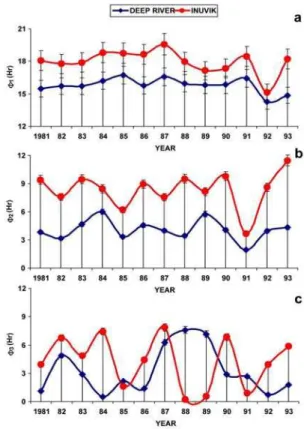
Annual average values of the time of maximum (Hr) for the first three harmonics of daily variation in cosmic ray intensity on 60 quiet days along with statistical error bars have been plotted for two different neutron monitoring stations Deep River and Inuvik in Fig. 2 (a, b, c). It is clear that the time of maximum (phase)φ1of diurnal anisotropy shifts towards
a later time at Inuvik as compared to the phase at Deep River throughout the period of investigation. φ1significantly shifts
towards an earlier time during 1992 (solar activity maximum) at both the stations. The time of maximum at both the stations seems to be positively correlated with each other during the entire period. To further confirm these trends we also calcu-lated the correlation coefficient between these two phases and we found a significant positive correlation (r = 0.77). φ1
re-mains along the corotational direction (18 Hr) at Inuvik and shifts towards earlier hours as compared to corotational direc-tion at Deep River for majority of the years.
The time of maximum of semi-diurnal anisotropyφ2
signif-icantly fluctuates during 1981-90 and signifsignif-icantly shifts to-wards an earlier time during 1991 (solar activity maximum) and then shifts towards later hours from 1992 onwards at In-uvik. The phaseφ2reaches to its maximum (∼06 Hr) during
1980 and 1989 and to its minimum (∼02 Hr) during 1991 at Deep River station. It is also noteworthy that the time of maximum significantly shifts towards an earlier time at Deep River station as compared to the time of maximum at Inuvik station throughout the period. It is also observed that the time of maximumφ2changes quite frequently from higher to lower
values at Deep River throughout the period. φ2significantly
shift towards an earlier time during 1991 (solar activity max-imum) at both the stations with different cut off rigidity. The time of maximum at both the stations seems to be positively correlated with each other during the entire period. To further confirm these trends we also calculated the correlation
coeffi-FIG. 2: Average values of the phase (Hr) of first three harmonics of daily variation in cosmic ray intensity along with statistical error bars (I) on 60 QD for Deep River and Inuvik NM stations.
cient between these two phases and we found a good positive correlation (r = 0.52).
The time of maximumφ3of tri-diurnal anisotropy reaches
to its maximum (∼07 Hr) on 1982, 1984, 1987, 1990 show-ing peaks durshow-ing these years and to its minimum durshow-ing 1985, 1988-89, 1991 showing dips during these years at Inuvik sta-tion. On the other hand the phaseφ3reaches to its maximum
et al., 1981). Changes of the solar wind velocity near the Earth may have not only local but also the global character (Sheeley et al., 1991; Richardson et al., 1999). Kondoh et al. (1999) found that the peak solar wind velocity has good anti-correlation with the high-energy galactic cosmic ray intensity. The IMF magnitude and fluctuations are responsible for the depression of cosmic ray intensity during high-speed solar wind events (Sabbah, 2000a). The IMF magnitude reaches the highest value during declining phase of solar activity (Sabbah, 1996). The correlation between cosmic ray intensity and so-lar wind velocity is statistically significant, especially in the period of the maximum solar activity. The regression coeffi-cients obtained on yearly basis depend on sunspot number and are∼-0.8 and∼-0.2 per 100 km/s at the solar maximum and minimum, respectively (Fujimoto et al., 1983). The relation of cosmic ray intensity to solar wind velocity is, in general, dependent on physical conditions in the interplanetary space varying with the solar activity. The year-to-year variation of the effect of solar wind upon cosmic ray intensity is depen-dent on solar activity and the decrement of cosmic ray inten-sity due to the variation of solar wind velocity is proportional to sunspot number (Fujimoto et al., 1983).
To find out the possible dependence of amplitude and time of maximum on solar wind and IMF, we have plotted the scat-ter diagram between amplitude/phase and solar wind velocity (V), north south component of IMF (Bz), the product (V x Bz) for the two neutron monitoring stations.
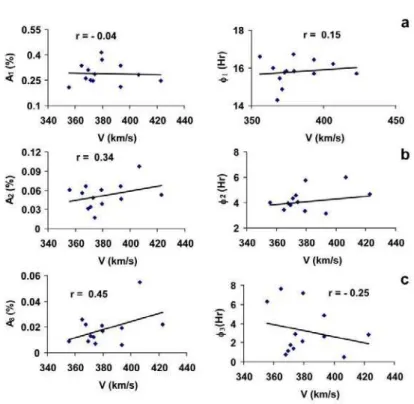
The amplitude (%) and phase (Hr) of cosmic ray diurnal/semi-diurnal/tri-diurnal anisotropy along with the variation in associated value of solar wind velocity (V) on quiet days and the regression line has been shown in Fig. 3 (a, b, c) for Deep River during 1981-93. The amplitude A1 slightly decreases as the solar wind velocity increases
and shows very weak negative correlation (r = -0.04). The phaseφ1significantly remains in a direction earlier than
co-rotational/18-Hr direction and slightly shifts to later time with the increase of solar wind velocity and shows a weak corre-lation (r = 0.15) as depicted in Fig. 3a. The amplitude A2
of semi-diurnal anisotropy increases with the increase of so-lar wind velocity and shows a good positive correlation (r = 0.34). The direction of the semi-diurnal anisotropyφ2is
ob-served to shift towards earlier hours with the decrease of solar wind velocity and shows some positive correlation (r = 0.20) as depicted in the Fig. 3b. The amplitude A3 of tri-diurnal
anisotropy on quiet days is observed to increase with the in-crease of solar wind velocity and shows positive correlation (r = 0.45). The phase φ3of the tri-diurnal anisotropy shifts
towards an earlier time with increase of V and shows some anti-correlation (r = - 0.25) with V as depicted in Fig. 3c. Thus, from the above investigations we may infer that only the amplitude of semi/tri-diurnal anisotropy have a good positive correlation, while the others (i.e. amplitude and phase) have very weak correlation with solar wind velocity on quiet days at Deep River station during 1981-1993. It is also observed from these plots that the solar wind velocity significantly re-mains in the range 350 to 425 km/s i.e. being nearly average on quiet days.
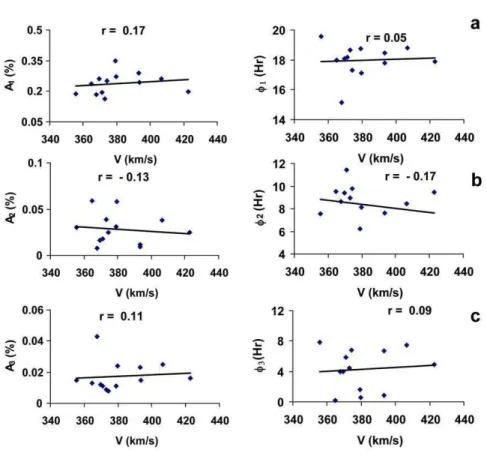
The amplitude (%) and phase (Hr) of cosmic ray
diurnal/semi-diurnal/tri-diurnal anisotropy along with the variation in associated value of solar wind velocity (V) and the regression line is plotted and shown in Fig. 4 (a, b, c) for Inuvik on quiet days during 1981-93. As depicted in Fig. 4a the amplitude A1 of the diurnal anisotropy is found
to slightly increase as the solar wind velocity increases and shows some positive correlation (r = 0.17). The phaseφ1is
found to remain along the co-rotational/18-Hr direction and slightly shifts to later time with the increase of solar wind ve-locity and shows a weak correlation (r= 0.05) as depicted in Fig. 4a. The amplitude A2of semi-diurnal anisotropy slightly
decreases with the increase of solar wind velocity and shows a weak anti-correlation (r = - 0.13). The direction of the semi-diurnal anisotropyφ2is observed to shifts towards
ear-lier hours with the increase of solar wind velocity and shows weak anti-correlation (r = - 0.17) as depicted in the Fig. 4b. The amplitude A3 of tri-diurnal anisotropy on quiet days is
observed to slightly increase with the increase of solar wind velocity and shows a weak correlation (r = 0.11). The phase φ3of the tri-diurnal anisotropy found to slightly shift towards
later hours with the increase of solar wind velocity and shows a weak correlation (r = 0.09) with V as depicted in Fig. 4c. Thus from the above investigations we may infer that neither the amplitude nor the direction of all the three harmonics have any significant trend associated with solar wind velocity on quiet days at Inuvik station with low cut off rigidity during 1981-1993. It is also observed from these plots that the solar wind velocity significantly remains in the range 350 to 425 km/s i.e. being nearly average on quiet days.
Usually, the velocity of high-speed solar wind streams (HSSWSs) is 700 km/s (Munakata et al., 1987). Therefore, it may be deduced from these plots that the amplitude as well as direction of first three harmonics on quiet days do not de-pend on the HSSWS or by the sources on the Sun responsible for producing the HSSWS such as polar coronal holes (PCH) etc. Thus, we may infer that the amplitude and direction of the anisotropy on quiet days are weakly dependent on HSS-WSs for two neutron monitoring station of mid and low cutoff rigidity threshold, which is in agreement with earlier findings (Munakata et al., 1987) and significantly contradicts with the earlier results reported by Iucci et al. (1983) and Dorman et al. (1984), that the solar diurnal amplitude is enhanced dur-ing the HSSWSs comdur-ing from coronal holes. Accorddur-ing to Ahluwalia and Riker (1987) there is no relation between so-lar wind speed and diurnal variation in high rigidity region. The modulation of solar diurnal anisotropy is weakly or less dependent on the solar wind velocity (Munakata et al., 1987). We have also plotted the scattered diagram (plots not shown here) for the amplitude (%) and phase (Hr) of cos-mic ray diurnal/semi-diurnal/tri-diurnal anisotropy along with the variation in associated value of north south component of IMF (Bz), the product (V x Bz) and calculated the correla-tion coefficient between them on quiet days for Deep River and Inuvik stations. We observed that the semi-diurnal am-plitude A2have a good anti-correlation with Bz (r = - 0.40)
and the product V x Bz (r = - 0.35) at Deep River. The time of maximum of second harmonicφ2also shows a good
FIG. 3: Amplitude and Phase of the (a) diurnal, (b) semi-diurnal and (c) tri-diurnal anisotropy on quiet days along with solar wind velocity, regression line and correlation coefficient (r) at Deep River station during 1981-1993.
at Deep River. The other components (amplitude and phase) shows very weak correlation with Bz and V X Bz.
On the other hand the amplitude of first harmonic A1shows
some positive correlation with north south component Bz (r = 0.36) and the product V x Bz (r = 0.36) at Inuvik. The time of maximum of second and third harmonic (φ2,φ3)shows a good
anticorrelation with north south component Bz (r = 0.62, -0. 46) and the product V x Bz (r = - -0.63, - -0.44) at Inuvik. While the remaining parameters (i.e. amplitude and phase) does not show any significant characteristics associated with Bz and V x Bz on quiet days. Thus, from the above findings we may infer that the amplitude as well as direction of second harmonic have a good anti-correlation with IMF Bz and the product V x Bz on quiet days at Deep River station. However, the direction of second and third harmonic has a good anti-correlation with IMF Bz and the product V x Bz on quiet days at Inuvik station.
Sabbah (1999) obtained an inverse correlation between cos-mic ray intensity and the geomagnetic activity and observed the enhancement in upper cut-off rigidity, Rc and the geomag-netic activity resulting from variation in the solar plasma para-meters. Upper cut-off rigidity correlates well with the product VB rather than with magnetic field B since VB reflects both diffusion by the IMF and convection with solar wind. The product VB is more important for cosmic rays and geomag-netic activity modulation rather than IMF alone. The
ampli-tude of 27-day variation of GCR is also linearly correlated with the IMF strength B, the z-component Bz of the IMF vec-tor and the product VB (Sabbah, 2000b). Burlaga and Ness (1998) argued that it is ultimately the strong magnetic field and their associated fluctuations that produce the modulation of cosmic rays. Coupling between the IMF strength B and the CR transport parameters leads to a simple modulation model in which the modulation process is linked to global variations of B. Belov (1999) suggested that the local value of the IMF place a significant role in controlling the GCR modulation at an observing site.
VIII. CONCLUSIONS
On the basis of above investigations following important conclusions may be drawn:
The amplitude of first harmonic remains high for Deep River having mid cutoff rigidity as compared to Inuvik neu-tron monitor having low cutoff rigidity on quiet days. The diurnal amplitude significantly decreases and phase shifts to-wards an earlier time during solar activity minimum years at both Deep River and Inuvik.
In-FIG. 4: Amplitude and Phase of the (a) diurnal, (b) semi-diurnal and (c) tri-diurnal anisotropy on quiet days along with solar wind velocity, regression line and correlation coefficient (r) at Inuvik station during 1981-1993.
uvik, whereas the phase shifts towards an earlier time during solar maximum for both the stations.
The amplitude of the third harmonic significantly enhanced during solar activity minimum at Deep River and on solar ac-tivity minimum at Inuvik, whereas the phase does not show any significant characteristics and fluctuates quite frequently.
The amplitude of semi/tri-diurnal anisotropy has a good positive correlation, while the others (i.e. amplitude and phase) have very weak correlation with solar wind velocity on quiet days at Deep River.
The amplitude and direction of the anisotropy on quiet days are weakly dependent on high-speed solar wind streams for two neutron monitoring station of mid and low cutoff rigidity threshold.
The amplitude as well as direction of second harmonic has a good anti-correlation with IMF Bz and the product V x Bz on quiet days at Deep River station. However, the direction of second and third harmonic has a good anti-correlation with IMF Bz and the product V x Bz on quiet days at Inuvik station. Additional studies can aid in understanding the results re-ported here and help to exploit this information to constrain
models of solar modulation. Studies of correlations between the CR intensity and IMF/SWP parameter(s) should be use-ful for identifying the parameter(s) that control the amplitude of the intensity modulation. It will also be of interest to de-termine how the correlation slopes depend on the time scale over which the data are averaged since the spatial extent of the structures in the heliosphere that control the modulation on short time scales must be smaller than those that produce long term effects.
IX. ACKNOWLEDGEMENTS
Agrawal, S.P., Ananth, A.G., Bemalkhedkar, M.M., Kargathra, L.V. and Rao, U.R. 1974. High-energy cosmic ray intensity in-crease of non-solar origin and the unusual Forbush dein-crease of August 1972. Journal of Geophysical Research. 79: 2269-2280. Agrawal, S.P., Pathak, S.P., and Mishra, B.L. 1983. 18th Interna-tional Cosmic Ray Conference. 3: 304-307.
Ahluwalia, H. S. 1988. Is there a twenty year wave in the diur-nal anisotropy of cosmic rays. Geophysical Research Letters. 15: 287-290.
Ahluwalia, H. S. and Fikani, M. M., 1997. 25th International Cosmic Ray Conference. 2: 125-128.
Ahluwalia, H.S. and Riker, J.F. 1987. Secular changes in the up-per cut-off rigidity of the solar diurnal anisotropy. Planetary and Space Science.35: 39-43.
Alania, M.V., Iskra, K., Modzelewska, R. and Siluszyk, M. 2005. The Galactic Cosmic Ray Intensity and Anisotrophy Vari-ations for Different Ascending and Descending Epochs of Solar Activity. 29thInternational Cosmic Ray Conference. Edited by B. Sripathi Acharya, Sunil Gupta, P. Jagadeesan, Atul Jain, S. Karthikeyan, Samuel Morris, and Suresh Tonwar. Mumbai: Tata Institute of Fundamental Research. 2: 219-222.
Amenomori, M. et al. 2005. Two dimensional observation on TeV Cosmic-ray large scale anisotropy using the Tibet Air Shower Array. 29th Interenational Cosmic Ray Conference. Edited by B. Sripathi Acharya, Sunil Gupta, P. Jagadeesan, Atul Jain, S. Karthikeyan, Samuel Morris, and Suresh Tonwar. Mum-bai: Tata Institute of Fundamental Research. 2: 49-52.
Axford, W.I. 1965a. The modulation of galactic cosmic rays in the interplanetary medium. Planetary and Space Science. 13: 115-.
Axford, W.I., 1965b. Anisotropic diffusion of solar cosmic rays. Planetary and Space Science.13: 1301-.
Ballif, J. R., Jones, D. E. and Coleman, P. J. 1969. Further ev-idence on the correlation between transverse fluctuations in the interplanetary magnetic field and Kp. Journal of Geophysical Re-search. 74: 2289-2301.
Belov, A.V., Guschina, R.T., Yanke, V.G. 1999. On Connection of Cosmic Ray Long Term Variations with Solar-Heliospheric Parameters. 26thInternational Cosmic Ray Conference.Edited by D. Kieda, M. Salamon, and B. Dingus. 7: 175-178.
Bieber, J. W. and Evenson, P. 1997. 25thInternational Cosmic Ray Conference. 2: 81-84.
Braun, J. Engler, H¨orandel, J.R. and Milke, J. 2005. Solar mod-ulation of cosmic rays in the energy range from 10 to 20 GeV. 29thInternational Cosmic Ray Conference. 2: 135-138. Burlaga, L.F. and Ness, N.F. 1998. Magnetic field strength distri-butions and spectra in the heliosphere and their significance for cosmic ray modulation: Voyager 1, 1980-1994. Journal of Geo-physical Research. 103: 29719- 29732.
Bussoletti, E. 1973. Eldo-Celes/Esro-Cers Scient. Technical Re-view. 5: 285.
Chapmen, S. and Bartels. 1940. Geomagnetic II, Oxford Univer-sity Press.
Dorman, L. I., Kaminer, N.S., Kuj’micheva, A.E. and Mymrina, N.V. 1984. Features of diurnal variations of cosmic rays in high-speed streams of the solar wind. Geomagnetism and Aeronomy. 24: 546-551.
El-Borie, M. A., Sabbah, I., Darwish, A. and Bishara, A. 1995. 24thInternational Cosmic Ray Conference. 4: 603-606. Forbush, Schott E. 1973. Cosmic ray diurnal anisotropy 1937 -1972. Journal of Geophysical Research. 78: 7933-7941.
Forman, M.A. and Gleeson, L.J. 1975. Cosmic-ray streaming and anisotropies. Astrophysics and Space Science. 32: 77-94. Fujimoto, K., Kojimatt, K. and Munakami, K. 1983. Cosmic Ray Intensity Variations and Solar Wind Velocity. 18thInternational Cosmic Ray Conference.3: 267-270.
Hashim, A. and Thambyahpillai, H. 1969. Large amplitude wave trains in the cosmic ray intensity. Planetary and Space Science. 17: 1879-1889.
Iucci, N., Parisi, M., Storini, M. and Villoresi, G. 1983. The be-havior of the cosmic-ray equatorial anisotropy inside fast solar-wind streams ejected by coronal holes. Nuovo Cimento.6C: 145-148.
Iucci, N., Parisi, M., Storini, M., Villoresi, G. 1979. High-speed solar-wind streams and galactic cosmic-ray modulation. Nuovo Cimento. 2C: 421-438.
Jadhav, D. K., Shrivastava, M., Tiwari, A. K. and Shrivastava, P. K. 1983. Study of semi-diurnal variation of cosmic rays during days of high amplitude wave trains. 18th International Cosmic Ray Conference. 3: 337-340.
Kaminer, N.S., Kuzmicheva, A. E., Mymrina, N.V. 1981, Cosmic-ray anisotropy near the boundary of a high-speed solar-wind stream. Geomagnetizm i Aeronomiia. 21: 424-427. Kane, R. P. 1970. Diurnal anisotropy of cosmic ray intensity. Journal of Geophysical Research. 75: 4350-4353.
Kane, R. P. 1974. Relationship between interplanetary plasma parameters and geomagnetic Dst. Journal of Geophysical Re-search. 79: 64-72.
Kondoh, K., Hasebe, N., Doke, T., Kikuchi, J., Kobayashi, M. N., Medina J., Sequeiros, J., Takashima, T., Yanagimachi, T., Wilken, B. 1999. Galactic Cosmic Ray and Recurrent Enhance-ment of Solar Wind Velocity. 26th International Cosmic Ray Conference.Edited by D. Kieda, M. Salamon, and B. Dingus. 7: 179-182.
Kozyarivsky, V.A., Lidvansky, V.A., Petkov, V.B. and Tulupova, T.I. 2005. Mean Diurnal Variations of Cosmic Ray Intensity as Measured by the Baksan Surface and Underground Detectors. 29thInternational Cosmic Ray Conference. 2: 93-96.
Kumar, S. and Yadav, R.S. 1981. 17thInternational Cosmic Ray Conference. Edited by B. Sripathi Acharya, Sunil Gupta, P. Ja-gadeesan, Atul Jain, S. Karthikeyan, Samuel Morris, and Suresh Tonwar. Mumbai: Tata Institute of Fundamental Research. 10: 242-245.
Kumar, S., Agarwal, R., Mishra, R. and Dubey, S.K. 2001. A new concept of analysis of solar daily variation in cosmic ray intensity. 27th International Cosmic Ray Conference. 3: 3966-3969.
Kumar, S., Chauhan, M. L. and Dubey, S. K. 1997. Ef-fect of Interplanetary Turbulences Causing High/low Amplitude Anisotropic Wave Trains in CR Intensity. Solar Physics. 176: 403-415.
Kumar, S., Gulati, U., Khare, D., Tripathi, M. and Sharma, M. 1993. Study of 22-year periodicity in cosmic ray diurnal anisotropy on quiet days Journal of Pure and Applied Physics. 5: 276-285.
Mavromichalaki, H. 1979. Astrophysics and Space Science. 80: 59.
McCraken, K.G., and Rao, U.R. 1965. A survey of the diurnal anisotropy. 9thInternational Cosmic Ray Conference.1: 213-216.
McCraken, K.G., Rao, U.R. and Ness, N.F. 1968. The Inter-Relationship of Cosmic Ray Anisotropies and the Interplanetary Magnetic Field. Astronomical Journal. 73: 70.
Moraal, H., Caballero-Lopez, R.A., McCracken, K.G. and Hum-ble, J.E. 2005. 29th International Cosmic Ray Conference. 2: 105-108.
Munakata, K., Mori, S., Ryu, J.Y., Agrawal, S.P. and Venkatesan, D. 1987. 20thInternational Cosmic Ray Conference. 4: 39-42. Owens, A.J. and Kash, M.M. 1976. Journal of Geophysical Re-search. 81: 3471-.
Parker, E.N. 1964. Theory of streaming of cosmic rays and the diurnal variation. Planetary and Space Science. 12: 735. Pomerantz, M.A., Agrawal, S.P. and Potnis, V.R. 1960. Journal of Franklin Institute.269: 235-.
Rao, U.R. 1972. Solar Modulation of Galactic Cosmic Radiation. Space Science Review.12: 719-.
Rao, U.R., Ananth, A.G. and Agrawal, S.P. 1972. Characteristics of quiet as well as enhanced diurnal anisotropy of cosmic radia-tion. Planetary and Space Science. 20: 1799.
Richardson, I. G., Cane, H. V. and Wibberenz, G. 1999. Journal
of Geophysical Research. 104: 12549.
Sabbah, I., Darwish, A.A. and Bishara, A.A. 1998. Character-istics of two-way cosmic ray diurnal anisotropy, Solar Physics. 181: 469-477.
Sabbah, I. 1999. Magnetic cycle dependence of the cosmic ray diurnal anisotropy. Solar Physics. 188: 403-417.
Sabbah, I. 2000a. The influence of transient solar-wind events on the cosmic-ray intensity modulation. Canadian Journal of Physics. 78: 293-302.
Sabbah, I. 2000b. The role of interplanetary magnetic field and solar wind in modulating both galactic cosmic rays and geo-magnetic activity. Geophysical Research Letters. 27 (13): 1823-1826.
Sabbah, I., 1996.Journal of Geophysical Research. 101: 2485-. Sheeley, N.R., Swanson, E.T., Wang, T.M. 1991. Journal of Geo-physical Research.96: 861-.
Sikripin, G. V. and Mamrukova, V. P. 1993. Izvestia of Russian Academy of Sciences, Ser. Phys. 57 (N7): 51.
Tiwari, A.K. 1994. Ph.D. thesis, A.P.S. University, Rewa, India. Tiwari, A.K. 1995. 24thInternational Cosmic Ray Conference. 3: 948-951.