Annales
Geophysicae
The solar wind at solar maximum: comparisons of EISCAT IPS
and in situ observations
A. R. Breen1, P. Riley2, A. J. Lazarus3, A. Canals1, R. A. Fallows1, J. Linker2, and Z. Mikic2 1University of Wales Aberystwyth, Penglais, Aberystwyth, Ceredigion, Wales, UK
2Science Applications International Corporation, La Jolla, California, USA 3Massachusetts Institute for Technology, Cambridge, Massachusetts, USA Received: 12 November 2001 – Revised: 12 July 2002 – Accepted: 19 July 2002
Abstract. The solar maximum solar wind is highly struc-tured in latitude, longitude and in time. Coronal measure-ments show a very high degree of variability, with large vari-ations that are less apparent within in situ spacecraft mea-surements. Interplanetary scintillation (IPS) observations from EISCAT, covering distances from 20 to 100 solar radii (RS), are an ideal source of information on the inner solar wind and can be used, therefore, to cast light on its evo-lution with distance from the Sun. Earlier comparisons of in situ and IPS measurements under solar minimum condi-tions showed good large-scale agreement, particularly in the fast wind. In this study we attempt a quantitative compari-son of measurements made over solar maximum by EISCAT (20–100RS) and the Wind and Ulysses spacecraft (at 215RS and 300–1000RS, respectively). The intervals studied were August–September 1999, May 2000, September 2000 and May 2001, the last-named being the period of the second Ulysses fast latitude scan. Both ballistic and – when pos-sible – MHD/ballistic hybrid models were used to relate the data sets, and we compare the results obtained from these two mapping methods.
The results of this study suggest that solar wind veloci-ties measured in situ were less variable than those estimated from IPS measurements closer to the Sun, with the greatest divergence between IPS velocities and in situ measurements occurring in regions where steep longitudinal velocity gradi-ents were seen in situ. We suggest that the interaction be-tween streams of solar wind with different velocities leads to “smoothing” of solar wind velocities between 30–60RS and 1 AU, and that this process continues at greater distances from the Sun.
Key words. Interplanetary physics (solar wind plasma; sources of the solar wind; instruments and techniques)
1 Introduction
In situ measurements from plasma instruments on spacecraft provide absolute measurements of solar wind parameters at
Correspondence to:A. R. Breen ([email protected])
a known position and time with very good time resolution, but as these are normally single-point measurements it is dif-ficult to separate variations in space and time. Some multi-spacecraft experiments have been carried out (e.g. Rhodes and Smith, 1981; Miyake et al., 1988; Gazis, 1995; Both-mer and Schwenn, 1998), and these have provided consid-erable information on solar wind structure in interplanetary space. More serious, however, is the limited coverage of the solar wind outside the plane of the ecliptic and close to the Sun. Therefore, there are no in situ measurements of the regions where the solar wind originates and where its large-scale structure is determined.
Remote sensing observations are – at present – the only sources of information on the corona and inner solar wind. Compared to in situ observations, they have good spatial cov-erage, being able to observe the solar wind at any latitude, but the solar wind parameters must be derived from other surements instead of being measured directly, and the mea-surements themselves are normally path-integrated, contain-ing contributions from different regions of solar wind. Re-mote sensing observations used to estimate solar wind speed include:
– Measurements of Doppler dimming (Hyder and Lites, 1970), in which relative intensities of spectral lines ob-served in UV are used to derive the wind speed;
– Measurements in which the drift speeds of bright fea-tures in white-light images that are assumed to be drift-ing in the background wind speed (e.g. Sheeley et al., 1997; Tappin et al., 1999).
Both of these methods provide extremely useful infor-mation on the corona and the innermost regions of the so-lar wind, but at present Doppler-dimming measurements are restricted to heliocentric distances inside 6RS (Kohl et al., 1995) and white-light measurements of drift speeds to inside 30RS (Brueckner et al., 1995). Measurements of interplan-etary scintillation (IPS) can be used to extend coverage to greater heliocentric distances.
θ in
θ out
P Fast stream
Slow stream Slow stream
Fast wind, Vf
θ
Slow wind, Vs
Slow wind, Vs V
f cos(θ) Rotation of Sun
From radio source
To receivers Sun
Fig. 1.Schematic diagrams of an IPS observation (not to scale):(a) Shown as if looking down on the North Pole of the Sun. The ray paths from the radio source to the receiver pass through the extended solar atmosphere, with their point of closest approach to the Sun (P) lying at a distance ofRSsolar radii from the centre of the Sun.θin andθoutdefine the angular extent of the ray path which is immersed in fast solar wind: in the coordinate system adopted in this study, an-gles are measured from the Sun-P direction and are positive towards the radio source, and negative towards the Earth. Note that the fast stream does not need to be centred on the P-point – for example, in the observation of 1150-003 on 11 September 2000, mapping the IPS ray path down to 2.5RSand overlaying it on a map of white-light intensity measured by LASCO C2 suggested thatθin = −80 andθout= −20.
Sun
Beam A Beam B
Bpar
Bperp
R
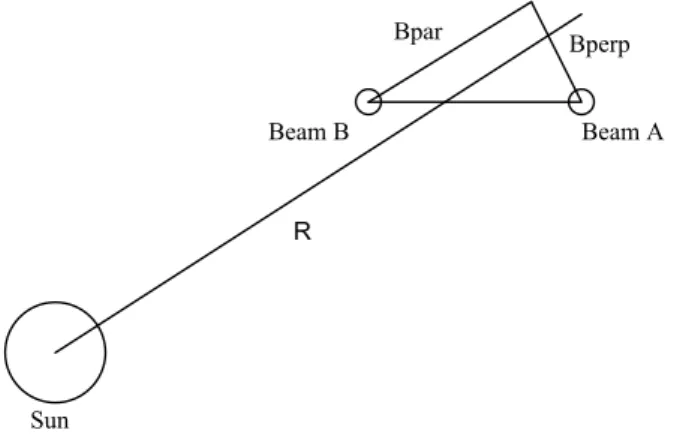
Fig. 1. (b)Shown as if looking from the direction of the radio source towards the receiving antennas. Beams A and B represent the ray paths from the source to the two receiving stations. The ray paths are separated by a distanceBkis the direction radial to the Sun (shown as Bpar in the diagram) and byB⊥in the direction tan-gential to the Sun (Bperp in the diagram). The correlation between the scintillations seen at the two sites is greatest whenB⊥is small. Velocity resolution increases for largerBk.
interplanetary scintillation (IPS) could provide information on the solar wind (e.g. Hewish et al., 1964; Dennison and Hewish, 1967). Developments in the technique led to the use
of two-station observations, in which the scintillation pattern is measured at two widely separated sites (Armstrong and Coles, 1972). Provided that the IPS observations are made at a time when the ray paths from the radio source to the two receiving sites lie in a plane which passes through the centre of the Sun (Figs. 1a, b), a high degree of correlation may be present between the scintillation patterns seen at the two sites. To a first approximation the time-lag for maximum cross-correlation provides a direct estimate of the solar wind outflow speed (e.g. Bourgois et al., 1985), making it possi-ble to obtain reliapossi-ble measurements of the solar wind speed over a wide range of distances from the Sun and at any heli-ographic latitude (e.g. Kojima and Kakinuma, 1990; Coles, 1995). The accuracy to which the outflow speed can be de-termined improves as the baseline between the sites increases (e.g. Breen et al., 1996), as does the ability to resolve fast and slow streams when both are present in the scattering region (Rao et al., 1995).
IPS observations contain contributions to the scintillation pattern from the whole ray path, from the source to the re-ceivers, but the scintillation potential (the scintillation power produced per unit length of the ray path through the solar wind) is determined by the variations in refractive index, which, in turn, are roughly proportional to the square of the electron density. In a uniform, radially expanding solar wind, the electron density falls off at a rate close toR−2, so the scintillation potential drops off roughly asR−4(see Fallows, 2001; Fallows et al., 2002b for a more detailed treatment of scintillation levels), so the observation is normally domi-nated by scattering from the portion of the ray path nearest to the point of closest approach to the Sun (the P-point, as shown in Fig. 1a). The accuracy to which IPS can estimate solar wind speed improves as the separation of the anten-nas projected into the plane of the sky (the parallel baseline, Bk, as illustrated in Fig. 1b) used to sample the scintillation
pattern increases, with the time-lag for maximum correlation increasing, and as this happens, the ability to resolve two dif-ferent solar wind speeds across the ray path improves (e.g. Grall, 1995; Rao et al., 1995; Grall et al., 1996).
In this study we use data from the EISCAT facility which offersBkup to 390 km. EISCAT consists of three sites, at
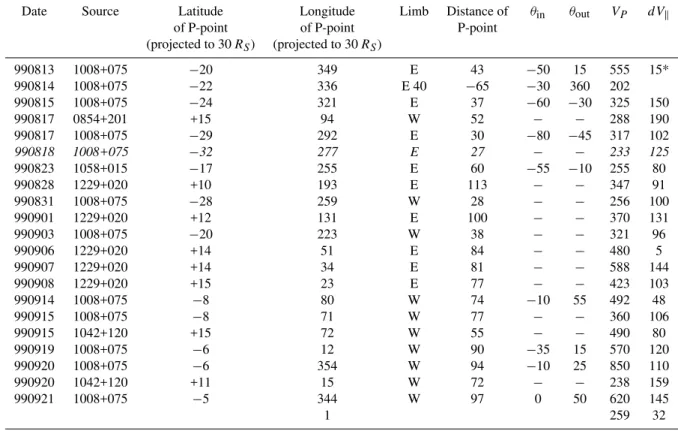
Table 1.EISCAT observations taken during the 3rdWhole Sun Month, 13 August 1999 – 21 September 1999 at latitudes within±15◦of the latitude of Wind or Ulysses. Wind lay at a mean heliographic latitude of 7◦during this period, while Ulysses climbed from−32◦to−34◦in the course of the month.
Latitudes and longitudes are in heliographic/Carrington coordinates projected ballistically back to 30RS at constant speedVP, distances are heliocentric in units of solar radii (RS) and speeds are in km/s. θinandθoutdescribe the position and angular extent of the fast stream, measured from the Sun-Earth line with angles+veaway from the Earth, as shown in Fig. 1 (if no angle shown, then the observation was fitted as a single stream).VP is the speed of the solar wind stream across the ray path at the point of closest approach to the Sun (the P-point) and,dVkis the variation in speed over the width of the stream (fast or slow) where this parameter was fitted, or the uncertainty in the fitted value of the stream speed (marked∗in the latter case). Observations shown in italics may be affected by strong scattering. The observation of 1042+120 on 20 September 1999 may be a slow-rising CME. Source names are based on their Right Ascension and Declination in 2000, with names given in the form hour, minute of right ascension+degrees of declination. The source 1008+075, therefore, had a right ascension of 10 h 8 min and a declination of+7.5◦at the start of 2000
Date Source Latitude Longitude Limb Distance of θin θout VP dVk
of P-point of P-point P-point
(projected to 30RS) (projected to 30RS)
990813 1008+075 −20 349 E 43 −50 15 555 15*
990814 1008+075 −22 336 E 40 −65 −30 360 202
990815 1008+075 −24 321 E 37 −60 −30 325 150
990817 0854+201 +15 94 W 52 − − 288 190
990817 1008+075 −29 292 E 30 −80 −45 317 102
990818 1008+075 −32 277 E 27 − − 233 125
990823 1058+015 −17 255 E 60 −55 −10 255 80
990828 1229+020 +10 193 E 113 − − 347 91
990831 1008+075 −28 259 W 28 − − 256 100
990901 1229+020 +12 131 E 100 − − 370 131
990903 1008+075 −20 223 W 38 − − 321 96
990906 1229+020 +14 51 E 84 − − 480 5
990907 1229+020 +14 34 E 81 − − 588 144
990908 1229+020 +15 23 E 77 − − 423 103
990914 1008+075 −8 80 W 74 −10 55 492 48
990915 1008+075 −8 71 W 77 − − 360 106
990915 1042+120 +15 72 W 55 − − 490 80
990919 1008+075 −6 12 W 90 −35 15 570 120
990920 1008+075 −6 354 W 94 −10 25 850 110
990920 1042+120 +11 15 W 72 − − 238 159
990921 1008+075 −5 344 W 97 0 50 620 145
1 259 32
2002b). Reliable bulk speeds can be determined beyond 100RSfor stronger radio sources.
Analysis of IPS data using a two-dimensional weak scat-tering model (Grall, 1995; Coles, 1996; Klinglesmith, 1997; Massey, 1998) have shown that, provided the observation is sufficiently far from the Sun as to be in weak scattering, it is possible to detect the presence of separate fast and slow streams across the ray path (Grall et al., 1996; Coles, 1996; Breen et al., 1996). In situ measurements have established that near to solar minimum, the solar wind has two distinct components: a fast stream flowing at about 750 to 800 km/s and a slow stream with a flow speed of about 350 to 400 km/s (e.g. Schwenn, 1990; Phillips et al., 1994; Woch et al., 1997; McComas et al., 2000). The fast wind originates from open magnetic field regions that are conspicuous as dark re-gions in maps of coronal white-light intensity (e.g. Snyder and Neugebauer, 1966; Krieger and Timothy, 1973; Neupert
and Pizzo, 1974; Nolte et al., 1976). This bimodal distri-bution of solar wind speed has been confirmed in IPS data (e.g. Breen et al., 1996), and, together with the clear associa-tion between large regions of dark corona (coronal holes) and high-speed streams, makes it possible to use white-light in-tensity in coronal maps to determine whether a given region of an IPS ray path is immersed in fast or slow flow and thus, in the weak scattering regime, to separate the contributions of the observed scattering pattern of the fast and slow winds (e.g. Grall et al., 1996; Coles, 1996; Breen et al., 1998).
Table 2.As Table 1 but summarizing observations taken by EISCAT between 11 and 28 May 2000 at latitudes within±15◦of the latitude of Wind or Ulysses. Wind lay at a mean heliographic latitude of−2◦during this period, while Ulysses climbed from−55◦to−57◦in the course of the month. VP is the speed of the solar wind stream across the ray path at the point of closest approach to the Sun (the P-point) and,dVkis the variation in speed over the width of the stream (fast or slow) where this parameter was fitted, or the uncertainty in the fitted value of the stream speed (marked∗in the latter case). Observations shown initalicsmay be affected by strong scattering
Date Source Latitude Longitude Limb Distance of θin θout VP dVk
of P-point of P-point P-point
(projected to 30RS) (projected to 30RS)
000511 0431+206 −11 11 E 67 − − 431 200
000512 0431+206 −11 359 E 63 − − 320 120
000514 0431+206 −12 327 E 57 − − 369 93
000515 0431+206 −12 311 E 53 − − 420 78
000516 0321+123 −46 92 W 28 − − 383 170
000516 0433+053 −58 325 E 74 − − 504 200
000517 0409+122 −62 286 E 39 −20 20 693 35
000517 0431+206 −13 281 E 46 20 80 428 103
000517 0433+053 −60 310 E 72 −20 20 716 72
000518 0318+164 −10 70 W 23 −25 25 605 50
000518 0431+206 −13 267 E 43 10 75 264 124
000519 0318+164 −8 56 W 26 −25 15 717 141
000520 0318+164 −6 43 W 30 −20 10 605 73
000520 0431+206 −15 233 E 35 −30 55 592 30
000521 0318+164 −5 29 W 33 0 80 716 350
−5 30 363 114
000522 0318+164 −4 17 W 37 − − 315 107
000523 0318+164 −3 4 W 40 −80 −30 316 67
000524 0318+164 −2 349 W 44 −80 0 529 116
−2 350 336 22
000525 0318+164 −1 335 W 47 −75 10 528 3*
000526 0318+164 −1 324 W 51 − − 360 54
al., 2000c, 2002a, b).
Comparisons between in situ and radio-scintillation obser-vations of the solar wind have been carried out in the past, us-ing both measurements of IPS (Behannon et al., 1991; Lein-ert and Jackson, 1998) and phase scintillation (Spangler and Sakurai, 1995), but the ability of these measurements to re-solve streams of solar wind with different velocities was very limited. Quantitative comparisons between high-resolution IPS measurements from long-baseline systems and in situ measurements have been carried out using data from near to solar minimum (Grall et al., 1996; Kojima et al., 1998; Breen et al., 1999), while qualitative comparisons between measurements from a wide range of heliocentric distances at solar maximum have also been presented (e.g. Breen et al., 2000d). In this paper we take advantage of the high-quality long-baseline observations made by EISCAT and compare them with in-ecliptic measurements and out-of-ecliptic mea-surements from Wind and Ulysses, using a combination of ballistic and MHD mapping. Therefore, this paper represents a first attempt at a quantitative comparison of the large-scale structure of the solar maximum solar wind as revealed by in situ measurements and high-resolution, long-baseline IPS observations.
2 Datasets
In this paper we consider data from EISCAT IPS, Wind and Ulysses taken during four periods covering the rise to solar maximum, the period of maximum activity itself and – per-haps – the start of the declining phase:
– 18 August – 14 September 1999 (Carrington rotation 1953)
– 11–28 May 2000 (Carrington rotation 1963)
– 7–13 September 2000 (Carrington rotation 1967)
– 8–31 May 2001 (Carrington rotation 1976)
Table 3.As Table 1 but summarizing EISCAT observations taken between 7 and 13 September 2000 at latitudes within±15◦of the latitude of Wind, which lay at a mean latitude of 7.24◦during this period, while Ulysses climbed from−70◦to−72◦, but no EISCAT measurements of these high southern latitudes were successful due to corruption by ground noise.VP is the speed of the solar wind stream across the ray path at the point of closest approach to the Sun (the P-point), anddVkis the variation in speed over the width of the stream (fast or slow) where this parameter was fitted, or the uncertainty in the fitted value of the stream speed (marked∗in the latter case). Observations shown initalicsmay be affected by strong scattering
Date Source Latitude Longitude Limb Distance of θin θout VP dVk
of P-point of P-point P-point
(projected to 30RS) (projected to 30RS)
000908 1150−003 −5 216 E 44 − − 246 117
000908 1229+020 15 233 E 75 − − 338 69
000909 1150−003 −5 199 E 41 − − 344 141
000910 1150−003 −6 184 E 37 10 40 316 171
000910 1256−057 +3 217 E 98 − − 372 157
000911 1150−003 −7 168 E 34 −80 −20 423 55
000911 1256−057 +4 202 E 94 − − 371 141
000912 1150−003 −8 154 E 30 −80 −15 414 5*
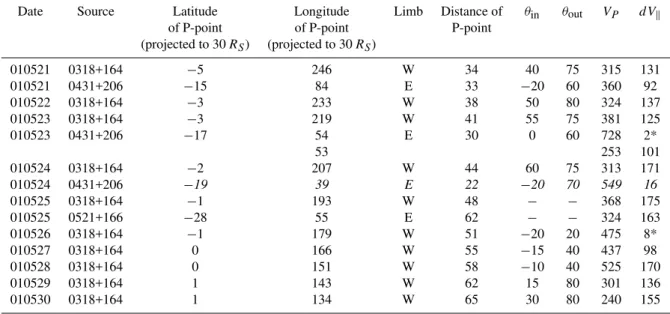
Table 4. As Table 1 but summarizing EISCAT observations taken between 8 and 31 May 2001 at latitudes within±15◦of the latitude of Wind or Ulysses. Wind lay at a mean latitude of 5◦during this period, while Ulysses passed through the ecliptic during its fast latitude scan. VP is the speed of the solar wind stream across the ray path at the point of closest approach to the Sun (the P-point), anddVkis the variation in speed over the width of the stream (fast or slow) where this parameter was fitted, or the uncertainty in the fitted value of the stream speed (marked∗in the latter case). Observations shown initalicsmay be affected by strong scattering. The observations of 0431+206 on 24 May and 0521+166 on 25 May 2001 are probably dominated by the passage of CMEs across the ray path
Date Source Latitude Longitude Limb Distance of θin θout VP dVk
of P-point of P-point P-point
(projected to 30RS) (projected to 30RS)
010521 0318+164 −5 246 W 34 40 75 315 131
010521 0431+206 −15 84 E 33 −20 60 360 92
010522 0318+164 −3 233 W 38 50 80 324 137
010523 0318+164 −3 219 W 41 55 75 381 125
010523 0431+206 −17 54 E 30 0 60 728 2*
53 253 101
010524 0318+164 −2 207 W 44 60 75 313 171
010524 0431+206 −19 39 E 22 −20 70 549 16
010525 0318+164 −1 193 W 48 − − 368 175
010525 0521+166 −28 55 E 62 − − 324 163
010526 0318+164 −1 179 W 51 −20 20 475 8*
010527 0318+164 0 166 W 55 −15 40 437 98
010528 0318+164 0 151 W 58 −10 40 525 170
010529 0318+164 1 143 W 62 15 80 301 136
010530 0318+164 1 134 W 65 30 80 240 155
at −55◦ to −57◦ heliographic latitude at a distance close to 750RS. Wind was again close to the Earth at a helio-graphic latitude between−3◦and 1◦. By September 2000, Ulysses had climbed to more than 70◦south (heliographic), and comparisons with EISCAT were extremely difficult, with only a few suitable radio sources above the horizon at such high southern latitudes. During the event, none of the good sources on Ulysses’ streams produced usable results, and the comparisons for this period are, therefore, with Wind data
only. Ulysses reached its highest southern latitude on 24 November 2000 and by the beginning of May 2001 it was well into its fast latitude scan, passing over the heliographic equator off the west limb at a distance of about 300RS later in the month. Ulysses and Wind, therefore, sampled the solar wind at longitudes 90◦apart during this period, and together
(a)
(b)
(c)
(d)
150 250 350 450 550 650 750 850 950
0 45 90 135 180 225 270 315 360 Wind
EISCAT IPS Solar wind speed (km/s)
Carrington Longitude (a)
150 250 350 450 550 650 750 850 950
0 45 90 135 180 225 270 315 360 Wind
EISCAT IPS Solar wind speed (km/s)
Carrington Longitude (b)
150 250 350 450 550 650 750 850 950
0 45 90 135 180 225 270 315 360
Wind EISCAT IPS Solar wind speed (km/s)
Carrington Longitude (c)
150 250 350 450 550 650 750 850 950
0 45 90 135 180 225 270 315 360
Wind EISCAT IPS Solar wind speed (km/s)
Carrington Longitude (d)
Fig. 3.Solar wind speeds measured in situ by Wind near the Earth and EISCAT IPS speeds from within±15◦of the heliographic latitude of Wind mapped ballistically to a uniform heliocentric distance of 30RSand plotted as speed vs. Carrington longitude.(a)shows results from CR 1953 (August–September 1999, while results from CR 1963 (May 2000) are shown in(b), CR 1967 (September 2000) in(c)and CR 1976 (May 2001) in(d). The large vertical bars represent the variation in velocity across the IPS ray path and are not estimates of errors in the measurement.
2.1 EISCAT IPS observations
The EISCAT observations made during each of these peri-ods are summarized in Tables 1–4. The locations of fast and slow streams of solar wind in the ray path for each observa-tion were estimated by projecting the IPS ray paths down to a constant heliocentric distance of 2.5RS using a constant-speed ballistic mapping and overlaying them on white-light maps constructed from LASCO C2 data. The use of ballistic mapping is not ideal, since there is a strong acceleration of the flow close to the Sun (e.g. Sheeley et al., 1997; Breen et al., 2000b, 2002b) and strong indications of super-radial expansion of fast flow and, moreover, it does not take into account co-rotation effects very close to the Sun. Ballistic mapping does, nonetheless, provide an indication of the lo-cation of fast streams, and the method appears to work well (e.g. Breen et al., 1996, 1998, 2000a, d). At solar maximum the uncertainties are larger, but more sophisticated mapping
150 250 350 450 550 650 750 850 950
0 45 90 135 180 225 270 315 360 Ulysses
EISCAT IPS Solar wind speed (km/s)
Carrington Longitude (a) 150 250 350 450 550 650 750 850 950
0 45 90 135 180 225 270 315 360 Ulysses
EISCAT IPS Solar wind speed (km/s)
Carrington longitude (b)
150 250 350 450 550 650 750 850 950
0 45 90 135 180 225 270 315 360
Ulysses EISCAT IPS Solar wind speed (km/s)
Carrington longitude (c)
150 250 350 450 550 650 750 850 950
0 45 90 135 180 225 270 315 360
Ulysses EISCAT IPS Solar wind speed (km/s)
Carrington longitude (d)
Fig. 4.Ulysses in situ speed measurements and EISCAT IPS speeds from within±15◦of any latitude of Ulysses over each interval, mapped to a uniform heliocentric distance of 30RSusing either a ballistic projection or (d) a hybrid MHD/ballistic mapping method and plotted as speed vs. Carrington longitude. (a)shows results from CR 1953 (August–September 1999), while results from CR 1963 (May 2000) are shown in(b)and CR 1976 (May 2001) in(c)(ballistically-mapped Ulysses data) and(d)(MHD/ballistic mapping). There were no good EISCAT observations at sufficiently high southern latitudes for comparison with Ulysses during CR 1967. The large vertical bars represent the variation in velocity across the IPS ray path and are not estimates of errors in the measurement.
the IPS ray paths were mapped to a constant heliocentric dis-tance of 30RS using a constant-speed ballistic model, with the speed used being that suggested by the analysis model fit for the portion of the ray path closest to the Sun. The results are summarised in Tables 1–4: in all cases the speeds used for mapping (VP) are listed in column 9 and the uncertainties in the speed across this region of the ray path (betweenθinand θout) asdVkin column 10. In most observations the
uncer-tainty in speed is likely to be dominated by the real variation in solar wind speed over the extended ray path.
2.2 In situ data from Wind and Ulysses
The in situ plasma data used in this study were taken by the Solar Wind Experiment (SWE) on the Wind spacecraft (Ogilvie et al., 1995) and by the Solar Wind Observations
150 250 350 450 550 650 750 850 950
0 45 90 135 180 225 270 315 360 Wind
EISCAT IPS Solar wind speed (km/s)
Carrington longitude (a) 150 250 350 450 550 650 750 850 950
0 45 90 135 180 225 270 315 360
EISCAT IPS Wind Solar wind speed (km/s)
Carrington longitude (b)
150 250 350 450 550 650 750 850 950
0 45 90 135 180 225 270 315 360
EISCAT IPS Wind Solar wind speed (km/s)
Carrington longitude (c)
150 250 350 450 550 650 750 850 950
0 45 90 135 180 225 270 315 360
EISCAT IPS Wind Solar wind speed (km/s)
Carrington longitude (d)
Fig. 5.Solar wind speeds measured in situ by Wind near the Earth and EISCAT IPS speeds from within±10◦of the heliographic latitude of Wind mapped ballistically to a uniform heliocentric distance of 30RSand plotted as speed vs. Carrington longitude.(a)shows results from CR 1953 (August–September 1999, while results from CR 1963 (May 2000) are shown in(b), CR 1967 (September 2000) in(c)and CR 1976 (May 2001) in(d). The large vertical bars represent the variation in velocity across the IPS ray path and are not estimates of error in the measurement.
parameters at 1 AU and beyond can, therefore, be derived from the observed photospheric magnetic field. In this study the SAIC MHD model was used to trace streams of solar wind inwards from the spacecraft measurements to 0.75RS (0.35 AU), with ballistic mapping used to map the streams in to 30RS. Since interaction between the streams is more important at larger distances, the use of ballistic mapping in the inner regions of the solar wind (though still outside the acceleration region) is acceptable.
Unfortunately, during late 1999 and 2000, the solar mag-netic field was evolving so rapidly that these equilibrium models were not appropriate for this study and so we were compelled to use simple ballistic mapping for in situ data from Carrington rotations CR 1953 (August–September 1999), CR 1963 (May 2000) and CR 1967 (September 2000). The speeds used were taken from the in situ data and were as-sumed to be constant. It did, however, prove possible to use the MHD model for data from CR 1976 (May 2001).
3 Results
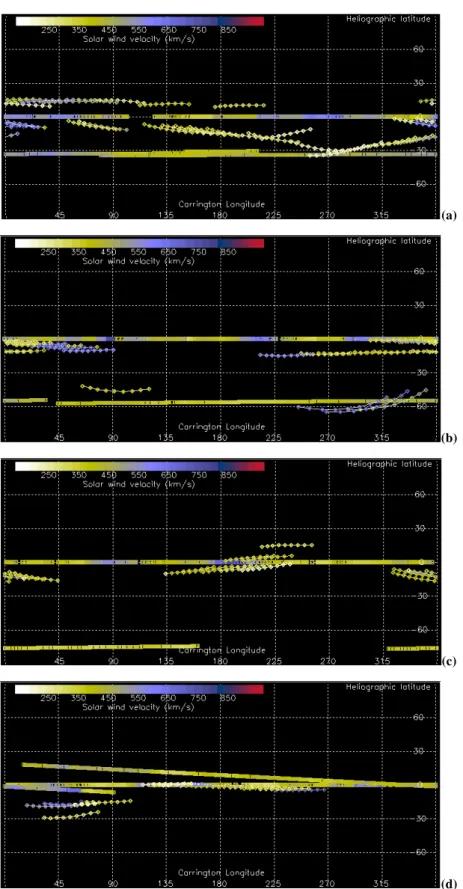
IPS and in situ speeds mapped to 30RS are plotted on heli-ographic latitude/Carrington longitude maps for the four in-tervals studied in Fig. 2. In each case the central 40◦of each IPS ray path is plotted (fromθin = −20◦toθout = 20◦, a
150 250 350 450 550 650 750 850 950
0 45 90 135 180 225 270 315 360
EISCAT IPS Ulysses Solar wind speed (km/s)
Carrington longitude (a)
150 250 350 450 550 650 750 850 950
0 45 90 135 180 225 270 315 360
EISCAT IPS Ulysses Solar wind speed (km/s)
Carrington longitude (b)
150 250 350 450 550 650 750 850 950
0 45 90 135 180 225 270 315 360
EISCAT IPS Ulysses Solar wind speed (km/s)
Carrington longitude (c)
150 250 350 450 550 650 750 850 950
0 45 90 135 180 225 270 315 360
Ulysses EISCAT IPS Solar wind speed (km/s)
Carrington longitude (d)
Fig. 6.Ulysses in situ speed measurements and EISCAT IPS speeds from within±10◦of the actual latitude of Ulysses over each interval, mapped to a uniform heliocentric distance of 30RS using either a ballistic projection or (d) a MHD mapping and plotted as speed vs. Car-rington longitude.(a)shows results from CR 1953 (August–September 1999, while results from CR 1963 (May 2000) are shown in(b)and CR 1976 (May 2001) in(c)(ballistic mapping) and(d)(MHD/ballistic mapping). There were no good EISCAT observations at sufficiently high southern latitudes for comparison with Ulysses during CR 1967. The large vertical bars represent the variation in velocity across the IPS ray path and are not estimates of errors in the measurement.
in (d).
3.1 CR 1953, 18 August – 14 September 1999
There was good agreement between the solar wind speeds measured by EISCAT at latitudes close to that of Wind (7◦N) and those recorded in situ by Wind during this pe-riod (Fig. 2a), though EISCAT did suggest significantly higher speeds near 0◦ longitude, together with significantly lower speeds close to 20◦and 340◦ longitude, as shown in Fig. 3a. Apart from one observation centred on 24◦ longi-tude (1042+120 on 20 September 1999, with a P-point at 11◦N latitude), the IPS speeds follow the general trend of the in situ data well, but appear on closer inspection to suggest a larger variation in flow speed. The large vertical “error” bars in the IPS speeds do not, in most cases, represent the
statistical error in the IPS fit in the estimated bulk flow speed but instead provide an estimate of the variation in solar wind speed over the extended IPS ray path. While the bulk flow speed estimated by the analysis model represents the average speed across that part of the ray path containing the P-point, weighted byR−4and thus heavily biased towards the flow speed across the P-point, the spread in speeds will be con-siderably enhanced if there are significant gradients in speed present – for example, if the ray path passes through regions of slow wind with different intrinsic speeds. It is important to note that the spread in speeds represented bydVkmay not be
symmetrical about the estimated bulk flow speed, but since there is no easy way of determining this asymmetry, we have plotted the points inV ±dVkform.
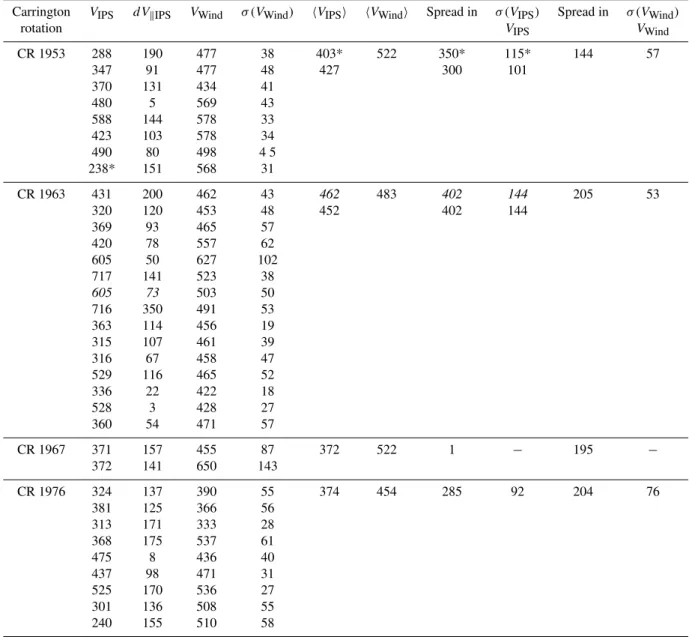
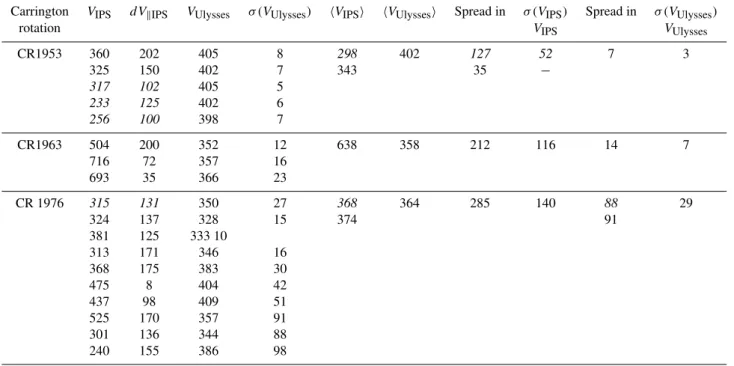
Table 5.Comparison of speeds determined from EISCAT IPS data with in situ speeds measured by Wind and Ulysses. The IPS observations all had P-points which lay within±10◦of the heliographic equator (comparisons with Wind) or the latitude of Ulysses, while the in situ speeds used for the comparison come from the range of longitudes that would contribute 50% of the observed scintillation in the IPS measurement (or the width of the stream across the P-point, whichever is less). All speeds are in km/s, and the spread in speeds is given as the difference between the minimum and maximum speeds seen by IPS and the spread within in situ velocities over the longitude range for which there are IPS results. hVIPSi,hVWindiandhVUlyssesiare all calculated as unweighted means, as the variation in velocity is not normally due to statistical error in measurement or fitting. Data marked∗may be affected by the passage of a coronal mass ejection. Data shown initalictype correspond to observations of slow streams which may lie within the acceleration region of the slow solar wind or may be affected by the onset of strong scattering. In these cases values ofhVIPSi, Spread inVIPS andσ (VIPS)are given for cases when these points are included and when neglected. The IPS measurements made during CR 1963 came from slightly higher latitudes than those from Ulysses and show high-speed wind that Ulysses did not encounter. The Wind observations of the longitudes for which IPS observations near the heliographic equator are available during CR 1967 were dominated by the passage of a coronal mass ejection, apparent in the enhanced mean speed and large variation in solar wind speed measured in situ
Carrington VIPS dVkIPS VWind σ (VWind) hVIPSi hVWindi Spread in σ (VIPS) Spread in σ (VWind)
rotation VIPS VWind
CR 1953 288 190 477 38 403* 522 350* 115* 144 57
347 91 477 48 427 300 101
370 131 434 41
480 5 569 43
588 144 578 33
423 103 578 34
490 80 498 4 5
238* 151 568 31
CR 1963 431 200 462 43 462 483 402 144 205 53
320 120 453 48 452 402 144
369 93 465 57
420 78 557 62
605 50 627 102
717 141 523 38
605 73 503 50
716 350 491 53
363 114 456 19
315 107 461 39
316 67 458 47
529 116 465 52
336 22 422 18
528 3 428 27
360 54 471 57
CR 1967 371 157 455 87 372 522 1 − 195 −
372 141 650 143
CR 1976 324 137 390 55 374 454 285 92 204 76
381 125 366 56
313 171 333 28
368 175 537 61
475 8 436 40
437 98 471 31
525 170 536 27
301 136 508 55
240 155 510 58
restricted to observations with P-points, which lay between 17◦ and−3◦ heliographic latitude, the agreement between IPS and in situ speeds improved significantly, as shown in Fig. 5a. Speeds at Wind were generally higher than sug-gested by the IPS results, and there appeared to be rather
Table 5.continued ...
Carrington VIPS dVkIPS VUlysses σ (VUlysses) hVIPSi hVUlyssesi Spread in σ (VIPS) Spread in σ (VUlysses)
rotation VIPS VUlysses
CR1953 360 202 405 8 298 402 127 52 7 3
325 150 402 7 343 35 −
317 102 405 5
233 125 402 6
256 100 398 7
CR1963 504 200 352 12 638 358 212 116 14 7
716 72 357 16
693 35 366 23
CR 1976 315 131 350 27 368 364 285 140 88 29
324 137 328 15 374 91
381 125 333 10
313 171 346 16
368 175 383 30
475 8 404 42
437 98 409 51
525 170 357 91
301 136 344 88
240 155 386 98
the latitude of Ulysses and the corresponding Ulysses speeds are shown in Fig. 6a. In all cases the speeds seen by Ulysses were greater than those determined from IPS data, while the spread in flow speed dVk required to fit the IPS
measure-ments suggested a greater variation in flow speed than was apparent in the in situ measurements that corresponded to the same longitudes at 30RS.
Table 5 summarises the speed results for the four intervals. The results from CR 1953 show that IPS speeds at 27–100RS are, on average, slower than those measured near 215RSby Wind and near 1000RS by Ulysses. There is considerably more variation in the IPS speeds than those measured in situ (the spread and standard deviations of IPS speeds being about 3 times greater than the values for Wind measurements and considerably larger than the variation seen at Ulysses). IPS observations suggested enhanced flow speeds at the same longitudes as Wind measurements showed increases in solar wind speed, but some of the IPS results (near 0◦ Carring-ton longitude) indicated considerably faster flow than was seen in situ. Conversely, IPS suggested slower flow speeds than were measured in situ at longitudes where the Wind data showed the slowest flow. It should be noted that the slowest speeds observed by EISCAT are for those slow wind obser-vations closest to the Sun – it is likely that these obserobser-vations are within the slow wind acceleration region and can, there-fore, be expected to be show slower flow than measured in situ. When these points (denoted by italic type in Table 5) are eliminated from the comparison with in situ velocities, the variation in IPS speeds is still considerably greater than measured in situ, showing that the discrepancy between the data sets cannot be solely due to the acceleration of the slow
wind.
3.2 CR 1963, 11 – 28 May 2000
These data were taken near the peak of solar maximum, when the configuration of the corona and solar wind changed con-siderably in the course of a solar rotation. Wind lay at heli-ographic latitudes between−3◦ and 1◦, while Ulysses was climbing towards its southern polar pass and lay between −55◦and−57◦latitude. The observations are summarised in
Fig. 2b, while the variations with longitude of speeds deter-mined from IPS observations and measured in situ by Wind and Ulysses are compared in Figs. 3b and 4b, respectively.
When all IPS observations close in latitude to Wind were compared with ballistically-mapped Wind data (Fig. 3b), the agreement was fairly good, with lower-than-average flow speeds seen at similar longitudes in both data sets. When the IPS data set was restricted to observations from within ±10◦of the latitude of Wind (Fig. 5b), the agreement be-tween the data sets improved significantly. The IPS observa-tions again suggest a considerably greater range of solar wind speeds than the Wind measurements, particularly between 0◦ and 90◦ Carrington longitude, where sharp velocity gradi-ents were present in both data sets. The mean flow speed suggested by IPS data was higher over this rotation, but this was due to the high flow speeds near 45◦longitude. The vari-ation in IPS speeds was between 2 and 2.7 times as great as seen in the Wind measurements. These results, together with those from CR 1953, suggest that longitudinal gradients in velocity may be steeper closer to the Sun.
Ulysses path
P P P
(a)
Transient event
15 Sep
17 Sep
(b)
Rotation in Bz
(c)
of the Ulysses trajectory, projected back ballistically to 30RS, and the corresponding Ulysses speeds was very poor (Fig. 4b), with EISCAT suggesting much greater flow speeds at longitudes between 270◦ and 360◦. In contrast to the cases discussed up until now, this agreement did not improve when only IPS observations from within 10◦of the latitude of Ulysses were considered – in fact, the match became sig-nificantly worse since only the three fastest speeds observed by EISCAT remained. Careful comparison of the positions of the ray paths for the EISCAT observations and the trajec-tory of Ulysses (both mapped back ballistically to 2.5RS) with coronal white-light intensities showed that the P-points for the EISCAT observations lay at slightly higher southern latitudes than the Ulysses path, and that this small increase in latitude was enough to place the EISCAT ray paths above an equatorwards extension of the southern polar coronal hole, as shown in Fig. 7a. The EISCAT observations were, there-fore, dominated by flow from the coronal hole and the hole boundary, which would explain the high mean velocities and the large spread in velocity in one of the observations. The Ulysses measurements, by contrast, map back to above the bright corona, where slow flow would be expected – and was indeed observed.
3.3 CR 1967, 7 – 13 September 2000
During the period of these observations, the Sun was very close to maximum activity, with considerable changes ob-served in coronal structure over the two weeks of EISCAT observations. The observations are summarised in Fig. 2c, and it is apparent that during this period Ulysses lay further south than any of the good-quality IPS observations – com-parisons of IPS and in situ velocities are, therefore, restricted to EISCAT and Wind for this period.
Figure 3c compares solar wind speeds measured in situ at Wind which have been mapped back ballistically to 30RS, with velocities estimated from IPS observations at similar latitudes. There is good agreement between the measure-ments at longitudes between 340◦ and 40◦, but the most dramatic feature seen by Wind – the very sharp enhance-ment in flow speed near 190◦longitude – is not seen in EIS-CAT data from the same longitude range. During this inter-val, Wind lay at latitudes between 7.25◦ and 7.23◦. When the velocities derived from IPS observations for which the P-point lay within±10◦ of the actual latitude of Wind are
compared with the corresponding speeds measured in situ at Wind the disagreement remains obvious. Since the IPS mea-surements, which covered the longitude range where Wind detected fast flow lay very close to Wind in latitude, it does not seem possible to explain the much higher speeds seen by Wind in terms of their origin in a latitudinally-narrow near-equatorial coronal hole. Furthermore, no such feature is present in white-light coronal maps constructed from data taken over CR 1967. Examination of the plasma and field measurements made by Wind during this period reveals a sharp change in direction of the north-south component of the interplanetary magnetic field (Fig. 7c) at the same time
that enhanced flow speeds appeared (Fig. 7b). The field ro-tation and the peak in wind speed were observed at Wind on 17 September, and there had been a series of Halo events ob-served by LASCO between 15:26 UT on 15 September and 05:26 UT on 16 September. Wind observations on 16–17 September 2000 showed a maximum speed of∼900 km/s, and a CME moving out from the Sun at this speed would have taken∼46 h to reach 1 AU. The high flow speeds seen by Wind, which were not present in the IPS record, there-fore, almost certainly represent the passage of a coronal mass ejection, which was not observed by EISCAT. Away from the CME event there was good agreement between the EISCAT and in situ measurements.
3.4 CR 1976, 8 – 31 May 2001
This interval covered the Ulysses ecliptic pass, with Ulysses sweeping through from a latitude of−6◦at the start of the interval to +18◦by the end of May. Wind lay at−4◦at the start of the month, but its latitude increased through the in-terval of study. Ulysses was at its closest to the Sun during May 2001, lying about 1.35 AU (∼290RS) off the west limb of the Sun, while Wind was always close to the Sun-Earth line and, therefore, sampled the solar wind at longitudes 90◦ away from Ulysses.
The observations from May 2001 are summarised in Fig. 2d. During this interval the magnetic configuration of the Sun had become significantly simpler than it had been over the peak of solar maximum, and it was possible to com-pare results obtained when the SAIC MHD/ballistic hybrid model (Riley et al., 2001) was used to map the in situ mea-surements back to 30RS with those obtained from ballis-tic mapping. IPS observations, coming from regions much closer to the 30RS reference distance than was the case with the in situ measurements, were still mapped ballistically, as were the Wind data. Figure 3d shows the speeds measured by Wind, mapped back to 30RS, together with IPS speeds from similar latitudes. The agreement is generally good, although IPS measurements suggest that the narrow, slow stream near 130◦longitude may have been more distinct close to the Sun than at 1 AU. Once again, large values ofdVkwere needed to
obser-vations for which the P-point lay at a latitude within±10◦
of the Ulysses latitude were considered, then a very good match between the regions of lower and higher speed flow detected by EISCAT and Ulysses was apparent (Figs. 6c, d). In both cases there was substantially better agreement between the MHD-mapped Ulysses data and the IPS obser-vations (as shown in Figs. 3d and 6d) than was seen with ballistically-mapped Ulysses data (Figs. 4c and 6c).
IPS observations indicated enhanced flow speeds near 160◦longitude which were significantly greater than the cor-responding in situ measurements, although the lowest flow speeds (near 140◦longitude) were similar in both data sets. Away from the region, between longitudes of 135◦and 180◦, where there were substantial longitudinal gradients in veloc-ity, the speeds seen by EISCAT and Ulysses were similar, although the values ofdVkrequired to fit the observed IPS
spectra suggest that there might be more variation in flow speed at 30–70RS than is apparent in the in situ data. The velocities are summarised in Table 5, and the larger variation in IPS speeds is clearly apparent.
4 Discussion: mapping methods and uncertainties in results
In this paper we have employed two methods of mapping observations of different regions of the solar wind to a sin-gle reference distance of 30RS – constant-velocity ballis-tic mapping and a hybrid MHD/ballisballis-tic model developed at SAIC (Riley et al., 2001). The use of any mapping method inevitably introduces some uncertainties, and an additional level of uncertainly is introduced by the method used to de-termine which regions of the ray path of a given IPS obser-vation are immersed in fast and slow flow. This is done by ballistically mapping the IPS ray path down to 2.5RSat con-stant velocity and overlaying it on a map of white-light inten-sity in the corona – dark regions of the corona are assumed to map to fast flow and bright regions to slow. Although the solar wind does not have a constant velocity close to the Sun (the fast wind accelerating out to reach its cruising speed by 10–15RSand the slow wind accelerating strongly out to 25– 30RS, with slow acceleration at greater distances) the uncer-tainty in source longitude is relatively small, since most of the acceleration takes place close to the Sun where the angle of the Parker spiral is small. The effects of non-radial expan-sion of the solar wind should also be small outside 2.5RS, so that the largest uncertainty introduced in this stage of analy-sis is that due to the changes in coronal structure over the 27 days needed to create the white-light map. As small regions of fast flow can open and close on time scales of well under a solar rotation at solar maximum and the location of streamers change at comparable speeds, the location of regions of fast and slow wind estimated from the maps may not be identical to those prevailing at the time when the observation is being analysed. We consider that this difficulty in determining the boundaries of fast and slow streams contributes to the large values ofdVk suggested by fits to IPS observations during
the intervals considered in this paper, although the difficulty in distinguishing between variation in the bulk flow speed and random variations in the perpendicular velocity may also play a role (Canals et al., 2002). We have attempted to min-imise the effects of these uncertainties, but improvements in the IPS analysis method are probably required to obtain more certain estimates of the variation in flow speed over different regions of the ray path (as discussed in the next section).
Once a satisfactory fit had been obtained, the IPS re-sults were then mapped ballistically to a constant distance of 30RS(in all cases the velocity used for mapping the observa-tions to 2.5RS and then to 30RSwas that obtained by fitting the data, as discussed in Sect. 2). When possible (as during CR 1976), in situ data was been mapped inwards to 30RS using a hybrid MHD/ballistic model (Riley et al., 2001), in which MHD mapping is used to trace streams of solar wind in to 75RS and ballistic mapping used to trace flow from 75RS to 30RS. When this model could not be used (CR 1953, 1963, 1967), ballistic mapping employing the veloci-ties observed in situ was used to trace the observations back to 30RS.
The MHD-mapped Ulysses results shown in Fig. 6d, nev-ertheless, show rather less variation in velocity than the IPS data. This does not appear to be due to IPS observations from inside the acceleration region of the slow wind underestimat-ing its final flow speed. With the exception of the slow stream detected in the observation of 0431+206 on 23 May 2001 at 30RS, all observations at distances inside 33RSsuggested fast flow. In spite of this, the smaller variation in velocities at Ulysses should perhaps not be unexpected, since differences in velocity between adjacent streams should be suppressed by interaction as the distance from the Sun increases and the angle of the Parker spiral steepens (e.g. Pizzo and Gosling, 1994). The Ulysses data will always have these effects of prior interaction “folded into” it and might, therefore, be ex-pected to show a smaller variation in velocity than seen closer to the Sun. The MHD method does, however, minimise sys-tematic errors in the longitudes that streams are mapped to.
Hoeksema (private communication, 2001) suggested that a more physically correct methodology would be to map the IPS observations out to the distances of the in situ measure-ments. This would mean that the mapping would start with a set of observations in which the effects of prior interac-tion would be considerably smaller than in the in situ data, and subsequent interaction out to 215RSand beyond would be easy to detect as the ray paths for regions with differ-ent outflow speeds drew together or moved away from each other. We consider that this approach has considerable po-tential for improving our understanding of the evolution of velocity structures in the solar wind. Preliminary studies to test the method using a ballistic mapping appear encouraging (Canals, 2002) and we intend to extend this approach using MHD modelling in a forthcoming paper.
The large variations in velocity (the large values ofdVk)
suggested by some IPS observations may arise from uncer-tainty concerning the position of boundaries between regions of fast and slow flow (e.g. Breen et al., 2000a) or to difficulty in distinguishing between the effects of random perpendicu-lar velocities and variations in bulk outflow speed (Canals et al., 2002), although this latter effect should only be signifi-cant for slow wind observations during the passage of CMEs. Improvements to the methods used to generate the white-light maps by adopting the approach described by Wang et al. (1997) could greatly reduce the uncertainties in the posi-tion of stream boundaries, while improvements to IPS fit-ting methods – perhaps using the parameter-search meth-ods developed for forward modelling (e.g. Charbonneau, 1995) could significantly reduce the confusion between ran-dom perpendicular velocities and variations in bulk speed.
5 Conclusions and future developments
The results from periods when EISCAT IPS observations and in situ measurements were sampling solar wind from similar latitudes and longitudes and when the measurements were unaffected by transients (such as the CME seen by Wind during CR 1967) showed good agreement, with the
longi-tudinal variation in flow speed seen in IPS results and in situ measurements being very similar. This good agreement is particularly apparent in the Wind/IPS results from CR 1953, 1963 and 1976, when IPS measurements from within±10◦ latitude of the position of Wind were compared with the cor-responding in situ data (Figs. 5a, b, and d) and in the compar-ison with ecliptic-pass Ulysses data from CR 1967 (Fig. 6c and d). There was a poor match between IPS speeds and those measured in situ by Ulysses during CR 1963, which is consistent with the EISCAT measurements, at latitudes slightly south of those made by Ulysses, sampling outflow from an equatorwards extension of the southern polar hole. Ulysses had not reached these latitudes and so it did not observe this fast flow. The poor agreement between Wind measurements and IPS observations during CR 1967 is best explained by showing an Earth-directed CME passing over Wind – this CME was not detected by EISCAT since there were no observations at the right time to catch it moving out across the ray path. These two periods of poor agreement are thus easily understood, but the results of a comparison between IPS and Ulysses data during CR 1953 are, perhaps, more interesting. During this period the longitudinal varia-tion in IPS and in situ speeds was similar, with solar wind speed increasing from 270◦to 340◦longitude, but the mean speed seen in the IPS results was significantly lower than that measured in situ, while the degree of variation in the IPS speeds (both in terms of the longitudinal variation of the bulk speeds and in the spread in velocities suggested bydVk)
was significantly greater than in the in situ results (Fig. 6a). Although this was the most striking example, all observa-tions of regions where strong longitudinal gradients in solar wind speed existed showed a larger variation in velocity in IPS measurements than in situ results, with faster “fast” flow in IPS data and slower “slow” flow.
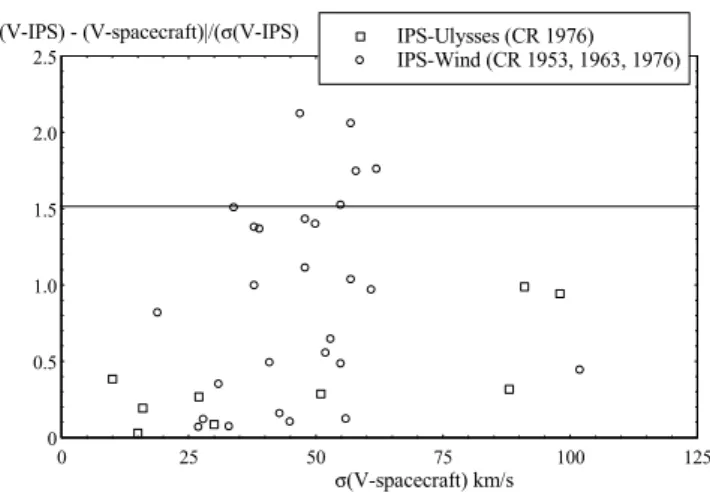
mod-elling – will be required to take full account of these effects. We have considered the variation of the differences be-tween the speeds measured by IPS and in situ, and by similar latitudes and over the same range of longitudes (IPS observa-tions from±10◦latitude of the in situ measurements, in situ measurement averaged over±20◦of the longitude of the IPS P-point or the width of the IPS stream, whichever was less) in terms of the variation of in situ velocity over the same lon-gitude range, to test whether there is indeed a clear relation-ship between longitudinal gradients in velocity and changes in velocity between the IPS and in situ measurements. Fig-ure 8 shows the difference between the velocity observed by IPS and in situ divided by the value ofdVkrequired to fit the
IPS data and plotted against the standard deviation of in situ speeds over the longitude range corresponding to each IPS data point. There is a suggestion that the difference between IPS and in situ speeds increases when there are significant longitudinal variations in the in situ speed, but the degree of correlation is low.
The success of the MHD model in mapping data from in situ measurements at 300RSto 30RSduring CR 1976 is im-portant, as we hope to use this model to extend our study closer into the Sun and compare the longitudinal variation of in situ and IPS wind speeds with the outflow velocities measured in the corona by UVCS. The IPS and in situ mea-surements during the Ulysses ecliptic pass were closely co-ordinated with UVCS observations covering heliocentric dis-tances of 2–6RS above the west limb of the Sun and with LASCO measurements. We hope to use the SAIC MHD model to relate these data sets and determine the regions of origin of streams with different velocities during this interval. A possible interpretation of the results presented in this paper is that narrow fast and slow streams are interacting to produce a solar wind at the Earth’s orbit which is less variable in velocity than that near the Sun, with discrete fast streams subsumed into growing interaction regions with intermediate velocities. This effect would become more pronounced as the distance from the Sun increases, which is consistent with the Ulysses/IPS comparisons from CR 1953, when Ulysses lay at almost 1000RS– the greatest heliocentric distance of any of the observations used in this study. The results strongly suggest that there is significant evolution taking place with distance in the solar maximum solar wind, with interaction between narrow, fast streams and flanking, slow streams, producing a wind that is less variable in velocity, although faster, on average, than the original slow wind. This, in turn, would suggest that the maximum flow speeds seen in situ at 1 AU and by Ulysses may be significantly slower than the fastest wind at the outer edge of the acceleration region. It would also be consistent with the results of 3-D simulations of the development of co-rotating interaction regions (Pizzo and Gosling, 1994) which show substantial blurring of the fast stream between 1 AU and 5 AU.
The results reported in this paper demonstrate that it is pos-sible to make quantitative comparisons of IPS and in situ measurements of specific streams of solar wind under the highly-variable conditions prevailing at solar maximum. The
0 0.5 1.0 1.5 2.0 2.5
0 25 50 75 100 125
IPS-Ulysses (CR 1976) IPS-Wind (CR 1953, 1963, 1976) |(V-IPS) - (V-spacecraft)|/(σ(V-IPS)
σ(V-spacecraft) km/s
Fig. 8. Variation of|VIPS −Vin situ|/dVk(IPS) with standard de-viation within in situ speed (σ Vin situ) over the range of longitudes occupied by the central 40◦of the IPS ray path. There is a sug-gestion that the largest discrepancies between the IPS and in situ speeds occur whenVin situis large – that is, when steep longitudi-nal gradients in velocity exist. The degree of correlation, however, is low (18% for Wind and IPS data). IPS observations which may lie in strong scattering or within the slow wind acceleration region have been omitted, as have observations which may be dominated by the passage of a CME.
task proved considerably more complex than we had initially anticipated – a common experience in studies of the solar wind at solar maximum – but has led to an improved under-standing of the problems of relating these widely-separated measurements.
The agreement between the IPS results and the in situ mea-surements improved significantly when it was possible to use the SAIC MHD mapping routines, to project the in situ mea-surements back towards the Sun, suggesting that some of the disagreement between the data sets during the earlier inter-vals considered might have been due to the shortcomings of the ballistic mapping method. We intend to develop this work using MHD modelling to trace IPS observations out to in situ distances (as discussed in Sect. 4) and by introducing addi-tional data sets in the form of UVCS measurements of veloc-ities in the corona and measurements of solar wind speeds at distances of 40–200RSfrom the 327 MHz Toyokawa IPS system (Kojima and Kakinuma, 1990), which makes consid-erably more observations per day than are possible with EIS-CAT, although it cannot observe so close to the Sun (Moran et al., 2000). We hope to present the results of this extended study in a future paper.
to thank W. A. Coles for making them available to us. The Ulysses SWOOPS data are used courtesy of D. J. McComas. The Wind SWE data are used courtesy of K. W. Ogilvie, principal investiga-tor. This work (at M.I.T.) is supported in part by NASA. Two of us (ARB – PPARC AF, RAF) were supported by PPARC during the period when this work was carried out. AC was supported by the University of Wales, Aberystwyth. The work carried out by PR was supported by the NASA Sun-Earth Interaction Theory Program.
Topical Editor M. Lester thanks R. Forsyth and another referee for their help in evaluating this paper.
References
Armstrong, J. and Coles, W. A.: Analysis of three-station interplan-etary scintillation data, J. Geophys. Res., 77, 4602–4610, 1972. Bame, S. J., McComas, D. J., Barraclough, B. L., Phillips, J. L.,
Sofaly, K. J., Chavez, J. C., Goldstein, B. E., and Sakurai, R. K.: The Ulysses solar wind plasma experiment, Astron. Astrophys. Suppl., 922, 237, 1992.
Behannon, K. W., Burlaga, L. F., and Hewish, A.: Structure and evolution of compound streams at less than or equal to 1 AU, J. Geophys. Res., 96, 21 213–21 225, 1991.
Bothmer, V. and Schwenn, R.: The structure and origin of magnetic clouds in the solar wind, Ann. Geophysicae, 16, 1–24, 1998. Bourgois, G., Coles, W. A., Daigne, G., Silen, J., Turunen, T., and
Williams, P. J. S.: Measurements of the solar wind speed with EISCAT, Astron. Astrophys., 144, 452–462, 1985.
Breen, A. R., Coles, W. A., Grall, R. R., Klinglesmith, M. T., Markkanen, J., Moran, P. J., Tegid, B., and Williams, P. J. S.: EISCAT measurements of the solar wind, Ann. Geophysicae, 14, 1235–1245, 1996.
Breen, A. R., Moran, P. J., Varley, C. A., Wilkinson, W. P., Williams, P. J. S., Coles, W. A., Lecinski, A., and Markkanen, J.: Interplanetary scintillation observations of interaction regions in the solar wind, Ann. Geophysicae, 16, 1265–1282, 1998. Breen, A. R., Mikic, Z., Linker, J. A., Lazarus, A. J., Thompson, B.
J., Moran, P. J., Varley, C. A., Williams, P. J. S., Biesecker, D. A., and Lecinski, A.: Interplanetary scintillation measurements of the solar wind during Whole Sun Month: linking coronal and in situ observations, J. Geophys. Res., 104, 9847–9870, 1999. Breen, A. R., Moran, P. J., Varley, C. A., Williams, P. J. S.,
Lecin-ski, A., Thompson, B. J., and Harra-Murnion, L.: Interplanetary scintillation measurements of the solar wind above low-latitude coronal holes, Adv. Space. Res., 26(5), 790–792, 2000a. Breen, A. R., de Forest, C. F., Thompson, B. J., McKenzie, J. F.,
Modigliani, A., Moran, P. J., Varley, C. A., and Williams, P. J. S.: Comparisons of interplanetary scintillation and optical measure-ments of solar wind acceleration with model results, Adv. Space Res., 26(5), 781–784, 2000b.
Breen, A. R., Tappin, S. J., Jordan, C. A., Thomasson, P., Moran, P. J., Fallows, R. A., Canals, A., and Williams, P. J. S.: Simul-taneous interplanetary scintillation and optical measurements of the acceleration of the slow solar wind, Ann. Geophysicae, 18, 995–1002, 2000c.
Breen, A. R., Thompson, B. J., Kojima, M., Biesecker, D. A., Canals, A., Fallows, R. A., Linker, J. A., Lazarus, A. J., Mi-kic, Z., Moran, P. J., and Williams, P. J. S.: Measurements of the Solar Wind over a wide range of heliocentric distances – a comparison of results from the first three Whole Sun Months, J. Atmos. Sol.-Terr. Phys., 62, 1527–1544, 2000d.
Breen, A. R., Canals, A., Fallows, R. A., Moran, P. J., and Kojima, M.: Large-scale structure of the solar wind from interplanetary
scintillation measurements during the rising phase of cycle 23, Adv. Space Res., 29(3), 379–388, 2002a.
Breen, A. R., Thomasson, P., Jordan, C. A., Tappin, S. J., Fallows, R. A., Canals, A., and Moran, P. J.: Interplanetary scintillation and optical measurements of slow and fast solar wind accelera-tion near solar maximum, Adv. Space Res., in press, 2002b. Brueckner, G. E., Howard, R. A., Koomen, M. J., Korendyke, C. M.,
Michels, D. J., Moses, J. D., Socker, D. G., Dere, K. P., Lamy, P. L., Llebaria, A., Bout, M. V., Schwenn, R., Simnett, G. M., Bedford, D. K., and Eyles, C. J.: The large-angle spectroscopic coronagraph (LASCO), Sol. Phys., 162, 357–402, 1995. Burlaga, L. F.: Interplanetary stream interfaces, J. Geophys. Res.,
79, 3717–3725, 1974.
Canals, A.: Interplanetary scintillation studies of the solar wind near solar maximum, Ph.D. thesis, to be submitted to the University of Wales, April, 2002.
Canals, A., Breen, A. R., Ofman, L., Moran, P. J., and Fallows, R. A.: Estimating random transverse velocities in the fast solar wind from EISCAT Interplanetary scintillation measurements, Ann. Geophysicae, (this issue), 2002.
Charbonneau, P.: Genetic algorithms in astronomy and astro-physics, Astrophys. J.(supp.), 101, 309–334, 1995.
Coles, W. A., Esser, R., Løvhaug, U.-P., and Markkanen, J.: Com-parison of solar wind velocity measurements with a theoretical acceleration model, J. Geophys. Res., 96, 13 849–13 859, 1991. Coles, W. A.: Interplanetary scintillation observations of the
high-latitude solar wind, Space. Sci. Rev., 72, 211–222, 1995. Coles, W. A.: A bimodal model of the solar wind, Astrophys. Space
Sci., 243, 87–96, 1996.
Dennison, P. A. and Hewish, A.: The solar wind outside the plane of the ecliptic, Nature, 213, 343–346, 1967.
Fallows, R. A.: Studies of the solar wind throughout a solar cycle, Ph.D. Thesis, University of Wales, Aberystwyth, 2001. Fallows, R. A., Breen, A. R., Moran, P. J., Canals, A., and Williams,
P. J. S.: The high-latitude solar wind in EISCAT IPS data, 1991– 1999, Adv. Space Res., in press, 2002a.
Fallows, R. A., Williams, P. J. S., and Breen, A. R.: EISCAT mea-surements of solar wind speed and the associated level of inter-planetary scintillation, Ann. Geophysicae, (this issue), 2002b. Gazis, P. R.: Synoptic maps of solar wind parameters from in
situ spacecraft observations, J. Geophys. Res., 100, 3383–3393, 1995.
Gosling, J. T., Hundhausen, A. J., Pizzo, V., and Asbridge, J. R.: Compressions and rarefactions in the solar wind: Vela 3, J. Geo-phys. Res., 77, 5442–5454, 1972.
Grall, R. R.: Remote sensing observations of the solar wind near the sun, Ph.D. Thesis, University of California, San Diego, 1995. Grall, R. R., Coles, W. A., Klinglesmith, M. T., Breen, . R., Williams, P. J. S., and Esser, R.: Rapid acceleration of the po-lar sopo-lar wind, Nature, 1996.
Hewish, A., Scott, P. F., and Willis, D.: Interplanetary scintillation of small-diameter radio sources, Nature, 203, 1214–1217, 1964. Hyder, C. L. and Lites, B.W.: Ha Doppler brightening and Lyman-a Doppler dimming in moving HLyman-a prominences, Sol. Phys., 14, 147–158, 1970.
Klinglesmith, M. T.: The polar solar wind from 2.5 to 40 solar radii: results of intensity scintillation measurements, Ph.D. thesis, Uni-versity of California, San Diego, 1997.
M. C. E., Antonucci, E., Benna, C., Giordano, S., Tondello, G., Nicolosi, P., Naletto, G., Pernechele, C., Spadaro, D., Poletto, G., Livi, S., Von der Luhe, O., Geiss, J., Timothy, J. G., Gloeckler, G., Allegra, A., Basile, G., Brusa, R., Wood, B., Seigmund, O. H. W., Fowler, W., Fisher, R., and Jhabvala, M.: The ultraviolet coronagraph spectrometer for the solar and heliospheric observa-tory, Sol. Phys., 162, 213–356, 1995.
Kojima M. and Kakinuma, T.: Solar-cycle dependence of global distribution of solar wind speed, Space Sci. Rev., 53, 173–222, 1990.
Kojima, M., Tokumaru, M., Watanabe, H., Yokobe, A., Asai, K., Jackson, B. V., and Hick, P. L.: Heliospheric tomography using interplanetary scintillation observations – 2: Latitude and helio-centric distance dependence of solar wind structure at 0.1 – 1 AU, J. Geophys. Res., 103, 1981–1989, 1998.
Krieger, A. S. and Timothy, A. F.: A coronal hole and its identi-fication as the source of a high velocity solar wind stream, Sol. Phys., 29, 505–525, 1973.
Leinart, C. and Jackson, B. V.: The global solar wind changes over cycle 21: A combination of Helios photometer, in situ and inter-planetary scintillation data, Astrophys. J., 505, 984–992, 1998. Linker, J. A., Mikic, Z., Biesecker, D. A., Forysth, R. J., Gibson,
S. E., Lazarus, A. J., Lecinski, A. A., Riley, P., Szarbo, A., and Thompson, B. J.: Magnetohydrodynamic modelling of the solar corona during Whole Sun Month, J. Geophys. Res., 104, 9809– 9830, 1999.
McComas, D. J., Barraclough, B. L., Funsten, H. O., Gosling, J. T., Santiago-Munoz, E., Skoug, R. M., Goldstein, B. E., Neugebauer, M., Riley, P., and Balogh, A.: Solar wind observa-tions over Ulysses’ first polar orbit, J. Geophys. Res., 105(A5), 10 419–10 433, 2000.
Massey, W.: Measuring Intensity Scintillations at the Very Long Baseline Array (VLBA) to probe the solar wind near the Sun, M.Phil. Thesis. University of California, San Diego, 1998. Mikic, Z. and Linker, J. A.: The large-scale structure of the solar
corona and inner heliosphere, in Solar Wind Eight, (Eds) Win-terhalter, D., et al., A.I.P. Conf. Proc., College Park, Md., 382, pp. 104, 1996.
Miyake, W., Kobayashi, K., Oyama, K. I., Mukai, T., Abe, T., Tere-sawa, T., Saito, T., Hirao, K., Lazarus, A. J., and Johnstone, A. D.: Multi-spacecraft observations of heliographic structure of the solar wind speed, Planet. Space Sci., 36, 1329–1342, 1988. Moran, P. J., Breen, A. R., Canals, A., Markkanen, J., Janardhan, P.,
Tokumaru, M., and Williams, P. J. S.: Observations of interplane-tary scintillation during the 1998 whole sun month: a comparison between EISCAT, ORT and Nagoya data, Ann. Geophysicae, 18, 1003–1008, 2000.
Neupert, W. M. and Pizzo, V.: Solar coronal holes as sources of recurrent geomagnetic disturbances, J. Geophys. Res., 79, 3701– 3709, 1974.
Nolte, J. T., Krieger, A. S., Timothy, A. F., Gold, R. E., Roelof, E. C., Vaiana, G., Lazarus, A. J., Sullivan, J. D., and McIntosh, P. S.: Coronal holes as sources of solar wind, Sol. Phys., 46, 303–322, 1976.
Ogilvie, K. W., Chorney, D. J., Fitzenreiter, R. J., Hunsaker, F., Keller, J., Lobell, J., Miller, G., Scudder, J. D., Sittler, Jr., E. C., Torbert, R. B., Bodet, D., Needell, G., Lazarus, A. J., Steinberg, J. T., Tappan, J. H., Mavretic, A., and Gergin, E.: SWE, a com-prehensive plasma instrument for the Wind spacecraft, Space Sci. Rev, 71, 55–77, 1995.
Phillips, J. L., Balogh, A., Bame, S. J., Goldstein, B. E., Gosling, J. T., Hoeksema, J. T., McComas, D. J., Neugebauer, M.,
Shee-ley, N. R., and Yang, Y. M.: Ulysses at 50◦south: Constant immersion in the high speed solar wind, Geophys. Res. Lett., 12, 1105–1108, 1994.
Pizzo, V.: 2-D corotating stream fronts near the ecliptic plane in the inner solar wind, J. Geophys. Res., 94, 8673–8684, 1989. Pizzo, V. J. and Gosling, J. T.: 3-D simulation of high-latitude
inter-action regions: comparison with Ulysses results, Geophys. Res. Lett., 21, 2063–2066, 1994.
Rao, A., Pramesh, S., Ananthakrishnan, V., Balasubramanian, V., and Coles, W. A.: Very long baseline IPS observations of the solar wind speed in the fast polar streams, Proceedings of Inter-national Solar Wind 8 Conference, p. 94, 1995.
Rhodes, E. J. and Smith, E. J.: Multi-spacecraft observations of the heliographic latitude-longitude structure in the solar wind, J. Geophys. Res., 86, 8877–8892, 1981.
Rickett, B. J. and Coles, W. A.: Evolution of the solar wind structure over a solar cycle: Interplanetary scintillation speed measure-ments compared with coronal observations, J. Geophys. Res., 96,(A2), 1717–1736, 1991.
Riley, P., Gosling, J. T., McComas, D. J., Pizzo, V. J., Luhmann, J. G., Biesecker, D. A., Forsyth, R. J., Hoeksema, J. T., Lecinski, A., and Thompson, B. J.: Relationship between Ulysses plasma observations and solar observations during the Whole Sun Month campaign, J. Geophys. Res., 104, 9871–9879, 1999.
Riley, P., Linker, J. A., and Mikic, Z.: An empirically-driven global MHD model of the solar corona and inner heliosphere, J. Geo-phys. Res., 106, 15 889–15 901, 2001.
Rishbeth, H. and Williams, P. J. S.: Ionospheric Radar: the system and its early results, Mon. Not. R. Astr. Soc., 26, 478–512, 1985. Sarabhai, V.: Some consequences of nonuniformity of solar wind
velocity, J. Geophys. Res., 68, 1555–1557, 1963.
Schwenn, R.: Large-Scale structures of the interplanetary medium, in: Physics of the inner heliosphere 1, (Eds) Schwenn, R. and Marsch, E., pub. Springer, Berlin Heidleberg, New York, pp. 99– 181, 1990.
Sheeley, N. R., Wang, Y. M., Hawley, S. H., Brueckner, G. E., Dere, K. P., Howard, R. A., Koomen, M. J., Korendyke, C. M., Michels, D. J., Paswaters, S. E., Socker, D. G., St. Cyr. O. C., Wang, D., Lamy, P. L., Llebaria, A., Schwenn, R., Simnett, G. M., Plunkett, S., and Biesecker, D. A.: Measurements of flow speeds in the corona between 2 and 30 R-circle dot, Astrophys. J., 484, 472–478, 1997.
Snyder, C. W. and Neugebauer, M.: The relation of Mariner 2 plasma data to solar phenomena, in: The Solar Wind, (Eds) Mackin, R. J. and Neugebauer, M., Pergamon Press, New York, pp. 25–34, 1966.
Spangler, S. R. and Sakurai, T.: Radio interferometer observations of solar wind parameters from the orbit of Helios to the solar corona, Astrophys. J., 445, 999–1016, 1995.
Tappin, S. J., Simnett, G. M., and Lyons, M. A.: A determination of the outflow speeds in the lower solar wind, Astron. Astrophys., 350, 302–309, 1999.
Wang, Y.-M., Sheeley, N. R., Howard, R. A., Kraemer, J. R., Rich, N. B., Andrews, M. D., Brueckner, G. E., Dere, K. P., Koomen, M. J., Korendyke, C. M., Michels, D. J., Moses, J. D., et al. : Ori-gin and evolution of coronal streamer structure during the 1996 minimum activity phase, Astrophys. J., 485, 875–889, 1997. Woch, J., Axford, W. I., Mall, U., Wilken, B., Livi, S., Geiss, J.,