Article
Printed in Brazil - ©2016 Sociedade Brasileira de Química0103 - 5053 $6.00+0.00*e-mail: [email protected]
#Present address: Section for Sustainable Biotechnology, Aalborg
Univer-sity Copenhagen, A. C. Meyers Vænge 15, 2450 Copenhagen SV, Denmark
Ethanol Production from Sugarcane Bagasse Using Phosphoric Acid-Catalyzed
Steam Explosion
Ana Paula Pitarelo,a,b César S. da Fonseca,#,c Luana M. Chiarello,a Francisco M. Gírioc
and Luiz P. Ramos*,a,d
aCentro de Pesquisa em Química Aplicada (CEPESQ), Departamento de Química, Universidade
Federal do Paraná, P.O. Box 19081, 81531-980 Curitiba-PR, Brazil
bCentro de Tecnologia Canavieira, CTC, P.O. Box 162, 13400-970 Piracicaba-SP, Brazil
cNational Laboratory of Energy and Geology, I.P. (LNEG), Bioenergy Unit, Estrada do Paço, 22,
1649-038 Lisbon, Portugal
dINCT de Energia e Ambiente, INCT E&A, Universidade Federal do Paraná,
81531-990 Curitiba-PR, Brazil
The steam explosion was carried out in the absence (autohydrolysis) and presence of phosphoric acid to evaluate the effects of temperature (180 and 210 °C), acid concentration (0 and 19 mg g-1, dry basis) and pretreatment time (5 and 10 min) on the structure and reactivity of sugarcane bagasse. Glucan recovery was used as the main response factor for pretreatment optimization through a central composite design. Autohydrolysis at 210 °C for 10 min had a good pretreatment performance but phosphoric acid catalysis (19 mg g-1) resulted in better yields under considerably milder conditions (180 °C, 5 min). Hydrolysis of both substrates for 96 h using 8 wt.% total solids and 30 mg g-1 Cellic® CTec2 (Novozymes) provided total glucose yields of 75% in average. The production of cellulosic ethanol was assessed by both separate and simultaneous hydrolysis and fermentation using Saccharomyces cerevisiae. Freeze-drying of pretreatment water solubles reduced
the concentration of furfural, hydroxymethylfurfural and acetic acid by more than 80% and this eliminated their inhibitory effect on yeast fermentation.
Keywords: sugarcane bagasse, steam explosion, phosphoric acid, enzymatic hydrolysis, cellulosic ethanol
Introduction
Ethanol is one of the most important renewable liquid biofuels and its use in large scale contributes directly to the reduction of the environmental impact of fossil fuels, particularly in the transportation sector. First generation production technologies are able to convert sucrose or starch hydrolysates into fuel ethanol while second generation technologies are based on the use of lignocellulosic materials for the same purpose. However, this latter production process is much more complicated because it involves different unit operations including raw material preparation, pretreatment, washing to remove inhibitors, enzymatic hydrolysis, hexose and/or pentose fermentation, ethanol recovery and effluent treatment.1-3
Pretreatment is a key step for the successful chemical or biotechnological processing of lignocellulosic materials because it is responsible for the break-down of the chemical association that exist among the main macromolecular components of plant cell wall, cellulose, hemicelluloses and lignin. Hence, a suitable pretreatment method must remove structural barriers that limit the conversion of these materials to fuels and chemicals.1-5 According to Balat et al.1
pretreatment must produce substrates that can be easily converted to fermentable sugars by acid or enzymatic hydrolysis and prevent the release of inhibitors for the subsequent steps of hydrolysis and fermentation. Besides, an ideal pretreatment method must be economically viable and environmentally friendly.
Steam explosion has been proposed as one of the most efficient methods to deconstruct the plant cell wall
macromolecular organization.5-8 This process acts both
to high pressure steam at temperatures ranging from 170 to 230 °C for reaction times varying from 2 to 30 min in the absence or presence of an exogenous acid or basic catalyst. When pretreatment is performed in the presence of an acid catalyst, such as in the case of sulfuric (H2SO4)
or phosphoric (H3PO4) acids, the requirements for time
and temperature are decreased considerably, depending on the acid strength and its actual concentration in relation to the biomass dry mass. Also, hemicelluloses are almost completely removed and lignin is modified to a deeper extend, leading to cellulosic materials that are more susceptible to acid or enzymatic hydrolysis.4,6-9
The use of dilute H3PO4 as a pretreatment catalyst,
compared to strong acids such as H2SO4, results in lower
sugar losses and less accumulation of furan compounds in the reaction medium.10-13 Also, H
3PO4 is less corrosive
and can act as an additional source of nutrients for microbial growth, particularly in the form of ammonium phosphate.9,13 By contrast, the drawbacks are that H
3PO4
is more expensive than H2SO4, it is not commercially
available in high purity inasmuch as other mineral acids and, when present in waste waters at high concentration levels, it can accelerate eutrophication by interfering with the phosphorus cycle.14,15
The next stage in cellulosic ethanol production is the enzymatic hydrolysis of plant polysaccharides (cellulose and hemicelluloses) into fermentable sugars. A variety of commercial enzymes have been made available for this purpose by companies such as Iogen (Canada), Onozuka (Japan), Novozymes (Denmark), DSK (Netherlands) and Genencor (United States of America), among others. In
2009, Novozymes launched the Cellic CTec® product
line containing a full mixture of cellulases that does not
require supplementation with exogenous β-glucosidase
activity for optimal performance, a step forward in relation to Celluclast 1.5L FG that was originally developed for
applications in the food industry (food grade). Cellic®
CTec2 corresponds to the second generation of these enzymes and many studies have already shown its superior performance for a variety of feedstocks, pretreatment technologies and process designs.8,16
Ethanol can be produced from substrate hydrolysates by fermentation of pentoses (C5 fraction) and hexoses (C6 fraction). The efficient co-fermentation of these sugar streams is challenging because they follow different metabolic pathways that are rarely found together in naturally occurring microorganisms but developments in genetic and/or metabolic engineering have already achieved excellent results during the last decade or so.17-19
Alternatively, co-fermentation of C5 and C6 may be accomplished by utilizing a mixed culture containing two or
more organisms that are able to ferment both sugar streams separately.20 In acid-based pretreatment technologies, the
C5 stream arises from pretreatment whereas the C6 stream is primarily a result of enzymatic hydrolysis. Many process configurations have been used to optimize the production of cellulosic ethanol but the most widely accepted ones include the separate hydrolysis and fermentation (SHF) and the simultaneous saccharification and fermentation (SSF). In general, SHF has the advantages of allowing yeast recycling and of carrying out both hydrolysis and fermentation at their optimal conditions but a complete sugar uptake is hardly achievable due to a cross-contamination of C5 and C6 in both unit operations. By contrast, no yeast recycling is allowed in SSF and a compromised has to be reached between hydrolysis and fermentation as they usually require different conditions for optimal performance.
The aim of this work was to evaluate the effects of
H3PO4-catalysed steam explosion on the chemistry of
sugarcane bagasse and to correlate these changes with the subsequent steps of enzymatic hydrolysis and fermentation to produce cellulosic ethanol using both SHF and SSF strategies.
Experimental
Material
Sugarcane bagasse was obtained from the São Martinho Mill (São Paulo, SP, Brazil) with the technical help of the Cane Technology Center staff (CTC, Piracicaba, SP, Brazil). The commercial enzyme preparation used
for hydrolysis (Cellic® CTec2) was kindly provided by
Novozymes Latin America (Araucária, Brazil).
The yeast strain used for fermentation was the
Saccharomyces cerevisiae PYCC 4072, which was
obtained from the Yeast Collection of Portugal. This strain was originally isolated from a commercial wine making
dry yeast preparation called Fermivin®, and was kindly
provided by Oenobrands (Montpellier, France).
Methods
Chemical characterization of sugarcane bagasse before and after pretreatment
method T204 om-88. Afterwards, a hot-water extraction was performed following the TAPPI standard method T264 om-88. Acid-insoluble lignin was determined gravimetrically in three replicates using extractive-free cane biomass according to NREL/TP-510-42618 technical report while acid-soluble lignin was determined in biomass acid hydrolysates using ultraviolet spectrophotometry (NREL/TP-510-42617). The biomass total carbohydrate content was determined in acid hydrolysates by high performance liquid chromatography (Agilent HPLC model 1200 Infinity) using an Aminex HPX-87H column (Bio-Rad, Hercules, USA) at 65 °C that was eluted with 5 mmol L-1 H
2SO4 at a flow rate of 0.6 mL min-1. Detection
was performed by differential refractometry at 40 °C and quantification was based on external calibration using standard solutions of cellobiose, glucose, xylose, arabinose and acetic acid. Finally, each of these individual components was converted to their original cane biomass polysaccharides by taking into account their respective hydrolysis factors, which correspond to 0.95 for cellobiose, 0.90 for glucose, 0.88 for xylose and arabinose, and 0.72 for acetic acid.21
Pretreatment of sugarcane bagasse by steam explosion
Steam explosion was performed by loading bagasse directly into a 10-L steam reactor. After pretreatment for a given temperature and residence time, the steam-treated bagasse was released from the reaction vessel by rapid depressurization to atmospheric, causing the material to expand (explode) into a stainless steel cyclone that was provided with a stainless steel recipient for sample collection. Cane bagasse (around 500 g, dry basis) was pretreated under different conditions of temperature and time with and without the catalytic assistance of phosphoric acid (Table 1). Eight experiments were initially performed in random order as part of a 23 factorial design using bagasse
with a final 50 wt.% moisture content. In addition, six more experiments were carried out at the axial points of the factorial design to complete a central composite design (CCD), which involved fourteen experiments plus a center point that was performed in three replicates.
The lower limits of the CCD were carried out without acid impregnation (autohydrolysis), whereas all of the other experiments involved acid impregnation with dilute
H3PO4. Acid impregnation was carried out by spraying
air-dried cane bagasse (8-10% moisture content) with dilute phosphoric acid at room temperature to arrive at the moisture content of 50 wt.%. These samples were packed in vacuum-sealed plastic bags and stored at 8 °C prior to pretreatment. The bags, already at room temperature, were opened minutes before loading them into the reaction vessel to prevent any loss of moisture. Also, the center point of the
CCD was performed in three replicates and these served to calculate the variance of the entire experimental procedure.
The resulting steam-treated materials were divided in two equal parts. One part was stored at 4 °C and submitted to enzymatic hydrolysis and fermentation without any further treatment in order to evaluate the inhibitory effect of water-soluble compounds that were released during pretreatment. This unwashed steam-treated bagasse was named STB-UW. The other part was drained out in a Büchner funnel and pressed until 30 wt.% total solids (TS). This way, two fractions were obtained, one water-soluble named STB-WS and another fibrous material that was washed with water at 5 wt.% TS for 1 h at ambient temperature and drained out once again in a Büchner funnel to produce the water-washed steam-treated bagasse (STB-WW). Glucan recovery yields were calculated in relation to the glucan present in the untreated lignocellulosic material (native bagasse). This fraction was stored in a vacuum-sealed plastic bag at 4 °C for chemical characterization and further use for enzymatic hydrolysis and fermentation, while both STB-WS and the filtrate of the water-washing step were analyzed by HPLC after dilute sulfuric hydrolysis according to NREL/TP-510-42623.
Water-soluble carbohydrates, acetic acid and dehydration by-products (furfural and hydroxymethylfurfural) were analyzed in substrate acid hydrolysates using an Aminex HPX-87H column (Bio-Rad, Hercules, USA) as mentioned above. Also, aliquots of the STB-WS fractions (50 mL) were placed in Jouan LP3 freeze-drier and the resulting solids were stored for HPLC analysis as well as for evaluation of their inhibitory effect on yeast fermentation.
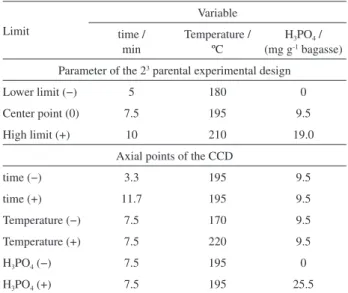
Table 1. Central composite design (CCD) that was built to investigate the effect of H3PO4 in the steam explosion of sugarcane bagasse
Limit
Variable
time / min
Temperature / ºC
H3PO4 /
(mg g-1 bagasse)
Parameter of the 23 parental experimental design
Lower limit (−) 5 180 0
Center point (0) 7.5 195 9.5
High limit (+) 10 210 19.0
Axial points of the CCD
time (−) 3.3 195 9.5
time (+) 11.7 195 9.5
Temperature (−) 7.5 170 9.5
Temperature (+) 7.5 220 9.5
H3PO4 (−) 7.5 195 0
Enzymatic hydrolysis of steam-treated substrates
Enzymatic hydrolyses were performed at 45 °C and
150 rpm for 96 h using 8 wt.% TS in sodium acetate buffer 50 mmol L-1, pH 4.8. Each hydrolysis run was carried out
in three replicates using 30 mg of Cellic CTec2 g-1 TS,
which corresponds to a total filter paper activity of
4.05 FPU g-1 TS according to the method proposed by
Ghose.22 Glucose equivalents (GlcEq) derived from
enzymatic hydrolysis were expressed in relation to the amount of glucose originally present in cane bagasse. Such GlcEq values represent the summation of glucose and cellobiose that was released as a result of hydrolysis. For this purpose, a conversion factor of 1.0526 was used to convert cellobiose to glucose.
Fermentation of enzymatic hydrolysates
SHF experiments were performed in duplicate using the enzyme hydrolysate of selected STB-UW and STB-WW substrates. In this case, enzymatic hydrolyses were performed at 12 wt.% TS with 62.5 mg (wet basis) of Cellic CTec2 g-1 TS or 8.4 FPU g-1 TS22 under the same
experimental conditions described above. The SHF trials
were performed in 50 mmol L-1 sodium acetate buffer
(pH 4.8) containing 1.0 g L-1 yeast extract, 0.5 g L-1
(NH4)2PO4, 0.025 g L-1 MgSO4.7H2O, and 1.0 g L-1
inoculum of S. cerevisiae PYCC 4072 yeast cells. The
experiments were performed in an orbital shaker incubator at 35 °C and 150 rpm for 24 h. Aliquots were withdrawn every 3 h for HPLC analysis, with glucose and ethanol being monitored using the same chromatographic procedure described above.
The SSF experiments were carried out without pre-hydrolysis, meaning that enzymes and yeast were added simultaneously to the substrate slurry. These assays were performed at 35 °C with the same substrates and medium composition used for SHF, using 12 wt.% TS,
62.5 mg Cellic CTec 2 g-1 TS and 1 g L-1 of PYCC 4072
in an orbital shaker incubator at 150 rpm for 96 h. Aliquots were withdrawn and analyzed by HPLC using the same chromatographic procedure described above.
Statistical analysis
The effect of pretreatment on glucan recovery was evaluated using a mathematical model that was built with the Statistica 13.0 software. The model was based on multiple linear regression and its statistical significance was evaluated by analysis of variance (ANOVA). The individual and combined effects of pretreatment variables on the response function were also determined and presented as a Pareto’s chart.
Results and Discussion
Pretreatment
Table 2 reports the mass recovery yields of both water-soluble (STB-WS) and water-washed (STB-WW) fractions that were produced from cane bagasse by steam explosion, as well as the chemical composition of both native bagasse and STB-WW fractions. The center point of the factorial design (experiments B05-B07) generated an average mass recovery yield of 81.95 ± 1.30%, which corresponded to 20.03 ± 1.95% of STB-WS and 61.93 ± 1.47% of STB-WW. Hence, relatively low standard deviations were obtained in this work, demonstrating the good repeatability of the pretreatment data.
Regardless of the conditions used for pretreatment, both anhydroglucose and lignin contents increased in STB-WW compared to native bagasse. These results are mainly attributed to the acid hydrolysis of hemicellulose components. The use of higher temperatures, times and phosphoric acid concentrations led to the almost complete removal of hemicelluloses from STB-WW as observed in experiments B03, B04, B15, B16 and B17 of Table 2. Unlike cellulose, hemicelluloses are low molecular mass branched heteropolysaccharides with varying degrees of acetylation whose accessibility to hydrolysis is much higher, even at relatively mild acid pretreatment conditions.
The STB-WS fractions derived from pretreatment were also analyzed by HPLC to reveal their total carbohydrate content as well as their contamination with potential
inhibitors for hydrolysis and fermentation (Table 3).
However, carbohydrate analyses were carried out after post-hydrolysis with dilute sulfuric acid because the HPLC system used in this study was not able to resolve and/or quantify oligosaccharides of different chemical compositions. Nevertheless, it was clear from the HPLC profiles that, when pretreatment was carried out in the presence of phosphoric acid, lower oligosaccharide concentrations were observed in the STB-WS fractions along with a corresponding increase in the relative concentration of monosaccharides (glucose, xylose and arabinose). High xylose recoveries were obtained under these conditions but a considerable amount of glucose was also identified at increased pretreatment strengths. The use of H3PO4 increased at least three times the concentration
ratio in STB-WS was always high after post-hydrolysis with dilute sulfuric acid. These results are also indicating that most of the water-soluble carbohydrates that were released by phosphoric acid-catalyzed steam explosion were originated from cane bagasse heteroxylans.
In general, more drastic pretreatment conditions led to the accumulation of inhibitory compounds
to both hydrolysis and fermentation.23 Furfural and
hydroxymethylfurfural (HMF) were derived from dehydration of pentoses and hexoses, respectively, while acetic acid accumulated as a result of hemicellulose deacetylation. In addition, phosphoric acid impregnation caused a substantial increase in the accumulation of furan compounds in the STB-WS fractions, with furfural always being found in concentrations much higher than HMF.
The glucan recovery obtained in water-washed steam-treated substrates (STB-WW) is presented in Table 4. These values were fit by a mathematical model whose analysis of variance in shown in Table 5. The quadratic equation that best adjusted the experimental data was:
AnGlc (%) = 90.74 – 3.00t – 6.68T – 4.14C + 0.83t2 –
4.09T2 – 1.45C2 – 2.22tT – 0.06tC – 1.31TC (1)
where t is reaction time (min), T is the pretreatment temperature (°C) and C is the concentration of the acid catalyst (mg H3PO4 g -1 bagasse).
The high F value for the regression (21.06) and the low F value for the lack of fit (3.31), both in relation to the corresponding Ftab values, showed that there is a tendency in
the proposed quadratic model and this was confirmed by the high values of the regression coefficient (R2 = 0.9644) and
the maximum explained variance (%Var = 99.62) (Table 5). These values were useful to validate the mathematical model and confirm the statistical significance of the experimental data. By this, the recovery of fermentable sugars could be maximized, being an important tool to demonstrate the viability of cellulosic ethanol production from steam-treated cane bagasse using this pretreatment technology.
The Pareto chart of Figure 1 shows the effect of the process variables on the glucose yield obtained after pretreatment. All first order effects were significant and had a negative effect on glucan recovery. The pretreatment temperature was the most significant process variable, corresponding to –13.37 points percent (p.p.), followed by acid impregnation (–8.28 p.p.) and reaction time (–6.01 p.p.). As expected, Table 2. Recovery yield of pretreatment fractions and chemical composition of cane bagasse before and after pretreatment
Sample
Condition Recoverya / % STB-WW chemical composition / %
Temperature / °C
time / min
[H3PO4] /
(mg g-1) STB-WS STB-WW AnGlcb AnXylc AnArac Acetylc Lignind Ash
Native − − − − − 38.0 ± 0.1 18.9 ± 0.1 3.3 ±0.1 3.5 ± 0.2 20.8 ± 0.3 6.5 ± 0.2
B01 180 5 − 12.2 76.2 47.7 ± 0.2 7.2 ± 0.2 2.6 ± 0.2 1.0 ± 0.1 31.1 ± 0.8 3.1 ± 0.2
B02 180 10 − 15.2 70.5 48.9 ± 0.2 4.1 ± 0.1 0.9 ± 0.1 0.6 ± 0.1 33.0 ± 2.1 5.8 ± 0.1
B03 210 5 − 14.0 69.2 50.9 ± 0.5 bdl bdl bdl 38.1 ± 0.1 6.6 ± 0.3
B04 210 10 − 17.6 64.1 45.3 ± 0.6 bdl bdl bdl 37.7 ± 0.1 6.4 ± 0.9
B05e 195 7.5 9.5 20.0 60.8 51.1 ± 1.4 2.6 ± 0.1 bdl 0.5 ± 0.1 31.5 ± 0.5 10.2 ± 0.7
B06e 195 7.5 9.5 22.0 61.4 51.0 ± 1.6 2.4 ± 0.2 bdl 0.4 ± 0.1 33.5 ± 0.5 9.7 ± 0.8
B07e 195 7.5 9.5 18.1 63.6 51.4 ± 1.0 2.3 ± 0.2 bdl 0.6 ± 0.1 33.7 ± 0.3 9.6 ± 0.1
B08 180 5 19 14.2 68.3 52.0 ± 0.2 6.9 ± 0.1 0.6 ± 0.1 bdl 31.0 ± 0.8 6.9 ± 0.4
B09 180 10 19 15.9 62.7 55.3 ± 0.5 4.2 ± 0.1 0.4 ± 0.1 bdl 30.0 ± 0.7 8.2 ± 0.1
B10 210 5 19 16.5 64.5 56.6 ± 0.2 1.8 ± 0.2 bdl bdl 31.5 ± 0.1 8.1 ± 0.2
B11 210 10 19 17.0 62.5 54.7 ± 0.2 1.1 ± 0.1 bdl bdl 33.0 ± 0.3 9.2 ± 0.2
B12 195 3.3 9.5 11.1 79.5 47.6 ± 0.5 5.0 ± 0.2 0.1 ± 0.1 0.8 ± 0.2 28.4 ± 0.8 7.3 ± 0.1
B13 195 11.7 9.5 20.8 53.4 55.3 ± 0.2 3.3 ± 0.1 bld 0.6 ± 0.2 29.4 ± 0.1 6.7 ± 0.2
B14 170 7.5 9.5 16.1 73.5 44.8 ± 0.9 8.5 ± 0.3 0.3 ± 0.1 bdl 26.0 ± 0.5 5.0 ± 0.3
B15 220 7.5 9.5 24.3 61.1 47.1 ± 0.3 bdl bdl bdl 35.4 ± 1.2 3.0 ± 0.3
B16 195 7.5 − 18.0 79.3 47.4 ± 0.7 bdl bdl bdl 33.5 ± 0.9 9.1 ± 0.2
B17 195 7.5 25.5 23.3 61.2 45.0 ± 0.3 bdl bdl bdl 35.3 ± 1.5 10.6 ± 0.7
aSTB: steam-treated bagasse; WS: water-soluble fraction; WW: water-washed fraction; banhydroglucose, present as β(1-4)-D-glucans (cellulose); canhydroxylose, anhydroarabinose and acetyl groups, present collectively in cane bagasse heteroxylans (hemicelluloses); dsoluble lignin plus
Table 3. Concentration of potential fermentation inhibitors and carbohydrate composition of the water-soluble steam-treated substrates (STB-WS) fractions before and after post-hydrolysis with dilute sulfuric acid
Sample steam-explosion / g Mass used for STB-WS total volume / mL
Potential inhibitor in the STB-WS fraction / (g L-1)
Carbohydrate in STB-WSa after
post-hydrolysis / (g L-1)
HMF Furfural Acetic acid Glc Xyl Ara
B01 559.6 2600 0.21 2.96 3.74 1.68 29.18 1.23
B02 487.7 2340 0.22 5.86 5.17 2.68 29.55 1.26
B03 510.5 2670 1.01 6.16 5.89 6.47 22.42 1.91
B04 500.2 2630 1.98 14.65 4.51 5.73 18.54 1.45
B05b 440.9 3050 0.70 9.67 3.28 4.43 23.26 1.04
B06b 440.6 2350 0.71 9.29 3.34 5.62 28.11 1.26
B07b 440.3 2750 0.78 10.73 3.35 5.67 26.11 1.10
B08 452.8 2480 0.38 3.04 4.21 2.83 25.56 0.57
B09 451.1 2350 0.29 3.46 3.77 3.85 18.72 0.74
B10 460.3 2710 0.66 7.31 3.66 6.90 30.95 1.49
B11 449.9 3020 1.29 8.55 3.46 8.49 21.12 1.10
B12 443.0 2500 0.05 2.82 2.52 2.42 23.89 1.42
B13 443.0 2760 0.65 5.45 3.62 3.73 17.58 0.69
B14 443.0 2700 0.07 0.71 3.44 1.20 18.74 1.05
B15 443.0 2560 3.44 12.82 4.56 12.99 23.13 0.39
B16 459.2 2830 0.44 7.33 5.05 3.35 27.42 1.55
B17 443.0 2680 1.18 14.14 4.27 8.52 26.29 1.01
aGlc: glucose; Xyl: xylose; Ara: arabinose; bCP:center point of the central composite design; STB-WS: water-soluble steam treated substrates; HMF:
hydroxymethylfurfural.
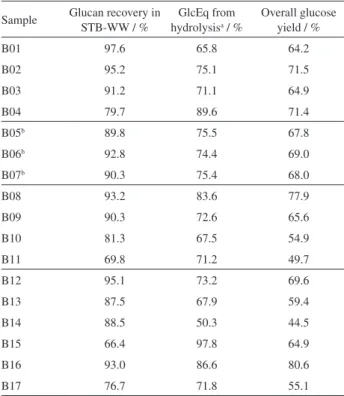
Table 4. Glucan recovery in STB-WW, as well as their glucose equivalents
obtained by enzymatic hydrolysis and the resulting overall glucose yield
Sample Glucan recovery in STB-WW / %
GlcEq from hydrolysisa / %
Overall glucose yield / %
B01 97.6 65.8 64.2
B02 95.2 75.1 71.5
B03 91.2 71.1 64.9
B04 79.7 89.6 71.4
B05b 89.8 75.5 67.8
B06b 92.8 74.4 69.0
B07b 90.3 75.4 68.0
B08 93.2 83.6 77.9
B09 90.3 72.6 65.6
B10 81.3 67.5 54.9
B11 69.8 71.2 49.7
B12 95.1 73.2 69.6
B13 87.5 67.9 59.4
B14 88.5 50.3 44.5
B15 66.4 97.8 64.9
B16 93.0 86.6 80.6
B17 76.7 71.8 55.1
aEnzymatic hydrolysis was performed at 8 wt.% TS using 30 mg of Cellic
CTec2 g-1 TS; bCP: center point of the central composite design; GlcEq:
glucose equivalents; STB-WW: water-washed steam-treated substrates.
Table 5. Analysis of variance of the glucan recovery yields (%) that were
obtained after pretreatment
Source SQ GL MS F FTab
Regression 1266.35 9 140.71 21.06 3.68
Residue 46.77 7 6.68
Lack of fit 41.72 5 8.34 3.31 19.30
Pure error 5.05 2 2.52
Total 1313.12 16
SQ: sum of squares; GL: degrees of freedom; MS: mean squares.
the highest glucan recovery was obtained at the mildest pretreatment condition (180 °C for 5 min) while the lowest was obtained after pretreatment at 220 °C for 7.5 min using 9.5 mg H3PO4 g-1 TS (97.6 and 66.4%, respectively).
The first order effects can be better assessed by analyzing the results of the axial points of the central composite design. In the case of temperature, an increase from 170 °C (B14) to 220 °C (B15) in the presence of 9.5 mg H3PO4 g-1
TS caused a decrease in glucan recovery from 88.5 to 66.4%, whereas acid impregnation with 25.5 mg H3PO4 g-1
TS resulted in a decrease of approximately 18% in glucan recovery as demonstrated in experiment B16 and B17. Likewise, a decrease in glucose yield from 79.7 to 69.8%
210 °C for 10 min (B04 and B11, respectively). As for the residence time in the reactor, an increase from 3.3 (B12) to 11.7 min (B13) reduced the glucose yield from 95.1 to 87.5%, respectively.
Among the second order effects, the only statistically significant interaction was observed between time and temperature, which had a negative influence on the glucan recovery by 4.43 p.p. In general, by comparing experiments B02 and B03 as well as B09 and B10, it seemed that, under the conditions used in this study, lower temperatures at longer residence times were better than higher temperatures at shorter residence times. By contrast, for the only situation in which three different temperatures (170, 195, and 220 °C) were assessed at otherwise identical pretreatment conditions (7.5 min with 9.5 mg H3PO4 g-1 TS), the best glucose yield was obtained
at the intermediate value of 195 °C (see experiments B05-B07, B14 and B15 in Table 4).
Figure 2shows the linear correlation that exists between predicted and observed values for the glucan recovery in STB-WW. The corresponding correlation coefficient was
higher than 0.964 and this indicates the good prediction capacity of the mathematical model that was developed to fit the experimental data.
Enzymatic hydrolysis
Hydrolysis of water-washed steam-treated substrates (STB-WW) was carried out for 96 h using 8 wt.% TS and
30 mg of Cellic CTec2 g-1 TS (Table 4). All substrates
showed good conversion to glucose equivalents (mostly glucose) using relatively low enzyme loading (see the Supplementary Information section for details). For experiments performed with phosphoric acid catalysis (B08-B09), the increase of temperature and residence time in the steam reactor did not affect the hydrolysis yield inasmuch as observed with steam explosion alone (B01-B05). The highest yield of 83.65% was obtained from B08 (180 °C, 5 min, 9.5 mg H3PO4 g-1 TS) after 96 h of
hydrolysis, in which the lowest temperature and reaction time were used for pretreatment. However, steam explosion at 210 °C for 10 min (B04, 89.63%) resulted in a much better substrate for enzymatic hydrolysis. This difference was attributed to the hemicellulose content of the steam-treated substrate (B04), which was brought to an almost undetectable level. By contrast, this was not observed in the experiment carried out in the presence of phosphoric acid (B08), in which nearly 7.5% of hemicellulose component was retained in the steam-treated fibers.
In general, cane bagasse was successfully pretreated by steam explosion, whose main focus was to produce highly accessible substrates for enzymatic hydrolysis with the best possible recovery of fermentable sugars. On the basis of this, the best substrates for cellulosic ethanol production were selected among those evaluated in this study. Besides the easiness with which the substrate was hydrolysed, the anhydroglucose (glucan) recovery after pretreatment was also taken into account to provide the overall conversion efficiency. Thus, the best results were achieved by steam explosion at 195 °C for 7.5 min (B16) and at 180 °C for 5 min with 19 mg of H3PO4 g-1TS (B08), which provided
overall glucose yields of 80.6 and 77.9% after enzymatic hydrolysis for 96 h, respectively (Table 4).
Fermentation
C6 fermentation was carried out by SHF and SSF only with substrates that were derived from the best pretreatment conditions (B16 for autohydrolysis and B08
for H3PO4-catalysed steam explosion). Experiments were
carried out at 12 wt.% TS with 62.5 mg g-1 TS of Cellic CTec2
for hydrolysis and 1 g L-1S. cerevisiae PYCC 4072 cells
Figure 1. Pareto chart describing the effect of each pretreatment variable
on the glucan recovery in water-washed steam-treated substrates (STB-WW fraction).
for fermentation. The center point of the central composite design was also included in these trials because their corresponding glucan recovery was also acceptable; besides, the availability of this substrate in three replicates allowed us to determine the standard deviation of both conversion processes.
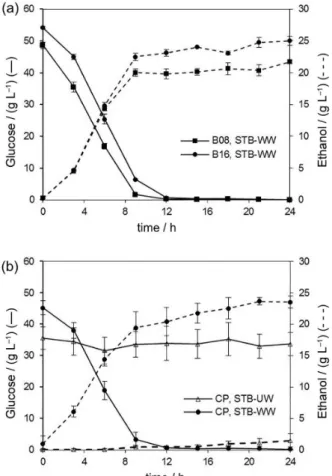
Figures 3 and 4 show the glucose consumption and
ethanol production in both SHF and SSF experiments, respectively. The SHF fermentation profiles of B16 and
B08 STB-WW hydrolysates containing around 50 g L-1
glucose were very similar, with glucose being almost completely consumed after 10 h in both trials. The ethanol yield for B08 was 0.45 g g-1 glucose (21.73 g L-1) while
B16 rendered 0.46 g g-1 glucose (25.00 g L-1) for ethanol
productivities of 2.25 and 2.55 g L-1 h-1, respectively
(Figure 3a). These results were very similar to the control using 50 g L-1 glucose, which resulted in 22.53 g L-1 ethanol
for a yield of 0.45 g g-1 glucose. In the center point of the
central composite design (CP, STB-WW), an average
of 0.52 ± 0.01 g g-1 glucose was obtained for an ethanol
concentration of 23.50 ± 0.96 g L-1 (Figure 3b), revealing
a relative standard deviation of only 1.1% for experiments
carried out in three replicates. These data demonstrate once again the consistency and reproducibility of the experimental procedures employed in this study.
STB-UW hydrolysates derived from the center point of the central composite design (CP, STB-UW) were also fermented as shown in Figure 3b. However, the presence of fermentation inhibitors in the pretreatment water-solubles (STB-WS) had a severe detrimental effect on yeast growth and ethanol was produced only marginally after a long lag phase of at least 16 h. It has
already been demonstrated that S. cerevisiae strains are
able to convert furfural into furfuryl alcohol, which is much less inhibitory than its precursor.24 This is probably
the reason why a small amount of ethanol was produced after 16 h. In addition, a considerable degree of enzyme inhibition was observed when STB-UW substrates were hydrolysed by Cellic CTec2 under the same conditions used for the corresponding STB-WW substrate. This was demonstrated by the glucose release obtained after 96 h of hydrolysis, which corresponded to 45.24 ± 1.19% for STB-UW and 82.81 ± 1.84% for STB-WW. This was probably due to the presence of xylo-oligosaccharides in the pretreatment water solubles, which acted as competitive inhibitors of cellobiohydrolases.25
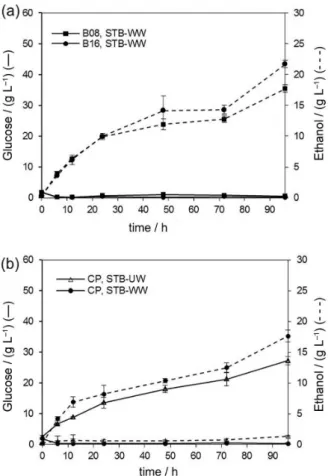
Figure 4 shows the SSF profile of the same steam-treated substrates used for SHF. Since these experiments were carried out without pre-hydrolysis, sugars were fermented to ethanol as they were produced by the concerted action of the enzymes. The STB-WW substrate
derived from B08 and B16 produced 17.7 and 21.68 g L-1
ethanol in 96 h, respectively (Figure 4a). As for the center point of the central composite design (Figure 4b), the
average yield was 17.62 ± 0.96 g L-1 for STB-WW and
only 1.35 ± 0.14 g L-1 for STB-UW. The fermentation
control using glucose as the sole carbon source produced 22.82 g L-1 ethanol, which was similar to the value obtained
for B16 experiment (21.68 g L-1).
SSF of STB-WW substrates showed lower ethanol production than SHF mainly because the enzymes operated far away from their optimal reaction temperature. Also, glucose was fermented as it was produced and this explains why its concentration remained very low throughout the
SSF trials. Glucose was found at approximately 2 g L-1
in the beginning of the reaction course and dropped very quickly to less than 1 g L-1 to remain at this level until the
end of the process (Figure 4).
Similar to the SHF tests, the ethanol production from STB-UW in SSF experiments was marginal, demonstrating once again that the pretreatment water solubles were highly inhibitory to yeast fermentation. To further investigate the origin of this inhibitory effect, the STB-WS fraction derived Figure 3. Glucose consumption and ethanol production for SHF
from pretreatment was freeze-dried and the recovered solids were reconstituted with distilled water to the same original volume. By doing so, more than 80% of classic fermentation inhibitors was removed, giving water-solubles with 1.81 ± 0.03, 0.12 ± 0.02 and 0.62 ± 0.03 g L-1 furfural,
HMF and acetic acid, respectively (Figure 5).
After this, the freeze-dried STB-WS was added to an enzymatic hydrolysate of STB-WW and the mixture was
fermented with of S. cerevisiae PYCC 4072 yeast cells
under the same conditions used for SHF. This fermentation trial resulted in an ethanol concentration higher than that of the control, achieving around 19 g L-1 ethanol in 12 h
(Figure 6). Also, the yeast had a much shorter lag phase during the early stages of fermentation. These results reveal that furfural, HMF and acetic acid were responsible for most of the inhibitory effect of STB-UW hydrolysates (Figure 3b) and that phenolic acids and other water soluble biomass derivatives derived from pretreatment had no inhibitory effect on fermentation. More importantly, some of these components seemed to boost ethanol production as observed in Figure 6, therefore promoting rather than inhibiting yeast fermentation. We are currently analyzing these fractions in detail to identify which components are resulting in such an interesting effect.
Conclusions
At the conditions used in this study, steam explosion resulted in good pretreatment performance of cane bagasse but phosphoric acid catalysis produced steam-treated substrates with good susceptibility to enzymatic hydrolysis at lower pretreatment temperatures and shorter residence times. High recovery yields of hemicellulose sugars (mostly xylose) were obtained primarily when phosphoric acid was used as the pretreatment catalyst. Cane bagasse glucans were also recovered in high yields and a quadratic model was developed to predict the experimental data with high accuracy. High saccharification and fermentation yields were obtained from water-washed steam-treated substrates while the presence of pretreatment water-solubles (C5 fraction) was highly inhibitory to these processes. However, freeze-drying reduced furan compounds and acetic acid to non-inhibitory levels. Figure 4. Glucose consumption and ethanol production for SSF
experiments using (a) B08 and B16 steam-treated water-washed (STB-WW) substrates; (b) unwashed steam-treated substrates (STB-UW) derived from the CCD center point (CP).
Figure 5. Concentration of fermentation inhibitors in pretreatment water solubles (STB-WS) before and after freeze-drying.
Figure 6. Glucose consumption and ethanol production during
Supplementary Information
The composition of glucose equivalents (GlcEq) in STB-WW enzymatic hydrolysates is available free of charge at http://jbcs.sbq.org.br as PDF file.
Acknowledgments
The authors are grateful to CNPq (grants: 551404/2010-8; 311554/2011-3), Araucaria Foundation (grants 3572013-35356 and 2742013-35145) (Brazil) and the INCT Energy and Environment (INCT E&A) for the financial support to carry out this study. Novozymes Latin America (Araucária, PR, Brazil) is gratefully acknowledged for providing the enzyme preparation used for hydrolysis. A. P. P. and L. M. C. are also grateful to CAPES (Brazil) for providing scholarships to carry out their graduate studies.
References
1. Balat, M.; Balat, H.; Öz, C.; Prog. Energy Combust. Sci.2008,
34, 551.
2. Hahn-Hägerdal, B.; Galbe, M.; Gorwa-Grauslund, M. F.; Lidén, G.; Zacchi, G.; Trends Biotechnol. 2011, 24, 549.
3. Gupta, A.; Verma, J. P.; Renewable Sustainable Energy Rev.
2015, 41, 550.
4. Chiaramonti, D.; Prussi, M.; Ferrero, S.; Oriani, L.; Ottonello, P.; Torre, P.; Cherchi, F.; Biomass Bioenergy2012, 46, 25.
5. Silveira, M. H. L.; Morais, A. R. C.; Lopes, A. M. C.; Olekszyszen, D. N.; Bogel-Lukasik, R.; Andreaus, J.; Ramos, L. P.; ChemSusChem2015, 8, 3366.
6. Ramos, L. P.; Quim. Nova2003, 26, 863.
7. Hendriks, A. T. W. M.; Zeeman, G.; Bioresour. Technol. 2009,
100, 10.
8. Ramos, L. P.; Silva, L.; Ballem, A. C.; Pitarelo, A. P.; Chiarello, L. M.; Silveira, M. H. L.; Bioresour. Technol. 2015, 175, 195.
9. Deschamps, F. C.; Ramos, L. P.; Fontana, J. D.; Appl. Biochem. Biotechnol. 1996, 57, 171.
10. Fontana, J. D.; Passos, M.; Baron, M.; Mendes, S. V.; Ramos, L. P.; Appl. Biochem. Biotechnol. 2001, 91, 469.
11. Gámez, S.; González-Cabriales, J. J.; Ramírez, J. A.; Garrote, G.; Vásquez, M.; J. Food Eng.2006,74, 78.
12. Geddes, C. C.; Peterson, J. J.; Roslander, C.; Zacchi, G.; Mullinnix, M. T.; Shanmugan, K. T.; Ingram, L. O.; Bioresour. Technol. 2010, 101, 1851.
13. Geddes, C. C.; Mullinnix, M. T.; Nieves, I. U.; Peterson, J. J.; Hoffman, R. W.; Yourk, S. W.; Yomano, L. P.; Miller, E. N.; Shanmugam, K. T.; Ingram, L. O.; Bioresour. Technol.2011,
102, 2702.
14. Rockström, J.; Steffen, W.; Noone, K.; Persson, Å.; Chapin III, F. S.; Lambin, E. F.; Lenton, T. M.; Scheffer, M.; Folke, C.; Schellnhuber, H. J.; Nykvist, B.; de Wit, C. A.; Hughes, T.; van der Leeuw, S.; Rodhe, H.; Sörlin, S.; Snyder, P. K.; Costanza, R.; Svedin, U.; Falkenmark, M.; Karlberg, L.; Corell, R.W.; Fabry, V. J.; Hansen, J.; Walker, B.; Liverman, D.; Richardson, K.; Crutzen, P.; Foley, J. A.; Nature2009, 461, 472.
15. Ulrich, A. E.; Malley, D. F.; Watts, P. D.; Sci. Total Environ.
2016, 542, 1030.
16. Harrison, M. D.; Zhang, Z.; Shand, K.; Chong, B. F.; Nichols, J.; Oeller, P.; O’Hara, I. M.; Doherty, W. O.; Dale, J. L.; Biotechnol. Biofuels2014, 7, 131.
17. Chen, Y.; J. Ind. Microbiol. Biotechnol.2011, 38, 581.
18. Biswas, R.; Uellendahl, H.; Ahring, B. K.; AMB Express2013,
3, 42.
19. Zhang, G.-C.; Liu, J.-J.; Kong, I. I.; Kwak, S.; Jin, Y.-S.; Curr. Opin. Chem. Biol.2015, 29, 49.
20. Jeong, S.-M.; Kim, Y.-J.; Lee, D.-H.; Korean J. Chem. Eng.
2012, 29, 1038.
21. Pitarelo, A. P.; da Silva, T. A.; Peralta-Zamora, P. G.; Ramos, L. P.; Quim. Nova 2012, 35, 1502.
22. Ghose, T. K.; Pure Appl. Chem. 1987, 59, 257.
23. Jönsson, L. J.; Alriksson, B.; Nilvebrant, N.-O.; Biotechnol. Biofuels2013, 6, 16.
24. Horváth, I. S.; Franzén, C. J.; Taherzadeh, M. J.; Niklasson, C.; Lidén, G.; Appl. Environ. Microbiol.2003, 69, 4076. 25. Zhang J.; Viikari, L.; Bioresour. Technol. 2012, 117, 286.
Submitted: December 29, 2015 Published online: March 14, 2016