www.atmos-chem-phys.net/10/9393/2010/ doi:10.5194/acp-10-9393-2010
© Author(s) 2010. CC Attribution 3.0 License.
Chemistry
and Physics
Black carbon measurements in the boundary layer over western and
northern Europe
G. R. McMeeking1, T. Hamburger2, D. Liu1, M. Flynn1, W. T. Morgan1, M. Northway3, E. J. Highwood3, R. Krejci4, J. D. Allan1,5, A. Minikin2, and H. Coe1
1Centre for Atmospheric Science, University of Manchester, Manchester, UK 2Deutsches Zentrum f¨ur Luft- und Raumfahrt, Oberpfaffenhofen, Weßling, Germany 3Department of Meteorology, University of Reading, Reading, UK
4Department of Applied Environmental Science, Atmospheric Science Unit, Stockholm University, Sweden 5National Centre for Atmospheric Science, University of Manchester, Manchester, UK
Received: 19 May 2010 – Published in Atmos. Chem. Phys. Discuss.: 4 June 2010 Revised: 29 August 2010 – Accepted: 1 September 2010 – Published: 6 October 2010
Abstract. Europe is a densely populated region that is a significant global source of black carbon (BC) aerosol, but there is a lack of information regarding the physical prop-erties and spatial/vertical distribution of rBC in the region. We present the first aircraft observations of sub-micron re-fractory BC (rBC) aerosol concentrations and physical prop-erties measured by a single particle soot photometer (SP2) in the lower troposphere over Europe. The observations spanned a region roughly bounded by 50◦to 60◦N and from 15◦W to 30◦E. The measurements, made between April and September 2008, showed that average rBC mass concentra-tions ranged from about 300 ng m−3near urban areas to ap-proximately 50 ng m−3in remote continental regions, lower than previous surface-based measurements. rBC represented between 0.5 and 3% of the sub-micron aerosol mass. Black carbon mass size distributions were log-normally distributed and peaked at approximately 180 nm, but shifted to smaller diameters (∼160 nm) near source regions. rBC was corre-lated with carbon monoxide (CO) but had different ratios to CO depending on location and air mass. Light absorption coefficients were measured by particle soot absorption pho-tometers on two separate aircraft and showed similar geo-graphic patterns to rBC mass measured by the SP2. We sum-marize the rBC and light absorption measurements as a func-tion of longitude and air mass age and also provide profiles of rBC mass concentrations and size distribution statistics. Our results will help evaluate model-predicted regional rBC con-centrations and properties and determine regional and global climate impacts from rBC due to atmospheric heating and surface dimming.
Correspondence to:G. R. McMeeking
(gavin.mcmeeking@manchester.ac.uk)
1 Introduction
Black carbon (BC) aerosol emitted during incomplete com-bustion is the major light absorbing component of spheric aerosols and has important impacts on the atmo-sphere and climate. BC absorbs solar radiation, so it per-turbs the radiative balance of the atmosphere on regional and global scales, leading to enhanced warming aloft and surface dimming (Jacobson, 2004; Ramanathan and Carmichael, 2008). Its concentrations are highest near source regions, resulting in “hotspots” of increased solar heating of the at-mosphere, which may subsequently perturb the hydrologic cycle on regional scales (Ramanathan, 1981; Menon et al., 2002).
feature rapid changes in concentrations and properties. They also provide no information regarding the size distribution or mixing state of the BC mass.
The development of the Single Particle Soot Photometer (SP2) provided the opportunity for the rapid, highly sensi-tive measurement of refractory rBC (rBC) concentrations, size distributions and mixing state (Stephens et al., 2003; Baumgardner et al., 2004; Schwarz et al., 2006). SP2 rBC mass measurements do not require that material be sampled to a filter and have been shown to be independent of the rBC mixing state (Slowik et al., 2007), avoiding many of the filter-based rBC measurement difficulties. The SP2 is a direct mea-surement of mass, so does not require an assumed mass ab-sorption efficiency to convert an abab-sorption measurement to mass concentration. Recent SP2 measurements have allowed for investigations of rBC impacts on atmospheric radiative processes (Gao et al., 2008; Shiraiwa et al., 2008; Schwarz et al., 2009) and new evaluations of models that include de-tailed microphysical schemes to predict rBC concentrations and mixing state (Koch et al., 2009; Vignati et al., 2010).
To date, SP2 observations in the troposphere have been limited to North America (Baumgardner et al., 2007; Schwarz et al., 2008a,b; Spackman et al., 2008; Subrama-nian et al., 2010), east Asia and the northern Pacific (Moteki et al., 2007; Shiraiwa et al., 2007, 2008; Baumgardner et al., 2008), and the Arctic (Jacob et al., 2009). Europe repre-sented approximately 10% of global contained combustion rBC emissions in 1996 (Bond et al., 2004) and continues to be an rBC emissions hotspot, but the only previous SP2 ob-servations in Europe were confined to the upper troposphere and lower stratosphere (Baumgardner et al., 2007). Previ-ous non-SP2 rBC measurements in Europe have been pri-marily surface-based, resulting in low spatial-resolution in-formation on the horizontal distribution of rBC and no infor-mation on its vertical distribution. Previous aircraft measure-ments in Europe relied on absorption techniques to estimate BC (Osborne et al., 2007; Petzold et al., 2007; Stohl et al., 2007), which are prone to artefacts, require an assumed con-version factor to obtain BC mass and are less sensitive than the SP2. The previous aircraft studies in Europe were also relatively isolated in their extent or examined specific me-teorological conditions: Osborne et al. (2007) measured BC over the Po Valley in Italy and nearby portions of the Adriatic Sea and Petzold et al. (2007) and Stohl et al. (2007) exam-ined biomass burning plumes transported from North Amer-ica and pollution transported from Asia, respectively.
In order to improve the understanding of rBC mass con-centrations and size distributions over Europe, we measured rBC using an SP2 on board the UK Facility for Airborne Atmospheric Measurements (FAAM) BAe-146 research air-craft during 21 research flights over Europe in 2008. We compared the SP2 observations to simultaneous measure-ments of aerosol light absorption coefficients (bap) measured by particle soot absorption photometers (PSAP) on board the FAAM and DLR (Deutsches Zentrum f¨ur Luft-und
Raum-fahrt) Falcon 20-E5 research aircraft. Here we describe the spatial and vertical distribution of rBC and aerosol absorp-tion over Europe, compare rBC observaabsorp-tions to other pri-mary and secondary gas and aerosol-phase pollution tracers and compare rBC size distributions measured over Europe to those measured in other regions. We also provide an im-proved, size-resolved dataset for validating model estimates of rBC concentrations and distributions within Europe. Re-lated papers examine rBC mixing state and ageing processes (McMeeking et al., 2010), aerosol composition and optical properties (Morgan et al., 2010a,b) and aerosol microphysi-cal properties (Hamburger et al., 2010).
2 Method
We present results from two major aircraft measurement campaigns that took place in Europe between April and September 2008. The EUCAARI-LONGREX (European in-tegrated Project on Aerosol Cloud Climate and Air Quality Interactions - Long Range Experiment, hereafter referred to as LONGREX) campaign, part of the broader EUCAARI project (Kulmala et al., 2009), occurred from 6–22 May 2008. It involved coordinated aircraft measurements of the aerosol and trace gas properties over northern and western Europe. The DLR Falcon research aircraft sampled aerosols and trace gases mainly in the free troposphere with periodic sampling of the boundary layer during profile descents and ascents. The DLR Falcon featured a downward pointing li-dar (Esselborn et al., 2008) to characterise aerosol layers and identify regions of interest (Hamburger et al., 2010). The FAAM aircraft mainly sampled in the boundary layer, includ-ing the regions of interest identified by the DLR Falcon. The APPRAISE-ADIENT (Aerosol Properties, PRocesses AND InfluenceS on the Earth’s climate – Appraising the aerosol Direct Impact on Climate, hereafter referred to as ADIENT) campaign took place over an approximately 1.5 year pe-riod, with operational periods in December 2007, April and September 2008, and May/June 2009 (here we only consider the April and September 2008 measurements). The LON-GREX and ADIENT projects were complementary in that both sought to examine the effects of atmospheric ageing on aerosol optical properties and covered similar and in some cases identical geographic regions. The DLR Falcon only took part in the LONGREX campaign.
2.1 Instruments on the DLR Falcon
The DLR Falcon measured aerosol and trace gas concen-trations and properties using a suite of remote sensing and
in situ instruments. These included lidar measurements
of aerosol profiles (Esselborn et al., 2008), in situ carbon monoxide (CO) and ozone (O3) measurements and
were a passive cavity aerosol spectrometer probe (PCASP-100X) and a forward scattering spectrometer probe (FSSP-300). Inside the cabin, two Grimm optical particle coun-ters (Model Sky-OPC 1.129) also measured aerosol size distributions. A set of five condensation particle coun-ters (CPC; Feldpausch et al. (2006)) and a thermodenuder (250◦C) measured number concentrations of volatile and non-volatile particles and a 3-wavelength PSAP (Virkkula et al., 2005) measured aerosol light absorption coefficients atλ= 467 nm, 530 nm, and 660 nm, which were corrected following Virkkula et al. (2005) and Virkkula (2010).
The absorption data were corrected using the parameter-isation given by Virkkula et al. (2005). The size distribu-tion data retrieved from the Grimm-OPC measurements were used to estimate the scattering coefficient used in the cor-rection. The Grimm-OPC used for the scattering coefficient estimate was calibrated with ammonium sulphate ((NH4)2
SO4) particles and the scattering coefficient correction
as-sumed the sampled aerosol had the same refractive index as ammonium sulphate (1.53 + 0i).
2.2 Instruments on the FAAM aircraft
Multiple instruments aboard the FAAM research aircraft pro-vided detailed in situ chemical and physical measurements of aerosol and trace gas species and a number of remotely sensed products. Inboard aerosol instruments sampled ambi-ent aerosol through stainless steel tubing connected to Rose-mount inlets (Foltescu et al., 1995). Osborne et al. (2007) showed sub-micron particle losses through the inlets to be negligible.
A PSAP measured aerosol light absorption atλ= 567 nm, adjusted to standard temperature and pressure (STP; tem-perature = 273.15 K and pressure = 1013.25 hPa). The PSAP data were corrected for spot size, flow rate, and the pres-ence of scattering particles on the filter using the approach given by Bond et al. (1999) and clarified by Ogren (2010), where the scattering coefficient needed for the correction was taken from a TSI 3563 integrating nephelometer on the air-craft. The corrections do not account for enhancements in absorption due to the presence of organic films surrounding the filter fibres (Subramanian et al., 2007) or coating the pre-existing absorbing particles in the filter (Cappa et al., 2008; Lack et al., 2008). Both effects probably increase with higher organic aerosol loadings. Black carbon aerosol number and mass concentrations were measured as a function of size us-ing an SP2 (DMT Inc., Boulder, Colorado, USA), described in detail in the following section.
A compact Time-of-Flight aerosol mass spectrometer (AMS; Aerodyne Research Inc., Boston, MA, USA) mea-sured sub-micron aerosol composition at approximately 30 s time resolution (Drewnick et al., 2005; Canagaratna et al., 2007). The FAAM aircraft AMS observations during the ADIENT and LONGREX campaigns are examined by Mor-gan et al. (2010a). Aerosol total and back-scattering
coeffi-cients were measured by a 3-wavelength integrating neph-elometer (TSI Inc., St. Paul, MN, USA). Scattering co-efficients were corrected for truncation and non-lambertian light source errors using the sub-micron parameterisation provided by Anderson et al. (1996). Aerosol size distri-butions were measured by a wing-mounted PCASP-100X (Particle Measurement Systems, Boulder, CO, USA). The PCASP channel limits were determined experimentally us-ing di-ethyl-hexyl-sebecate (DEHS) calibration particles and adjusted to a corresponding PSL-equivalent channel limit at a refractive index of 1.588 using Mie theory. PCASP vol-ume size distributions were integrated below 0.9 µm to ob-tain an estimate of total sub-micron volume concentrations. Sub-micron volume concentrations were multiplied by den-sity estimated from AMS composition measurements follow-ing Cross et al. (2007).
Carbon monoxide was measured by an Aero-Laser AL5002 VUV resonance fluorescence gas analyser. In-flight CO calibrations were applied to the raw CO data. A surrogate for nitrogen oxides (NOx), operationally defined as any
ni-trogen species converted to NO under a heated molybdenum catalyst, was measured using a Thermo Scientific model 42 chemiluminescence gas analyser. The instrument interpreted other NOyspecies, such as nitric acid, as NOxusing this
def-inition (Steinbacher et al., 2007). Ozone was measured using a Thermo Scientific model 49 UV photometric gas analyser.
2.3 The single particle soot photometer
The SP2 relied on a patented laser induced incandescence technique to characterise the mass and concentration of indi-vidual rBC particles (Stephens et al., 2003). For simplicity we apply the term “refractory black carbon” to the incan-descent material measured by the SP2, following previous SP2 studies. Bond and Bergstrom (2006) and Andreae and Gelencser (2006) discuss other nomenclature for BC. Even though neither study refers specifically to the material de-tected by the SP2, they provide useful information linking measurement methods and chemical/physical properties to the various terms applied in the literature. A particle sampled by the instrument is illuminated by an intra-cavity Nd:YAG laser (λ= 1064 nm) with a Gaussian profile (TEM00mode).
leads to differences in the particle emissivity and incandes-cence signals (Shiraiwa et al., 2008; Moteki et al., 2010).
The SP2 incandescence response for each detector was calibrated by the manufacturer (DMT) by passing dried, dif-ferential mobility analyser-selected (DMA; TSI 3085, St. Paul, Minnesota, USA) monodisperse Aquadag carbon par-ticles to the instrument (Aecheson Colloids Company, Port Huron, Michigan). The measured incandescence response was related to rBC mass calculated from the mobility diam-eter and an estimate of the effective density of the calibra-tion particles. The manufacturer calibracalibra-tion obtained in this way relied on a constant density assumption for the Aquadag calibration material, however Moteki et al. (2010) showed that the effective density (the relationship between mobility-estimated volume and mass measured by an aerosol particle mass (APM) analyser (Ehara et al., 1996)) of Aquadag de-creased linearly with mobility diameter. The size dependence arose from the behaviour of the non-spherical Aquadag par-ticles in the DMA. We adjusted the calibration results to ac-count for the shift and provide the calibration data in the sup-plementary information. Moteki et al. (2010) also showed that different rBC calibration materials produced different incandescence signal peak value-to-rBC mass relationships, with Aquadag having a larger signal response for a given rBC mass compared to ambient soot measured in Tokyo, Japan with an APM-SP2 system. The magnitude of the difference in responses was about 40% for particles below 10 fg in mass (0.22 µm in diameter assuming a density of 1.8 g cm−3), but the differences for larger particles were smaller. We have not attempted to adjust our results to account for these dif-ferences because it was not clear if ambient soot in Tokyo had similar properties to the ambient soot measured in the campaign.
Previously reported SP2 measurements used incandes-cence detectors with similar gain settings and optical filters to restrict the detected light to “broadband” (350–800 nm) and “narrowband” (630–800 nm) wavelength ranges. The set-up allows for classification of the incandescing material by its thermal emission spectrum using the ratio of the narrowband and broadband peak signals or colour ratio, as been done pre-viously by, e.g., Schwarz et al. (2006). To date, ambient SP2 measurements have not identified a significant contribution by non-rBC absorbing aerosols to the incandescence signal (e.g., Schwarz et al., 2006; Subramanian et al., 2010). In this study, the gain settings on the incandescence detectors (photomultipliers), were optimized to maximize the dynamic range for particle sizing as opposed to retrieving colour ra-tios over the broadest range of particle sizes. The baseline of the detectors was also adjusted to provide a larger detection range for the September flights.
In addition to the incandescence detectors, two avalanche photodetectors (APD) measure light scattered by particles in the laser beam at 1064 nm. One of the detectors is a four-element APD that is used to determine the position of each particle as it passes through the laser beam (Gao et al., 2007).
This information is used to fit Gaussian functions to particles that either saturate the detector or contain rBC, which causes the particle to evaporate when heated by the laser and leads to a degradation of the scattering signal. The scattered light signals provide concentration and sizing information for non-incandescing particles in the size range Dp= 150-600 nm. Scattered-light data also allows investigations of the rBC mixing state, which we describe in a companion manuscript (McMeeking et al., 2010). The scattering detectors were cal-ibrated using dried polystyrene latex spheres (PSL) by relat-ing the detector response to the physical PSL size. A subset of calibrations included a size-selection step using a DMA to remove sub-100 nm particles thought to arise from atom-ization of surfactants and contaminants in the PSL solution. The size calibration holds for particles with the same refrac-tive index as PSL (1.588), however estimates of the aerosol refractive index based on aerosol composition measured in the boundary layer by the AMS were within 5% of the PSL value, so we have not adjusted the particle diameters to ac-count for deviations from the refractive index of PSL. The SP2 was tested in the laboratory prior to each aircraft de-ployment to ensure alignment of the sample aerosol jet, laser and each detector as well as the shape of the laser beam. The consistency of the instrument alignment was checked during deployments using PSL test particles and examination of the beam shape.
The range of particle masses detected by the SP2 depends on the detector gain settings and the laser power incident on the rBC particle (Schwarz et al., 2010). Schwarz et al. (2010) found that not all rBC particles were brought to their vapor-isation temperature below a certain laser intensity threshold, invalidating their mass determination. rBC particles with less mass required higher threshold laser intensities to en-sure they reached their vaporisation temperature. We used the manufacturer’s smallest resolved Aquadag mass signal from their calibration to determine the lower mass detection limit of the instrument of 0.2 fg (70 nm mobility diame-ter and estimated Aquadag effective density of 0.8 g cm−3; Moteki, 2010). This value was approximately a factor of four lower than the typical rBC mass detection limits of 0.7-1 fg reported for the SP2 (Shiraiwa et al., 2008; Schwarz et al., 2010; Subramanian et al., 2010) and the detection efficiency of the SP2 as configured in this study probably dropped be-low unity for masses bebe-low at least 0.7 fg based on Schwarz et al. (2010). The upper mass limit of the instrument was taken to be the mass of the largest calibration point available or 60 fg (550 nm; Aquadag density 0.6; Moteki and Kondo, 2010).
62
60
58
56
54
52
50
48
46 -10 0 10 20 30
62
60
58
56
54
52
50
48
46
30 20
10 0
-10
Hamburg
Munich
Helsinki Stockholm
London Manchester
Frankfurt Cologne Leipzig Newcastle
Edinburgh
ADIENT - April LONGREX - May
ADIENT - September
Cabauw
A: BAe-146 B: DLR Falcon
LONGREX - May: All flights LONGREX - May: Altitude < 3km
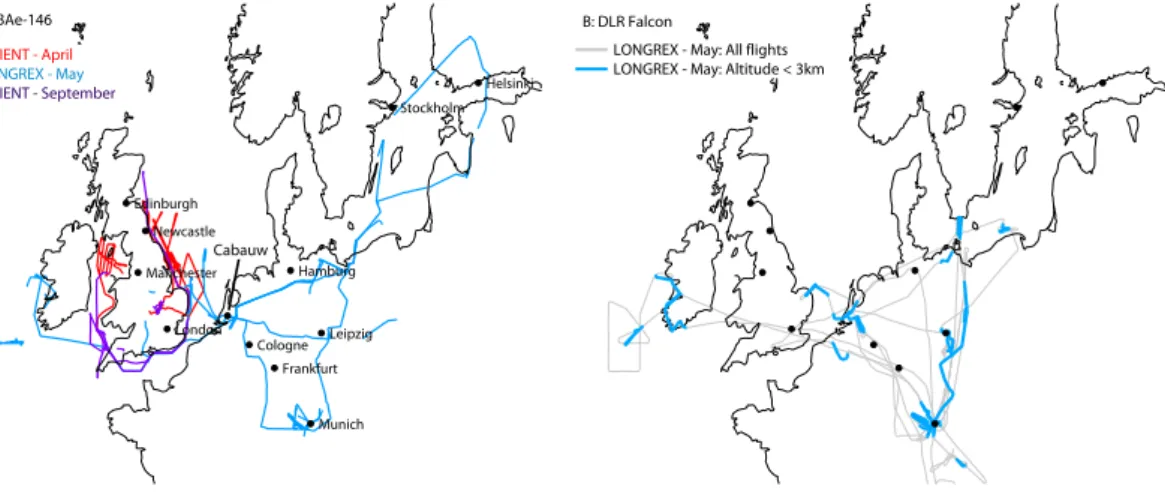
Fig. 1. Map showing flight tracks (restricted to altitudes below 3 km) during the April and September 2008 ADIENT and May 2008 EUCAARI-LONGREX measurement periods for the FAAM BAe-146 research aircraft and flight tracks during May 2008 for the DLR Falcon research aircraft. Portions of the DLR Falcon flight tracks falling below 3 km are indicated.
Schwarz et al. (2010). They recommend regular testing of the laser power by examining the colour ratio distribution at different laser intensities to identify the “threshold intensity for proper detection” and operating at intensities above that value. We note that any reductions in the laser power would result in an underestimate of the smallest rBC core diameters which only have a minor contribution to total rBC mass in this study.
A problem related to pressure-dependent flow control in the instrument resulted in unreliable data for large portions of the LONGREX flights at altitudes above approximately 2 km. During these periods the SP2-measured rBC and non-rBC aerosol concentrations dropped by an order of mag-nitude or more relative to other aerosol data (e.g., AMS aerosol mass, PCASP aerosol volume, PSAP absorption co-efficients). These periods were removed from the data and were identified by comparing the SP2 scattering concentra-tions to the PCASP and nephelometer signals. All data re-ported here have been carefully quality assured by compar-ison with the other instruments aboard the aircraft to ensure their validity. We discuss the processing procedures for the SP2 data, including the use of both incandescence detectors to determine the rBC size distribution, in the supplementary information.
3 Results
The data presented here were obtained from 21 FAAM air-craft flights and 12 DLR Falcon flights over the UK and Eu-rope that spanned a geographic range from approximately 15◦W to 30◦E and from 50◦to 60◦N. The LONGREX and ADIENT FAAM aircraft flights represent approximately 85 h of flight time, but only 36 hours of SP2 data due to the in-strument response problem at higher altitudes. We averaged all FAAM aircraft observations over each straight and level
flight run (SLR) and we separated them into sub-3 km alti-tude SLRs (within the boundary layer) and above 3 km SLRs (above the boundary layer), following Morgan et al. (2010a) and Hamburger et al. (2010). DLR Falcon data were aver-aged for periods when the aircraft was in the boundary layer (<3 km). Unless otherwise noted, we use the term SLR to refer to sub-3 km SLRs throughout the manuscript. All par-ticle mass concentrations are reported in mass per volume of air at standard temperature and pressure (denoted s m−3; temperature = 273.15 K and pressure = 1013.25 hPa). 3.1 Overview of the flying campaigns
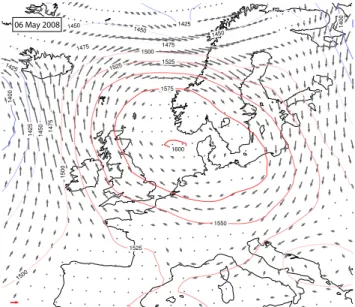
The majority of LONGREX and ADIENT research flights took place during clear sky conditions. Table 1 and Fig. 1 provide details for the individual flights. Maps showing the 850 hPa geopotential height and wind fields for 12:00 UTC together with flight tracks for each measurement day are in-cluded in the supplementary material. The meteorological conditions for LONGREX flights were less variable com-pared to ADIENT flights, due to the large number of flights during a relatively short period flown during LONGREX. Conditions during the first week of the LONGREX mea-surement period were dominated by a strong, anti-cyclonic system centred approximately over Denmark, illustrated in Fig. 2. The position of the anti-cyclone caused easterly flow over most of Europe and strong subsidence over the region. All but two of the LONGREX flights occurred during the high-pressure dominated period. The remaining LONGREX flights took place in building high pressure after passage of a weak frontal system, which featured a large-scale flow pat-tern similar to the earlier LONGREX flights. Hamburger et al. (2010) provide a detailed description of the meteoro-logical conditions during LONGREX.
Table 1.Summary of FAAM aircraft flights (with valid SP2 data) during EUCAARI-LONGREX and APPRAISE-ADIENT campaigns and DLR Falcon flights during the EUCAARI-LONGREX campaign.
Date FAAM ID Falcon ID Operating area 2 April 2008 B355 – England east coast 10 April 2008 B356 – England east coast
16 April 2008 B357 – Welsh coast and Manchester/Liverpool plume 2 May 2008 – 080502a Alps and northern Italy
6 May 2008 (am) B362 – Germany/Belgium and North Sea 6 May 2008 (pm) B363 080506b Germany/Belgium and North Sea
7 May 2008 B364 – Southern Germany
8 May 2008 (am) B365 080508a Germany/Poland and Baltic coast 8 May 2008 (pm) B366 080508b Germany/Netherlands/Belgium
9 May 2008 B367 – Southern Germany (aircraft inter-comparison) 10 May 2008 (am) B368 – Sweden/Finland/Baltic Sea
10 May 2008 (pm) B369 – Baltic Sea/Germany
12 May 2008 (am) B370 – Germany/Netherlands/North Sea 12 May 2008 (pm) B371 – Germany/Baltic Sea
13 May 2008 (pm) B373 080513b English Coast circuit/Western Ireland 14 May 2008 (am) B374 080514a Irish Sea, Atlantic Ocean southwest of Ireland 14 May 2008 (pm) – 080514b transit from Ireland to Germany
20 May 2008 - 080520a Eastern Germany/Poland/Baltic Sea 21 May 2008 (am) B379 050821a Northern Germany/Netherlands/Belgium 21 May 2008 (pm) – 080521b Northern Germany/Netherland/Belgium
22 May 2008 (am) B380 080522a Germany/Netherlands/Belgium/English Channel/England 22 May 2008 (pm) – 080522b Germany/Netherlands/Belgium/English Channel/England 18 September 2008 B401 – English Channel/Southwest England
19 September 2008 B402 – England east coast 23 September 2008 B404 – England southwest coast 25 September 2008 B406 – Circuit around England
in more detail than for the LONGREX campaign. ADIENT flights targeted conditions with clear skies and little influence from precipitation. Meteorological data were obtained from the ECMWF (European Centre for Medium-Range Weather Forecasts) interim re-analysis, a development of the ERA-40 re-analysis.
A high pressure system located west of the Bay of Biscay resulted in relatively strong northwesterly flow over most of the UK during the 2 April 2008 flight (B355). Measurements were concentrated along the east coast of the UK examin-ing plumes from cities along the east coast includexamin-ing Edin-burgh, Newcastle and Hull. The 10 April 2008 flight also measured pollution along the east coast, but the mean flow during this period was southwesterly due to a low-pressure system northwest of Ireland, so the aircraft sampled pollution from a broad swath of southern England. The 16 April 2008 flight took place in easterly-flow conditions. A broad region of high pressure to the north and northeast of the UK dur-ing the flight resulted in a relatively weak southeasterly flow. The flight measured pollution emitted over a broad region of the UK, especially the Liverpool/Manchester region in north-western England, as the pollution advected to the northwest.
A weak ridge of high pressure, drifting to the north, re-sulted in weak easterly flow over southern England during the first two flights of the September period (18 and 19 September; B401 and B402). A low-pressure system north of the UK led to westerly flow over most of northern Eng-land and ScotEng-land. The 18 September flight examined pol-lution in the easterly flow in the English channel, while the 19 September flight examined pollution in the westerly flow along the east coast of England and Scotland. The remaining three September flights took place from 23–25 September. During this period a high pressure system drifted from west of Scotland to the west of Denmark. The resulting flow of the UK was easterly for all three flights. The 23 September flight examined pollution downwind of the UK in the Bris-tol Channel. The 24 September flight examined flow coming into the UK from northern Europe, flying along the eastern UK coast. The 25 September flight examined pollution com-ing into the UK on the east and pollution exitcom-ing the UK to the west, flying a circuit around the whole of southern Eng-land.
0.4
0.3
0.2
0.1
0.0
-0.1
-0.2
0.3 0.2
0.1 0.0
-0.1 -0.2
0.00 0.00
1600 1575
1550 1525
1525
1525
1500
1500
1500 1475 1475
1475
1450 1450
1450
1450
1425
1425
1425
1400
1400
06 May 2008
Fig. 2. Map showing the ECMWF re-analysis 850 hPa geopoten-tial height (m) at 12:00 UTC for the 6 May 2008 flights (B362 and B363). Contour interval is 25 m. Arrows indicate 850 hPa wind speed and direction; red arrow in lower left corner illustrates a west-erly 10 m s−1wind.
characterize pollution upwind and downwind of the UK. Aerosol loadings were expected to be relatively low for flights upwind of the UK during westerly-dominated condi-tions (Atlantic inflow) and higher for flights downwind of the UK (Morgan et al., 2009). During easterlies, flights up-wind of the UK captured pollution transported from Europe and flights downwind of the UK measured a combination of pollution from the UK and Europe. Higher aerosol loadings were expected compared to flights taking place in westerlies (Morgan et al., 2009). The majority of flights over conti-nental Europe during LONGREX took place during condi-tions dominated by high pressure over Denmark and the sur-rounding region, so flow was easterly, with the exception of flights over Scandinavia, when flow was anti-cyclonic with a stronger northerly component.
Morgan et al. (2010a) describe the total sub-micron aerosol mass concentrations measured by the AMS for most of the flights discussed here. They found highest sub-micron aerosol mass concentrations over northwestern Europe and off the coast of southern England during the May 2008 LON-GREX measurement period. A similar spatial pattern was observed for aerosol sub-micron volume concentrations de-rived from PCASP size distribution measurements and total aerosol scattering coefficients measured by the nephelome-ter. The maximum SLR-averaged sub-micron aerosol mass concentrations in the region were on the order of 20 µg s m−3. Concentrations tended to be lower to the north and east, drop-ping to a few µg s m−3 over the Baltic Sea. Organic mat-ter (OM) and ammonium nitrate were the dominant chemi-cal species contributing to aerosol mass as measured by the
AMS, each contributing between 20–50% of the total mass. Ammonium sulphate had larger contributions in the north and east. The results were consistent with the meteorolog-ical conditions during the observation period (anti-cyclonic flow with easterlies over most of northern Europe) and the distribution of NOx, SO2and NH3emission sources in
Eu-rope (Morgan et al., 2010a). 3.2 rBC mass concentrations
Figure 3a shows SLR-averaged rBC mass concentrations for all flights, with points coloured by the date of the mea-surement. The April and September ADIENT flights were concentrated around the UK, whereas the May LONGREX flights focused on continental Europe, but also included re-gions of the UK and together cover a larger area than that probed during ADIENT. Most of the SLRs were confined between 200–2000 m and the average SLR altitude was 900 m. Black carbon mass concentrations were highest over the Belgium/Netherlands region, the English Channel, and in ur-ban plumes sampled downwind of the western and eastern UK coasts, where the highest run-averaged rBC mass con-centrations were on the order of 300 ng s m−3. The lowest rBC concentrations (on the order of 20–60 ng s m−3) were observed over the Baltic Sea region and off the northeast-ern English coast during periods dominated by northeasterly winds.
The spatial distribution of rBC depicted in Fig. 3a reflects rBC source regions and the meteorological conditions at the time of the measurements. Wind speed and direction aver-aged over the same period as the rBC mass concentrations are shown in Fig. 3b. The majority of the continental Euro-pean rBC measurements were associated with weak easterly flow, consistent with the location of the high pressure sys-tem at this time. The rBC mass concentrations tended to in-crease from east to west during LONGREX. Conditions for UK measurements were more variable. Black carbon mass concentrations observed off the eastern UK coast were low for periods when winds were more northerly (transport from the North Sea and cleaner Arctic air masses) and higher when they had easterly or westerly components (polluted UK or continental European air masses).
The rBC mass concentrations measured over all of Europe during the LONGREX high-pressure dominated periods are summarized in Fig. 4a. Mean rBC concentrations increased from ∼50 ng s m−3 at the eastern extent of the operational
area to∼180 ng s m−3in the region bounded by 5 and 10◦W
60
55
50
20 0
62 60 58 56 54 52 50
48 0 10 20 30
-10 62 60 58 56 54 52 50 48
30 20
10 0
-10 62
60 58 56 54 52 50
48 -10 0 10 20 30
50 200
Hb
Mu
He Sk
Ld Mr
Fr
Cg Lz
Nc Ed
A
C
B
D
01/05/2008 01/07/2008 01/09/2008
200
150
100
50
0
rBC mass (ng m
-3
)
6
4
2
0
rBC / CO (ng rBC sm
-3
/ ppbv CO)
2
1
0
rBC mass fraction (%)
Fig. 3. Maps showing spatial distribution of refractory black carbon (rBC) averaged over straight and level runs (SLRs) below 3000 m. Points are sized by rBC mass concentrations and coloured by:(a)date/campaign;(b)rBC mass;(c)rBC mass fraction of fine aerosol mass (PCASP); and(d)rBC/excess carbon monoxide ratios. Points in panel b are shaded by rBC mass concentration and indicate the average wind speed and direction for each SLR. The longest wind speed arrow represents 15 m s−1. Locations of selected cities are shown in panel a (Mr = Manchester, Ld = London, Nc = Newcastle, Br = Brussels, Fr = Frankfurt, Mu = Munich, Hb = Hamburg, Sk = Stockholm, and He = Helsinki).
measurement region during the high-pressure dominated pe-riods, so there was likely little removal of rBC through scav-enging by clouds or precipitation, which is consistent with the observed rBC mass concentration gradients.
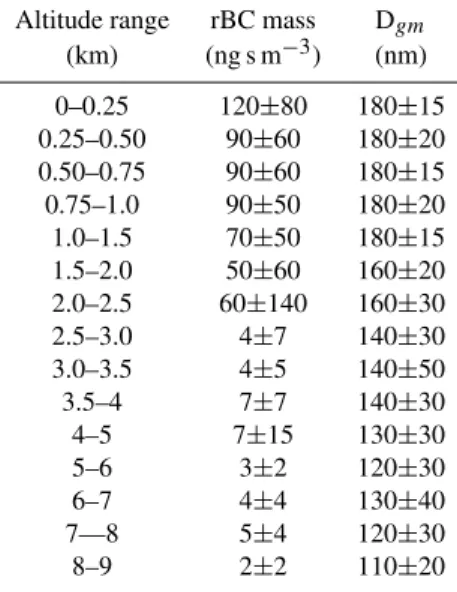
Information on the vertical structure of rBC mass load-ings was mainly limited to the April and September ADI-ENT flights due to the altitude-dependent SP2 problem dur-ing LONGREX. Figure 5 summarises the statistics of the rBC mass concentrations for the measurement campaign sep-arated into altitude bins. rBC mass concentrations were high-est in the boundary layer near the surface with a mean value and standard deviation of 120±80 ng s m−3. The average
rBC mass concentrations decreased with increasing altitude for the lowest ∼2000 m of the boundary layer to roughly 50 ng s m−3, then decreased further by a factor of 10 over the next few hundred meters reaching an average concentra-tion of about 5 ng s m−3in the middle free troposphere. The variability in rBC mass concentrations for any given layer de-pended on the horizontal heterogeneity of rBC mass concen-trations measured, variability in the boundary layer height, and the number of samples collected in a given altitude range. Free troposphere (>3 km) rBC mass concentrations did not exceed 100 ng s m−3.
3.3 Light absorption measurements
The FAAM and DLR Falcon aircraft carried PSAP instru-ments to measure aerosol light absorption. The relationship between absorption and the mass of the absorbing species depends on the size, composition, structure and mixing state of the material (Bond and Bergstrom, 2006). The mea-surement of aerosol light absorption coefficients (bap) using filter-based techniques such as that employed by the PSAP is also prone to a number of artefacts as discussed previously. For these reasons we do not expectbap and rBC mass con-centrations measured by the SP2 to be perfectly correlated, but we do expect a positive relationship between the two. The PSAP data are also available over a broader geographic range and altitude range than the SP2 measurements, so we include them in our analysis of the rBC distribution over Eu-rope.
6 5 4 3 2 1 0
rBC mass fraction (%)
30 20 10 0 -10 Longitude (°) 300 250 200 150 100 50 0
rBC mass conc. (ng sm
-3 ) 12 10 8 6 4 2 0
Absorption coefficient (sMm
-1 )
A
B
C
455
Fig. 4. Whisker plots showing the statistics for(a)SP2-measured refractory black carbon (rBC) mass concentrations, (b) PSAP-measured absorption coefficients and(c)rBC mass fractions (cal-culated from rBC mass concentrations and PCASP-estimated mass concentrations) for 5◦ longitude bins during the EUCAARI-LONGREX component of the campaign. Whiskers indicate the minimum value to 25th percentile and 75th percentile to maximum value. Medians are indicated by horizontal lines, means by circles and the number of individual measurements for each bin are indi-cated to the right of the data points. Note the number of measure-ments in each bin are not identical because of differences in data coverage for the SP2, PSAP and PCASP.
regression coefficients for each fit represent the mass absorp-tion efficiency (α), however these values likely overestimate the trueαbecause the size range of the PSAP is larger than that of the SP2 and the PSAP measurement was likely af-fected by a number of artefacts discussed previously. We observed approximately twice as high α values during the September flights compared to the April and May observa-tion periods, but we did not observe a clear geographic pat-tern inαvalues. The correlation betweenbapand rBC mass concentrations was strongest for the 16 April (B357) flight which sampled relatively fresh emissions from the Manch-ester/Liverpool conurbation.
The FAAM aircraft PSAP measurements shown in Fig. 7a indicate a similar pattern inbapover Europe compared to the
8000 6000 4000 2000 0 Altitude (m)
0.01 1 100 rBC mass (ng sm-3)
10 8 6 4 2 0
Absorption coef. (sMm-1)
250 200 150 100 50
Dgm (nm) 200
150 100 50 0
A B C
Fig. 5. Profiles of(a)refractory black carbon (rBC) mass concen-trations on log and linear scales,(b)absorption coefficient and(c)
rBC mass mean diameter for all flights. Individual 30-s averaged points are shown in gray; mean values for 250 to 1000 m thick alti-tude bins are shown by black circles.
12 10 8 6 4 2 0
PSAP absorption coefficient (sMm
-1 )
300 200 100 0
SP2 rBC mass concentration (ng sm-3) 12 10 8 6 4 2 0 300 200 100 0 12 10 8 6 4 2 0 300 200 100 0 12 10 8 6 4 2 0 300 200 100 0
D: SLR < 3 km
y = 23x + 1.0 r2 = 0.53 A: B357 (16 April)
y = 30x - 0.5 r2 = 0.77
y = 22x - 0.2 r2 = 0.50
y = 47x - 0.8 r2 = 0.58
B: B363 (6 May)
B: B406 (25 September)
Fig. 6. Scatter plots comparing FAAM research aircraft PSAP-measured aerosol light absorption coefficients to SP2-PSAP-measured refractory black carbon mass concentrations for three individual flights during the(a)April, (b)May and (c)September portions of the campaign and(d)for all straight and level averages below 3 km altitude. The linear least-square regression of the PSAP data to the SP2 refractory black carbon concentration measurements and square of the Pearson correlation coefficient (r2) are also shown for each case.
60
55
50
45
30 20
10 0
-10 60
55
50
45
30 20
10 0
-10
A: BAe-146 B: DLR Falcon
5 4 3 2 1 0
Absorption coef. (sMm
-1
)
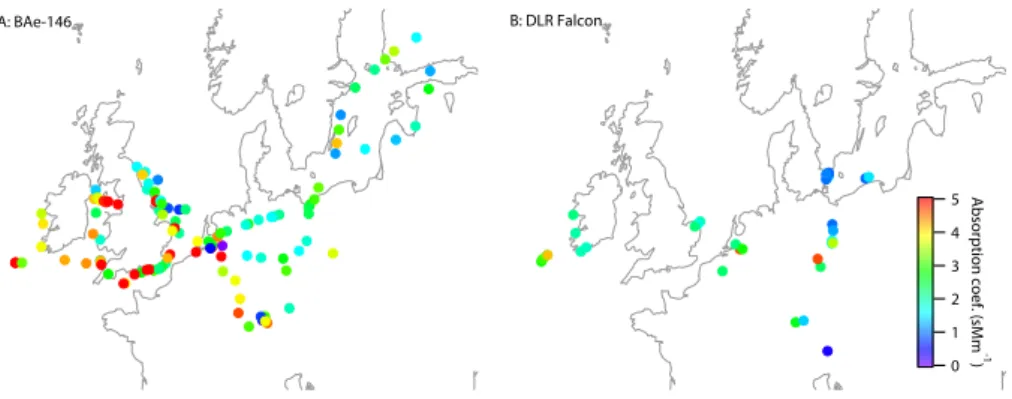
Fig. 7.Maps showing average aerosol light absorption coefficients measured by particle soot absorption photometers on the(a)FAAM and
(b)DLR research aircraft. Observations are restricted to periods when the aircraft were below 3 km altitude.
the measurement region. Figure 7b showsbapmeasured by the PSAP on board the DLR Falcon for periods when the aircraft was below 3 km in altitude. The average altitudes examined by both aircraft were similar, except the FAAM aircraft measurements around the UK were typically lower in altitude than the European FAAM and DLR aircraft mea-surements. The DLR observations displayed a similar spatial pattern to the FAAM results, with higher absorption coef-ficients measured near urban areas near Leipzig, Germany and Cabauw in the Netherlands. The Falcon PSAP measure-ments also found relatively highbap off the southwest coast of Ireland.
We also observed an east-west gradient inbapduring the high-pressure dominated periods of LONGREX, shown in Fig. 4. Profiles are not included in the longitude averages be-cause of uncertainties in the flow rate of the PSAP for chang-ing pressures. The averagebap doubled from approximately 2 sMm−1 (1 sMm−1 is 1 Mm−1 at STP) at the eastern end
of the measurement range to approximately 4 sMm−1at the western extreme. The general structure in the rBC andbap E-W gradients was similar. The largest variability in both mea-surements was observed in The Netherlands region (0–5◦E) where a number of individual plumes were encountered.
The FAAM aircraft and DLR Falcon participated in an inter-comparison exercise on the 9 May 2008 to compare a number of similar measurements on board each aircraft, including PSAP absorption coefficient measurements. The flights took place near the LONGREX base of operation, Oberpfaffenhofen, Germany. The FAAM aircraft uncor-rected PSAPbap averaged over the low-level (1200 m alti-tude) inter-comparison leg was 5.9±1.5 Mm−1compared to
the DLR Falcon uncorrected PSAPbap of 4.2±0.5 Mm−1. The corrected bap values measured by each aircraft were 3.1±0.7 Mm−1 and 2.7±0.4 Mm−1 for the FAAM aircraft and DLR Falcon, respectively.
3.4 rBC mass fractions
500
400
300
200
100
0
rBC mass concentration (ng sm
-3 )
400 300
200 100 0
Excess CO (ppbv)
500
400
300
200
100
0
400 300
200 100 0
Excess CO (ppb)
A B
Northern Germany: 2.3 ng sm-3 / ppbv
Cabauw region:
0.8 ng sm-3 / ppbv
Dallas/Houston region: 6.8 (Spackman et al., 2008)
Mexico City: 1.4 (Baumgardner et al., 2007)
B356 (England east coast) B357 (Liverpool/Manchester) B366 (Germany/Cabauw) B365 (Germany/Baltic) Downwind Mexico City: 2.9 (Subramanian et al., 2010)
Fig. 8. Refractory black carbon mass concentrations (ng s m−3) plotted against excess carbon monoxide mixing ratios (ppbv) for(a)8 May 2008 (B366) and(b)B366 and three additional flights. Each data point represents a 20–30 s average, depending on the AMS time resolution. Solid coloured lines in (a) give the linear regression (forced through the origin) of rBC onto excess CO. The dashed line in (b) shows the regression coefficient provided by Spackman et al. (2008) for aircraft-based measurements in urban and industrial outflow near Dallas and Houston, Texas, USA, adjusted to the same units as our data and for the 1.1 scaling factor applied to the Spackman et al. (2008) data. The solid and dotted lines show the regressions reported by Baumgardner et al. (2007) and Subramanian et al. (2010) for ground- and aircraft-based SP2 observations in and downwind of Mexico City.
3.5 Relationship between black carbon and carbon monoxide
Black carbon and carbon monoxide (CO) are both products of incomplete combustion and have similar sources, such as traffic exhaust and biomass burning. Their emission ratios constrain global and regional models, providing a useful test for their performance. The emission ratio of rBC to CO varies significantly with source (Bond et al., 2004), so varia-tions in measured ratios can indicate the presence of different sources. Other factors influence rBC-CO ratios. rBC is re-moved by wet deposition, but CO is not. Unlike rBC, CO has a significant source from VOC oxidation. The atmospheric lifetime of rBC is shorter than CO (approximately 10 days versus 1 month in summer), so variations in rBC-CO ratios also reflect sample age and wet removal processes in addi-tion to sources. We expect the loss of rBC in precipitaaddi-tion scavenging in the boundary layer to be minor for most of the flights considered here due to the absence of precipitation in the study region.
To examine European-scale emissions, we first estimated and removed “background” CO mixing ratios from the in-tercept of the linear regression of CO mixing ratio on rBC mass concentrations for each flight, reported in Table 2. We refer to CO mixing ratios above this background as “excess” CO (1CO). The analysis was not performed for flights with poor rBC or CO data coverage or when there was only a “weak” correlation (r2<0.5) between rBC and CO, making it difficult to determine the background CO value. Mor-gan et al. (2010a) identified two distinct periods during the LONGREX campaign based on gas-phase measurements,
including CO, and changes in meteorology: LONGREX-1 (6–8 May) and LONGREX-2 (10–14 May). Flow during LONGREX-1 was more zonal compared to LONGREX-2, by which point the high pressure system established more anti-cyclonic flow over the region, with a stronger northerly component (Morgan et al., 2010a). Background CO mixing ratios during LONGREX-1 were on the order of 200 ppbv compared to approximately 120 ppbv during LONGREX-2 and after. Carbon monoxide concentrations were between 150–180 ppbv during the April ADIENT flights. The CO instrument was not available for the September ADIENT flights.
The relationship between rBC and1CO was determined by performing a linear regression of rBC mass concentra-tions onto the 1CO mixing ratios. Two regressions were performed in cases where a clear non-linearity in the rela-tionship between rBC and1CO was observed which were associated with distinct periods in time and space. For ex-ample, during the 8 May 2008 afternoon flight (B366), we observed two distinct relationships between rBC and1CO over northern Germany and in plumes in the Cabauw region of the Netherlands (Fig. 8a).
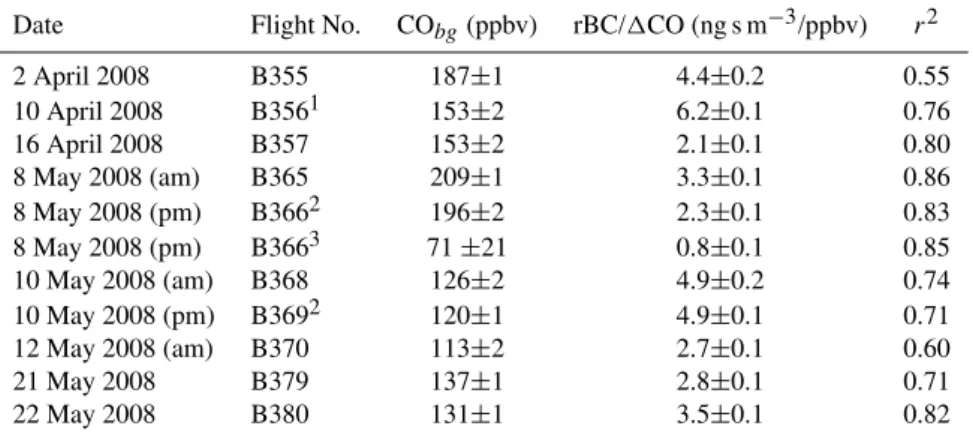
Table 2.List of flight-averaged “background” carbon monoxide (CObg) mixing ratios, rBC/1CO ratios, and coefficient of determination for the relationship between rBC mass concentrations and1CO mixing ratios. Statistical uncertainties from the regressions used to obtain the CObgvalues and rBC/1CO ratios are also listed.
Date Flight No. CObg(ppbv) rBC/1CO (ng s m−3/ppbv) r2
2 April 2008 B355 187±1 4.4±0.2 0.55
10 April 2008 B3561 153±2 6.2±0.1 0.76
16 April 2008 B357 153±2 2.1±0.1 0.80
8 May 2008 (am) B365 209±1 3.3±0.1 0.86
8 May 2008 (pm) B3662 196±2 2.3±0.1 0.83 8 May 2008 (pm) B3663 71±21 0.8±0.1 0.85
10 May 2008 (am) B368 126±2 4.9±0.2 0.74
10 May 2008 (pm) B3692 120±1 4.9±0.1 0.71
12 May 2008 (am) B370 113±2 2.7±0.1 0.60
21 May 2008 B379 137±1 2.8±0.1 0.71
22 May 2008 B380 131±1 3.5±0.1 0.82
1 Non-plume
2 Northern Germany only 3 Cabauw, Netherlands only
ratios for flights where the background CO could be deter-mined with confidence. They were lowest in the Manch-ester/Liverpool plume and near Cabauw in the Netherlands. The highest ratios were observed off of the UK eastern coast in April, with intermediate values over northern Germany and off the south coast of the UK.
3.6 Black carbon size distributions
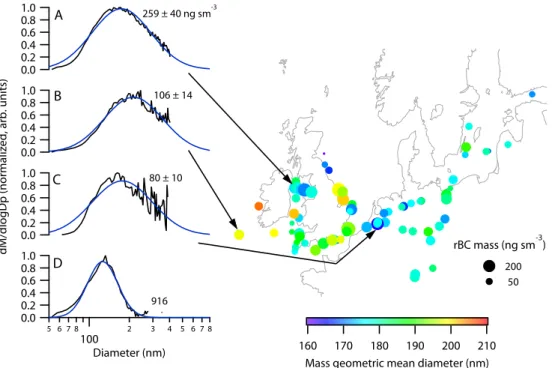
Examples of four normalized rBC “core” mass distributions averaged over segments of individual flights are shown in Fig. 9a–d. Note that the rBC “core” mass distributions do not include the contribution by non-rBC material to the parti-cle diameter. rBC partiparti-cles internally mixed with appreciable amounts of non-rBC material will be larger than our reported diameters. Distributions a–c are averages of mass distribu-tions measured in the Liverpool/Manchester plume, over the Atlantic Ocean, and in the vicinity of Cabauw, Netherlands, respectively, while distribution d was observed on the ground at Cranfield, UK (the aircraft’s base of operations during the ADIENT missions) at the end of the 23 September (B404) flight. The Liverpool/Manchester and Cabauw distributions represent relatively fresh outflow from urban areas while the Atlantic Ocean observations represent relatively processed continental outflow. These classifications are based on an analysis of the meteorology and AMS organic aerosol char-acteristics during the campaign (Hamburger et al., 2010; Morgan et al., 2010a). The Cranfield ground-based distri-bution represents fresh emissions, most likely from jet en-gine exhaust or the ground power unit (GPU) used to provide power to the aircraft on the ground.
We fit log-normal distributions to the data (e.g., Schwarz et al., 2006) to determine the mass median diameter (MMD)
and geometric standard deviation (σg) for each distribution, listed in Table 4. All four distributions are described well by a single log-normal fit, consistent with previous observations (Schwarz et al., 2006; Shiraiwa et al., 2007; Schwarz et al., 2008b; Subramanian et al., 2010, e.g.,). The Cranfield dis-tribution had the smallest MMD, followed by the two fresh urban outflow distributions and the processed Irish Sea ob-servations. The differences between ambient and Cranfield distributions were much larger than the differences among ambient distributions observed during the campaign.
We also calculated the mass geometric mean diameter
(Dgm) for each AMS-averaged rBC mass distribution using:
logDgm=
PDmax
DminlogDg,idMi
M (1)
whereDmaxandDminare the upper and lower diameter limits
of the valid measurement range,Dg,iis the geometric mid-point of each bin in the size distribution, dMi is the mass in each bin, andM is the total rBC mass. Note thatDgmis not equivalent to the MMD obtained from the log-normal fit because of the different weighting given to the bins. For ex-ample,Dgm measured over the Atlantic Ocean was 199 nm compared to the fit mean size of 210 nm for the size distribu-tion illustrated in Fig. 9.
62
60
58
56
54
52
50
48
30 20
10 0
-10 1.0
0.8 0.6 0.4 0.2 0.0
5 6 7 8
100 2 3 4 5 6 7 8 Diameter (nm) 1.0
0.8 0.6 0.4 0.2 0.0
dM/dlogDp (normalized, arb. units)
1.0 0.8 0.6 0.4 0.2 0.0 1.0 0.8 0.6 0.4 0.2 0.0
50 200
210 200 190 180 170 160
Mass geometric mean diameter (nm) A
B
C
D
rBC mass (ng sm-3)
106 ± 14
916 80 ± 10
259 ± 40 ng sm-3
Fig. 9.Map showing refractory black carbon (rBC) mass concentrations and geometric mean diameters averaged over straight and level runs (SLRs) below 3 km. Points are scaled by rBC mass concentration and shaded by geometric mean diameter. Mass distributions (dM/dlogDp), normalized by their peak value and averaged in three different regions (a–c, indicated by black arrows) are also shown. A fourth mass size distribution(d)shows the rBC distribution measured on the ground at the aircraft base in close proximity to ground power units and other aircraft. rBC mass concentrations for each mass distribution are also shown.
25x10-3
20
15
10
5
0
Probability density
200 150
100
rBC 'core' mass geometric mean diameter (nm) all measurements
< 3 km only
Fig. 10.SP2-measured refractory black carbon (rBC) “core” mass geometric mean diameters shown as a probability distribution func-tion (PDF) for all flights (black) and only periods when the aircraft altitude was below 3 km (red). The 20–30 s AMS-time series aver-aged data were used to determine the PDF. Both distributions peak in the bin spanning 175 to 180 nm.
those observed over continental Europe or Liverpool, for ex-ample. The SLR-averaged observations do not show a strong east-west or north-south trend, though individual flights did
show a slight decrease in the mean rBC size going from east to west over northern Europe. The rBCDgm values tended to decrease with increasing altitude (Fig. 5c). The study-average mean diameter for the lowest 500 m was approxi-mately 185 nm compared to approxiapproxi-mately 150 nm near the top of the boundary layer and 100 nm in the free troposphere. The probability density functions for rBC “core”Dgmvalues measured at all altitudes and restricted to<3 km are shown in Fig. 10.
4 Discussion
4.1 Spatial distribution
The lack of precipitation during the high pressure system-dominated period during LONGREX means that the air mass sampled to the west of continental Europe represented the integral of emissions into the airmass as it travelled across Europe. The rBC mass concentrations measured in this re-gion therefore represent a polluted continental background for rBC. The mean rBC mass concentration west of 3◦E during this period was 140±50 ng s m−3 (±1 standard de-viation), within the range of continental background values reported by Schwarz et al. (2008a) based on SP2 measure-ments made over Texas. Shiraiwa et al. (2008) reported rBC mass concentrations measured by a ground-based SP2 of 230–510 ng m−3in outflow from Japan, Korea and China,
between 2–5 times larger than our measurements of Euro-pean continental outflow. These figures are consistent with the Bond et al. (2004) emission inventory, which estimated rBC emissions from contained combustion in Asia (in 1996) were 4–5 times higher than those from Europe (Bond et al., 2004). Note that the previous SP2 studies used different mul-tipliers to account for rBC not sampled by the SP2. We do not apply a scaling factor, but Schwarz et al. (2008a) apply a correction of 1.1 and Shiraiwa et al. (2008) use the log-normal integrated mass rather than the direct observations.
Modelling studies suggest rBC concentrations at the sur-face across Europe range from roughly 0.3–1.0 µg m−3
(Schaap et al., 2004; Marmer and Langmann, 2007; Tsyro et al., 2007). The global models included in the AeroCom aerosol model inter-comparison (http://nansen.ipsl.jussieu. fr/AEROCOM) tended to agree with surface observations in Europe, but overestimated rBC aloft (Koch et al., 2009). Evaluation of model results has been complicated by the va-riety of rBC definitions and their relationship to specific mea-surement techniques (Andreae and Gelencser, 2006; Bond and Bergstrom, 2006; Tsyro et al., 2007; Koch et al., 2009). Emission inventories used as model inputs are often based on different measurement methods than those used to evaluate the predicted mass concentrations (e.g., Vignati et al., 2010). Even if identical measurement approaches are used, artefacts can affect the results differently due to variable aerosol (e.g., dust, biomass burning emissions) and gas-phase volatile or-ganic compound (VOC) properties.
The SLR-averaged rBC mass concentrations observed in this study are lower than the modelled surface EC concen-trations of 0.3–1.0 µg m−3 over Europe reported by Tsyro
et al. (2007), but they also reported their model results were similar to EC concentrations observed at six ground-based measurement locations. Differences in the ground and air-craft observations may reflect vertical gradients in concen-trations, the seasonal variability in rBC emissions and dif-ferences in the rBC measurement method (SP2 versus filter OC/EC analysis). For example, Tsyro et al. (2007) use an EC
Table 3. Mean refractory black carbon (rBC) mass concentrations and mass geometric mean diameters (±1 standard deviation) mea-sured by the SP2 aboard the FAAM aircraft and averaged over alti-tude bins for all flights.
Altitude range rBC mass Dgm (km) (ng s m−3) (nm) 0–0.25 120±80 180±15 0.25–0.50 90±60 180±20 0.50–0.75 90±60 180±15 0.75–1.0 90±50 180±20 1.0–1.5 70±50 180±15 1.5–2.0 50±60 160±20 2.0–2.5 60±140 160±30 2.5–3.0 4±7 140±30 3.0–3.5 4±5 140±50 3.5–4 7±7 140±30 4–5 7±15 130±30 5–6 3±2 120±30 6–7 4±4 130±40 7—8 5±4 120±30 8–9 2±2 110±20
emission inventory (Kupiainen and Klimont, 2007) that re-lies on thermo-optical methods. Despite the discrepancies in absolute concentrations, the spatial pattern of rBC observed during LONGREX (higher concentrations over northwest-ern Europe) was similar to the annually-averaged distribu-tion predicted by Tsyro et al. (2007) and also observed in EC filter observations for the period July 2002 to June 2003.
There are several possible explanations for higher mea-sured and modelled EC concentrations reported previously and our results. The model concentrations are averages of a two-year simulation from 2002–2004, while we report a snapshot of concentration measurements from the early sum-mer and fall of 2008. Black carbon concentrations in Europe are generally lower in the summer due to the reduction of emissions from domestic wood burning (Tsyro et al., 2007). For example, wintertime EC concentrations in Europe were roughly a factor of 2 higher than those in the summer (Tsyro et al., 2007). Emission factors used by the model and the observations are based on EC measurements, which may be systematically higher or lower than rBC concentrations mea-sured by the SP2, but there are currently no comparisons be-tween SP2 observed rBC and filter-measured EC available to investigate this further. The filter data also sampled particles over a wider diameter range compared to the SP2, though this comparison is complicated by the mixing state of the parti-cles and methods used to determine the rBC particle size.
Table 4. Summary of regionally-averaged refractory black carbon (rBC) mass distribution statistics. MMD refers to the mass median diameter of the log-normal fit to the average size distribution,σg is the width of the log-normal fit, andDgmis the average mass mean diameter calculated from Eq. (1). Regions are identified in Fig. 9
Date Flight ID Region MMD (log-normal fit) σg(log-normal) Dgm(nm)
16 April B357 A: Liverpool plume 173 0.72 170
21 May B379 C: Cabauw 178 0.74 180
14 May B374 B: Atlantic Ocean 199 0.72 210
23 September B404 D: Cranfield airport 126 0.37 130
rBC mass concentrations we measured at altitudes above 8 km were 2±2 ng s m−3, consistent with the Baumgardner
et al. (2008) observations. Schwarz et al. (2008b) also ob-served similar (within a factor of 2) rBC mass concentra-tions in the upper troposphere-lower stratosphere region in the tropics. No previous SP2-measured rBC mass concentra-tion profiles have been reported over Europe, but the struc-ture and magnitude of the rBC mass concentration profiles we observed were qualitatively similar to other rBC profiles measured using an SP2 over North America (Schwarz et al., 2006, 2008b,a; Spackman et al., 2008). We observed weaker rBC concentration gradients in the boundary layer compared to the North American studies, which is likely due to the well mixed boundary layer that was capped by the strong inver-sion during the high-pressure period during LONGREX. The high variability in rBC mass concentrations near the surface reflects the proximity to point sources encountered at low al-titudes during most flights.
4.2 Light absorption measurements and relationship to black carbon
The FAAM aircraft uncorrected PSAP measurements were about 50% higher than the DLR Falcon data during the inter-comparison flight, but agreed to within 20% after corrections were applied. Observations made from the two platforms in roughly the same locations during the campaign agreed to within 20–30%. We make no claim that either measurement is the more accurate as both are subject to considerable un-certainties.
We have some confidence in the relative changes in ab-sorption coefficients observed on both aircraft, but less so in the absolute accuracy of the measurements. The FAAM PSAP measurements were generally correlated with the SP2 rBC mass measurements, but the ratio of absorption to rBC mass (the mass absorption efficiency, MAE) was consider-ably higher than previous observations and theoretical pre-dictions. Subramanian et al. (2010) found an average MAE of 13.1 m2g−1 at 550 nm over Mexico using a PSAP and SP2 and Bond and Bergstrom (2006) recommend a MAE of 7.5±1.2 m2g−1 at 550 nm for uncoated rBC particles. Coatings may enhance the MAE of rBC, but the MAE val-ues calculated for the PSAP and SP2 measurements on the
FAAM aircraft would require a coating enhancement on the order of at least 100–200% to be reconciled with literature values. Such enhancements are theoretically possible, but higher than previously reported and recommended (e.g., 30– 50%, Bond et al., 2006; Schwarz et al., 2008b).
Mineral dust can also absorb light and may have been re-sponsible for some of the additional observed absorption, however we believe the contribution by mineral dust to the PSAP observations was minor because the Rosemount inlets did not sample coarse (>3 µm) aerosol efficiently (Haywood et al., 2003) and the contribution by the coarse mode parti-cles (measured by the PCASP) to sub-3 µm volume was less than 30% in regions with high absorption coefficients. The estimated absorption by the 1–3 µm particles typically mea-sured by the PCASP was calculated assuming a conservative estimate of mineral dust MAE of 0.05 m2g−1(Clarke et al.,
2004) and density of 2.5 g cm−3. The estimated absorption
was between 10–20% of the total absorption measured by the PSAP. There was no correlation between the coarse mode es-timated mass concentrations and increases in the absorption coefficient to rBC mass concentration ratio, which would be expected if mineral dust played a significant role in the ab-sorption.
4.3 Black carbon mass fractions
The pattern of relatively homogeneous rBC mass frac-tions has been observed previously in Europe using ground-based filter sampling methods. Putaud et al. (2004) found that rBC (measured using thermal-optical EC measurement techniques) represented 8% of non-kerbside PM2.5 measure-ments at 24 sites. The measuremeasure-ments included a number of “urban background” (defined as urban locations with fewer than 2500 vehicles/day within a 50 m radius) and “near city background” (defined as locations within 3–10 km of large pollution sources), as well as “natural background” sites at least 50 km from any major pollution sources. Despite ob-serving a lower overall rBC mass loading, we found a simi-lar result in that rBC mass fractions were not higher at “re-mote” locations over the Baltic Sea compared to observations in urban plumes. The only exception was the higher rBC mass fractions calculated assuming AMS mass in the Manch-ester/Liverpool plume, but this result was not observed when two higher estimates of sub-micron aerosol mass (derived from PCASP and SP2 scattering aerosol volume concentra-tions) were used to calculate rBC mass fractions. Shiraiwa et al. (2008) also found only small differences between rBC mass fractions measured in air masses originating from dif-ferent sectors in east Asia, including maritime environments and the free troposphere. They observed highest rBC mass fractions in samples originating from the free troposphere (2.6%) and lowest rBC mass fractions in marine samples (1.4%), similar with range of values observed in this study.
Model calculations of EC mass fraction of PM2.5over
Eu-rope predict regional background EC mass fractions vary from 3–7% across Europe, with higher mass fractions (7-15%) observed in urban residential/commercial regions (Tsyro et al., 2007). The lower end of the model’s urban res-idential/commercial range is similar to the maximum values we observed and also to previous SP2 rBC measurements in other locations, but its regional background values are about a factor of two higher than our observed values away from source regions. The model used by Tsyro et al. (2007) did not include secondary organic aerosol (SOA) contributions to to-tal mass, however, and we believe secondary material, partic-ularly ammonium nitrate, represented a substantial fraction of sub-micron aerosol mass measured in our study (Morgan et al., 2010a). The model mass fractions are therefore an upper estimate (Tsyro et al., 2007) consistent with our obser-vations.
4.4 Relationship to gas-phase species
Morgan et al. (2010a) used O3/NOxratios to divide the
LON-GREX and ADIENT data into five categories: near-urban (0<O3/NOx<0.1), near-source (0.1<O3/NOx<1),
near-outflow (1<O3/NOx<10), far-outflow (10<O3/NOx<50),
and background (50<O3/NOx). We used the same
classifi-cation scheme to examine rBC mass concentrations,bapand the rBC/1CO ratios observed. The results are shown as a whisker plot in Fig. 11. The mean, median, and range of
observed rBC mass concentrations shown in Fig. 11a gener-ally decreased going from near-urban (lowest O3/NOxratios)
to background conditions (highest O3/NOxratios). Aerosol
light absorption (Fig. 11b) follows a similar pattern, except that the highest observations typically fell in the near-source classification rather than the near-urban classification. Its possible thatbap initially increases as rBC becomes mixed with additional aerosol species, leading to an enhancement in light absorption or increased PSAP artefacts. We investi-gate this phenomenon in detail in the companion manuscript examining rBC mixing state (McMeeking et al., 2010).
The rBC/1CO ratios displayed the opposite trend ob-served for rBC mass concentrations andbap, increasing with increasing distance from source (Fig. 11c). The lowest ra-tios were observed for the near-urban air mass classification and the highest ratios were observed for the far-outflow and background classifications. This finding was consistent with the flight-averaged and SLR-averaged results discussed pre-viously, where we observed lower ratios near source regions over the English Channel and Cabauw region and higher ra-tios off of the east coast of the UK and over northern Ger-many.
The European results are consistent with previous stud-ies comparing CO to SP2-measured rBC mass concentra-tions. Spackman et al. (2008) report an average SP2-measured rBC/1CO ratio of 6.8 ng rBC s m−3ppbv−1 CO for urban/industrial outflow in Texas. We adjusted their re-ported value of 5.8 ng rBC kg−1dry air to ng rBC s m−3and removed the 1.1 multiplying factor Spackman et al. (2008) used to scale the rBC mass concentrations. Their observed rBC/1CO ratio agrees well with the England east coast flight (B356) and others in near-outflow to background air mass classifications. Baumgardner et al. (2007) reported an rBC/CO ratio of 1.0 ng rBC m−3ppbv−1 CO (1.4 ng rBC s m−3ppbv−1CO adjusted to STP assuming ment made at 780 hPa and 290 K) for ground-based measure-ments in Mexico City. Subramanian et al. (2010) observed a higher average ratio of 2.9 (ng s m−3) over Mexico.
600 500 400 300 200 100 0
rBC mass conc. (ng sm
-3 )
Near-urban (0-0.1) Near-source (0.1-1) Near-outflow (1-10) Far-outflow (10-50) Background (>50)
12 10 8 6 4 2 0
Absorption coefficient (sMm
-1 )
10
8
6
4
2
0
rBC / Excess CO
148
1651
1799 311
342
49
411
1124
286 77
91
1031 1091
95 177
A
B
C
916
Fig. 11. Whisker plots showing the mean (circles), median (hori-zontal dash), minimum, maximum, 25th and 75th percentiles (ver-tical lines) classified by air mass type for(a)refractory black carbon (rBC) mass,(b)light absorption coefficient at 550 nm, and(c)ratio of rBC to excess carbon monoxide mixing ratios (ng s m−3/ ppbv). Air masses are defined using ratios of O3/NOx(listed with air mass
label) following Morgan et al. (2010a). The number of individual data points in each bin are given to the right of the data. Maxi-mum rBC/CO ratios are truncated to 10 and only median values are shown due to bias from high ratios associated with variability in the rBC/CO ratios.
ratios were observed near major source regions, and that higher ratios were observed in more chemically processed air masses. High rBC/1CO ratios were associated with regions
of high ozone concentrations relative to NOx. A factor
anal-ysis of the organic aerosol loadings observed by the AMS showed enhanced oxidized organic aerosol concentrations in the same regions (Morgan et al., 2010a). These observations support the conclusion that the different rBC/1CO ratios ob-served in this study are attributable to differences in emission sources (particularly vehicle fleets and industrial sources) rather than rBC or CO processing and removal mechanisms. 4.5 Black carbon size distributions
Prior to the development of the SP2, information regarding rBC size relied on filter and cascade impactor techniques (e.g., Kleeman et al., 2000; Putaud et al., 2004; Hitzenberger et al., 2006). Comparing SP2 data to filter and cascade im-pactor data is not straight forward, however, because the off-line techniques segregate particles on the basis of their aero-dynamic diameter, which depends not only on the rBC mass, but also on the amount of material mixed with each rBC “core”. The SP2 quantifies mass of the rBC core. In this sense, the impactor and filter data represent upper-limits to the expected rBC distribution range. Filter and impactor data show the vast majority of rBC mass is associated particles in the sub-micron or PM2.5(particulate matter below 2.5 µm