Induction motor voltage flicker analysis
and its mitigation measures using custom
power devices: A case study
SANJAY. A. DEOKARHead & Assistant Professor, Electrical Engineering Department, Zeal Education Society, Dnyanganga College of Engineering and Research, Pune University, Pune-41, Maharashtra, India
Dr. L. M. WAGHMARE
Professor and Research Dean, Instrumentation Engineering Department, SGGS, Institute of Engineering and Technology, Vishnupuri, Nanded-431606, India.
Abstract:
This paper suggests methods for estimating short time flicker (PST) severity on 22/3.3 kV network supplying
induction motor loads of municipal integrated water pumping system. The impact of additional connection of induction motors to the same system has been analyzed. Measurements are done at the point of common coupling (PCC) to identify background short time flicker levels and the contribution of the already operating induction motors. The paper also analyses and compares different voltage flicker mitigation methodologies to assess their performance with change in line impedance phase angle for this particular application. Here, Matlab-7.01/PSB is used to present the detailed results of all voltage flickers compensating methodologies and to assess the impact of line impedance X/R sweep on effectiveness of custom power devices. It is observed that distribution static synchronous compensator (DSTATCOM) is found more effective for compensating voltage flicker generated by the induction motor load.
Keywords: Voltage flicker; Short time flicker measurement; Flicker severity curve; Mitigation measures; Point of common coupling; DSTATCOM.
1. INTRODUCTION
A modern consumer requires high quality power supply for their sensitive loads; hence voltage flicker has therefore been an important power quality issue. It is reported that a small voltage fluctuations of less than o.5% in the frequency range of 5-10 Hz can cause visible lamp voltage flicker [1].The main sources of voltage fluctuations can be divided into two main categories1) step voltages changes regular in time and 2) cyclic voltage changes. HV/MV loads that lead to voltage fluctuations are arcing furnaces, welding machines, rolling mills, mine winders, large capacitor bank used for power factor improvements and electric boilers. An example of a low voltage load that leads to voltage fluctuations are copying machine, X-ray equipments, drives for lifts, pumps, fans, refrigerators and electric cookers[1], [2], [3].In certain circumstances, superimposed inter harmonics in the supply voltage can lead to oscillating luminous flux. Sources of inter harmonics which are responsible for flickers, include static frequency converters, sub-synchronous converter, induction machines and arc furnaces [1], [2].
mitigation methodologies can be studied in [9], [10].
The limits of flicker emission for an individual fluctuating load must be determined in order to assure that the total flicker injection from all types of loads does not exceeding the planning levels. Procedure for determining the requirements for connecting large fluctuating loads to MV and HV levels are explained in IEC 61000-3-7 [11], [12].Flicker emission planning levels provided by IEC must be always less than or equal to the compatibility levels for LV and MV systems. The IEC 61000-3-3 [13] provides and explains voltage flicker emission limits for the equipments connected to LV systems. The standard IEC 61000-4-15 [1], [2], [14] gives the functional and design specifications for flicker measurement apparatus to indicate the correct flicker perception level for all practical voltage fluctuation waveforms. In this, the overall response from the instrument input to output is given for a sinusoidal and rectangular voltage change at frequencies between 0.5 and 25 Hz. It also includes a performance test to define a set of rectangular voltage changes of different frequencies and depths for which the short time flicker severity, PST must be 1.00 ± 5 %.It includes standard models for 230 V, 60 W and 120 V, 60 W lamps. The flicker
meter can be used to for the loads that are already in operation. However, direct measurement using flicker meter cannot be applied in the design or planning stage of an installation. In these cases, some analytical methods are required so that flicker severity level should not exceed than the planned level. Such analytical method also helps in determining and finalizing mitigation methodology [2], [11], [12], [15].
This paper presents a case study of huge municipal water pumping station. In this case study, the unity flicker severity curve method and analytical method based on calculation of flicker time is used for evaluating the connection of induction motors. During this study, the measurement of the background flicker and the flicker caused by the existing two induction motors were carried out using Dranetz BMI make power Xplorer PX5, power quality analyzer whose algorithm is based on the IEC-6100-4-30/IEEE-1159. It also discuses’ the importance of investment involved and compares the mitigation methods used to increase the short circuit power, and the custom power methods applied to strengthen the network reactive power at PCC.
This paper is organized in the following sections: In section 2, basic voltage flicker concept is explained. The section 3 covers simplified methods for voltage flicker assessment followed by an experimental analysis in section 4. In section 5, detailed results of each of the mitigation methods for voltage flicker using the Matlab/PSB simulations have been presented. The impact of the change in the line impedance X/R ratio on the voltage flicker compensation confirms the theoretical analysis given in Appendix-A, is covered in section 6 followed by the conclusions in section 7.
2. CONCEPT OF VOLTAGE FLICKER
The flicker is defined as “the impression of unsteadiness of visual sensation induced by a light stimulus whose luminance or spectral distribution fluctuates with time” [2], [4], [5], [16]. The Fig.1, illustrates an example of a sinusoidal wave with rectangular voltage changes of amplitude 40% and a frequency 8.8 Hz [2]. Flicker is simply amplitude modulation where the main signal (50 Hz for Asian Countries) is the carrier signal and flicker is the modulating signal. The usual method for expressing voltage flicker is similar to that of amplitude modulation. The relative voltage change is expressed in percent value and is designated as
d
can be related to flickering severity by different approximate approaches. Voltage flicker is usually expressed as a percent of the total change in voltage with respect to the average voltage over a specified time interval. The corresponding instantaneous voltage can be expressed as:)
2
cos(
)
2
sin(
1
(
)
(
t
V
m
f
t
f
0t
V
P
m
(1) Where,P
V
- Peak amplitude of the fundamental ac voltagem
f
-Modulation frequency 0f
- Fundamental frequency,P
V
V
m
2
- Modulation depthV
- Magnitude of voltage fluctuationsThe perceptibility of flicker depends on the magnitude
V
and the frequency
f
m of voltage fluctuations.
t
V
f
t
mV
f
f
t
mV
f
f
t
V
P mm P
P
0 0sin
2
02
2
sin
2
2
cos
(2)According to Eq. (2), in addition to the component at fundamental frequency
f
0 ,V
t
contains two side bands, one at a super-synchronous frequency
f
0
f
m
and another at a sub-synchronous frequency
f
0
f
m
. Anindividual frequency component of relatively significant magnitude can result in frequency beating with the fundamental, leading to oscillations in the voltage envelope. Therefore; the definition of flicker cannot be restricted to amplitude modulation.
Fig.1. Sinusoidal voltage cyclic flicker: Rectangular voltage change
d
V
/
V
= 40 %.3. SIMPLIFIED METHODS FOR SHORT TIME VOLTAGE FLICKER (PST) ASSESMENT
A voltage flicker assessment method includes three steps .Calculation of 1. Maximum relative voltage change produced by the fluctuating load. 2. Flicker severity caused by that voltage change and 3. Addition of flicker originating from multiple sources [2], [11].
3.1 Assessment of relative voltage change
For balanced three-phase loads, the %d can be calculated approximately as:
%d
%
100
SC MAX
S
S
V
(3)Where
S
MAXis the maximum apparent power change andS
SC the short-circuit power of the feeding network at the point of common coupling. If the active as well as the reactive part of the load change is known, the relative voltage change can be calculated more accurately by using the resistive and inductive part of the network impedance using Eq.(4) as given below.100
%
2
2 2
Vs
Q
X
P
R
d
PCC PCC(4) where
R
PCC2is the resistive part of the network impedance;X
PCC2 is the reactance of the network impedance ;V
Sis the nominal voltage at the point of common coupling;
P
and
Q
are the active and reactive power changes of the load. As par IEC-61000-4-15 [14], voltage flicker level in any MV installations should not exceed 0.9.3.2 Calculation of flicker severity
Once the relative voltage change caused by the fluctuating load is known, PST can be estimated by two
methods as given below.
To apply this method, the percent relative voltage change
d
and the repetition rater
of this voltage change must be known. If the voltage fluctuations are described by a frequency, this means that the repetition rate of the voltage fluctuations is twice the value, i.e. 1 Hz corresponds to two changes per second. Substituting the number of voltage changes per minute into the severity curve for rectangular steps provides on the ordinates, the voltage change,d
V
V
%
which producesP
STO
1
.If the voltage step change calculated for the load has a valued
, the corresponding flicker severity is given below.
do
d
P
P
ST
STO (5)The voltage fluctuations at a certain location can be obtained by comparing the fluctuations with a unity voltage flicker curve.
3.2.1 Addition of flicker originating from multiple sources
The IEC 61000-3-7 [11] provides rules to consider the summation effect of PST values caused by multiple
disturbing sources. The PST originated by various loads operating simultaneously can be obtained from the following
Eq. (6). PST m
i m STi
P
(6)Where the
P
STi is the individual levels of flicker severity emitted by each of the disturbing loads. The value of the coefficient m depends upon the characteristics of the sources of fluctuation. Generally, m=3 for the value used in most of the types of voltage variations where the risk of coincident voltage changes is small.4. FIELD TEST CONDUCTED AT WATER PUMPING STATION
During energy and power quality audit of pune municipal corporation , it is observed that presently only two induction motors (IM1 and IM2, 450 kW each) are used for one of its water pumping facility and want to
connect two additional induction motors (IM3 and IM4,450 kW each) of same rating to increase the water pumping
capacity. In this case study, simplified assessment methods applied for evaluating the connection of a new IM3 and
IM4 induction motor loads to an existing network. Short term voltage flicker level observed during measurements
for Induction motor IM1 and IM2 at PCC2 are given in Table 1.
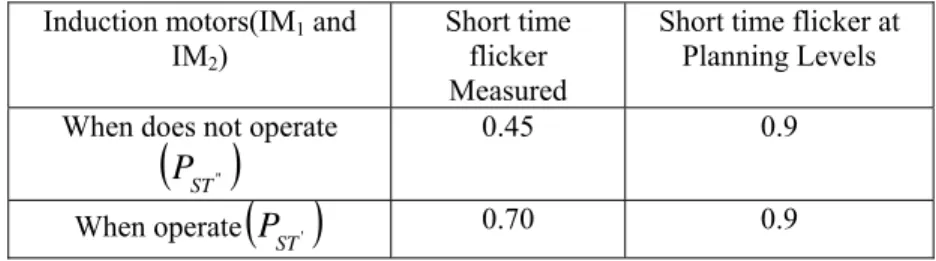
Table 1. Short term flicker severity measured for IM1 and IM2
Induction motors(IM1 and
IM2)
Short time flicker Measured
Short time flicker at Planning Levels When does not operate
P
ST"0.45 0.9
When operate
P
ST' 0.70 0.94.1 Analysis and evaluation of additional connection of three phase induction motors at the point of common coupling (PCC)-A network under study
As an induction motor is started up, most of the power drawn by the motor is reactive. This results in a large voltage drop across distribution lines. Measured powers of IM1 and IM2 when operates simultaneously is
shown in Table 2.
Induction Motors IM1 and IM2 Active
Power(P) in KW
Reactive Power(Q) in KVAR
Apparent Power(S) in KVA
When operates with full load 871 445.32 978.24
Difference of Minimum/Maximum Power Variations
6.6 4.34 7.8
From Table 2 it is observed that there is a variation in both active and reactive part of the power. Dynamic voltage fluctuations are usually caused by the starting and stopping of motors. Here as per water demand, discharge pipe valve setting of an induction motors keeps on changing. Although a single induction motor alone may not generate flicker complaints, the cumulative effect of several motors starting randomly on a distribution feeder can generate objectionable flicker.
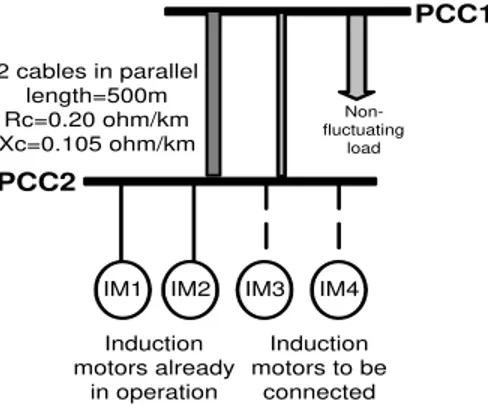
The single line diagram of the network in which field measurements were carried out is shown in Fig.2. The transformer (
22
kV
/
3
.
3
kV
) has a rated apparent power of 2.5MVA.The cable connection between water pumping station and the transformer is approximately500
m
long. The cable impedance isphase
km
j
0
.
105
/
/
120
.
0
according to available network data. The power quality analyzer was connected at the monitoring point PCC2.Non-fluctuating
load
IM1 IM2 IM3 IM4
Induction motors already
in operation 450kW each
Induction motors to be
connected 450kW each
A.C. Supply 22kV, 200MVA, Xcc/Rcc=30
2.5MVA, 22kV/3.3kV Xcc=5% Rcc=0.4%
Underground cable length=500m Rc=0.20 ohm/km Xc=0.105 ohm/km
PCC2
PCC1
Fig.2: Simplified single line diagram of the actual network under study
4.2 Statistical analysis of flicker severity caused by induction motors IM1 and IM2 at PCC2
Short time voltage flicker levels of existing two induction motors are measured and can be calculated using cubic summation laws as per Eq. (6) [4].
PST1
3P
3ST'
P
3ST"
0
.
63153
(7) WhereP
ST'
0
.
70
andP
ST"
0
.
45
are measured short time flicker levels when above two inductionmotors are in operation and vice versa. The PST1 is the flicker severity contribution of induction motors IM1 and IM2
to the planning level PST at PCC2.
4.3 Voltage change caused by the connection of induction motors IM3 and IM4 at PCC2
Source impedance: As indicated in Fig.2, the short circuit power of the network at 22KV source is 200 MVA as per network data available. Therefore, source impedance expressed on 3.3 KV side can be calculated using Eq.(8).
0
.
05445
2
SC S
S
V
Zs
(8) Assume ratio between reactive and resistive part of the source impedance equal to 30. Therefore the complex form of source impedance is given using Eq. (9).05445
.
0
001815
.
0
j
Zs
(9) HV/MV transformer impedance: The transformer has a rated power of 2.5 MVA , an inductive impedance of 5% and a resistive impedance of 0.4% .Therefore the transformer impedance can be calculated using Eq. (10)- (12).
0
.
017424
100
.
2 2Sn
Vs
R
Rcc T
(10)
0
.
2178
100
.
2 2Sn
Vs
X
Xcc T
(11)
042
.
85
2184
.
0
2178
.
0
017424
.
0
j
Z
T (12) MV line impedance: The resistance of the underground cable line is
0
.
120
/
km
and the reactance iskm
/
105
.
0
. The length of the line is500
m
. Therefore, the complex impedance of this500
m
line is given using Eq. (13).0
18
.
41
08801
.
0
05796
.
0
06624
.
0
j
Z
CL (13)Hence total impedance at PCC2 can be calculated using Eq. (14)-(15).
330
.
0
08548
.
0
2
Z
Z
Z
j
Z
PCC
S
T
CL
(14)
0
.
34109
75
.
47
2
PCC
Z
(15) WhereZ
S,Z
T andZ
CLare the source, transformer and cable impedances.Therefore short-circuit power available at PCC2 can be calculated using Eq. (16).
MVA
Z
Vs
S
PCC SPCC32
2 22
(16) Active and Reactive power variation (
P
and
Q
) as well as voltage change at PCC2 when all induction motorsoperate is taken from Matlab/PSB simulation is shown in Fig.3. All induction motors are operating at
0
.
8
lagging power factor and hence the voltage change which will be produced by the induction motors IM3 and IM4 at PCC2can be calculated using Eq. (17).
%
2
2 2
100
3
.
27
%
Vs
Q
X
P
R
Fig.3. Simulated results ofVoltage, Reactive and Active power Variations when four induction motors operates at its full capacity.
4.4 Estimation of the flicker severity using unity flicker severity curve method caused by induction motors IM3 and IM4
The repetition rate of the rectangular voltage changes for this induction motors are approximately 0.6 voltage changes / min (36 voltages/hour). Entering this value into flicker severity curve as shown in Fig.4, for rectangular steps produces on the ordinate the voltage change,
d
0
3
.
1
%
.d
o=3.
1
%
0.6
Fig. 4: Unity flicker curve for rectangular voltage variation for
P
ST= 1Taking into account that short term flicker severity is a linear parameter with respect to the magnitude of the voltage change, the expected PST2 caused by the contribution of IM3 and IM4 for the voltage change can be
calculated as given below. PST2
1
.
0548
0
d
d
(18) 4.5 PST caused by the simultaneous operation of all induction motors
In order to obtain the total severity at the point of PCC2, the individual contribution of each disturbing load
connected to this point (PST1 and PST2) together with the background flicker level
P
ST" must be considered.Therefore, the global flicker emission at PCC2 is calculated using PST2 obtained from the unity flicker severity curve
method is calculated using Eq. (19).
0 1 2 3 4 5 6 7 8 9 10
0 5x 10
6
t [sec]
P [
W
]
0 1 2 3 4 5 6 7 8 9 10
0 2
x 106
t [sec]
Q [
V
A
r]
0 1 2 3 4 5 6 7 8 9 10
3200 3400
t [sec]
V
[V
o
lts
PST
0
.
45
0
.
63153
1
.
0548
1
.
148
3 3 3 3
3 3
2 3
1 3
"
P
STP
STP
ST (19) This value exceeds the utility planning level (PST = 0.9) and hence induction motors IM3 and IM4 cannot beconnected to the network. Unless some mitigation measures are implemented, the new connection of induction motors IM3 and IM4 is not possible to voltage flicker problem.
.
5. ANALYSIS OF MITIGATION MEASURES
Two methods can be used for this purpose.
Method oriented to increase the short circuit power at the point of common coupling. In this short circuit power can be reinforced at the point of common coupling by building a new cable in parallel with existing line (Traditional Method).
Methods oriented to control the reactive power flow through the network .In this it is possible by installing the shunt capacitor bank and custom power devices like 1)Static VAR compensator(SVC) and
2) DSTATCOM connected at the at the point of common coupling
5.1 Statistical Analysis of method applied to increase the short circuit power at the point of common coupling
Mitigation method to reinforce the short-circuit power at the point of common coupling of induction motors (IM3 and IM4)by building a new line is somewhat costly but the technical analysis using simulated results presented
below shows the improvement achieved by this method.
If a new underground cable, identical to the existing one, is connected in parallel with it between PCC1 and
PCC2, the short –circuit power at PCC2 is increased. This arrangement is shown in Fig. 5. The equivalent impedance
of both parallel lines is calculated using Eq. (20).
0
.
03312
0
.
02898
2
'
Z
j
Z
LL (20)
Hence, the new total impedance at PCC2 can be calculated using Eq. (21).
'
0
.
05236
0
.
30123
'
2Z
Z
Z
j
Z
PCC S T L (21) The available short – circuit power at PCC2 can be calculated using Eq. (22).MVA
MVA
Z
Vs
S
PCC
SPCC
36
.
61
37
'
'
2 2
2
(22) The simulated result of voltage, reactive and active power variations when four induction motors operate at its full capacity is shown in Fig. 6. The PST obtained by this method is 1.148, which also exceeds the planning level.Hence this mitigation method is not found suitable, as short circuit power is increased by 15.6% and flicker level is decreased only by 22%. It is also costly and can be used only at the planning stage of the network.
Non-fluctuating
load
IM1 IM2 IM3 IM4
Induction motors already
in operation
Induction motors to be
connected 2 cables in parallel
length=500m Rc=0.20 ohm/km Xc=0.105 ohm/km
PCC2
PCC1
Fig.6: Simulated results of voltage, reactive and active power variations when four induction motors operates with two parallel cables.
5.2 Method used to improve the network reactive power level at the point of common coupling
5.2.1 Fixed Shunt capacitor banks
Another common way of controlling the voltage is by installing shunt capacitor banks. Capacitor bank of 850 kVAR can be connected in parallel with induction motor loads in order to compensate voltage variations and to improve power factor of the network. Corresponding arrangement is shown in Fig.7.
Non-fluctuating
load
IM1 IM2 IM3 IM4
Induction motors already in operation
Induction motors to be
connected
cable length=500m Rc=0.20ohm/km Xc=0.105ohm/km
PCC2
PCC1
capacitor is added to improve power
factor
Fig.7: Shunt capacitor bank connected at PCC2
The simulated result of Voltage, reactive and active power variations when four induction motors operates with a capacitor bank is shown in Fig.8. Capacitor bank is turned ‘ON ‘at five seconds after the motor start.
0 1 2 3 4 5 6 7 8 9 10
0 5x 10
6
t [sec]
P
[W
]
0 1 2 3 4 5 6 7 8 9 10
0 2
x 106
t [sec]
Q
[V
A
r]
0 1 2 3 4 5 6 7 8 9 10
3200 3400
t [sec]
V
[V
ol
ts
Fig.8. Simulated results of voltage, reactive and active power variations when four induction motors operates with capacitor bank.
By this mitigation method, the flicker level is reduced to 0.709, which is decreased by 38.38%. .Even though it is well below the planning level the drawbacks of this mitigation method are the appearance of resonance phenomena between the capacitor and inductive elements of the system and the possible over voltage transients due to the capacitor’s connection. From simulation results, it is also observed that capacitor response time is 250 milliseconds.
5.2.2 Concept of Custom Power Devices: As per the IEEE P 1409 custom power is defined as “the employment of power electronic or static controllers in distribution systems rated 1kV through 38kV for the purpose of supplying a level of reliability or power quality that is needed by electric power customers who are sensitive to power variations”. The concept of custom power devices was introduced by N.G.Hingorani in 1995 as an extension of the FACTS concept to distribution systems. The major object is to improve power quality and enhance reliability of power supply. The custom power devices that can be used in distribution system for power quality enhancements are solid state transfer switch(SSTS), solid state current limiter(SSCL),static synchronous compensator (STATCOM), dynamic voltage restorer(DVR), active filter(AF), static VAR compensator(SVC) and thyristor controlled voltage regulator(TCVR). The capability of SVC and DSTATCOM is assessed using Matlab/PSB as given below.
5.2.3 Static VAR compensation (SVC)
Static VAR compensators (SVC) have been used with success for the compensation of voltage flicker generated by loads. The control of the SVC is based on measuring the reactive component of the load current and deciding the firing angle in such a way that the SVC injects or absorbs the amount of reactive power required for compensation. The corresponding arrangement of SVC is shown in Fig.9.
Non-fluctuating
load
IM1 IM2 IM3 IM4
Induction motors already in operation
Induction motors to be
connected
cable length=500m Rc=0.20ohm/km Xc=0.105ohm/km
PCC2
PCC1
SVC is Added to reactive
power compensation
Fig.9: Static VAR Compensation at PCC2
0 1 2 3 4 5 6 7 8 9 10
0 5x 10
6
t [sec]
P [
W
]
0 1 2 3 4 5 6 7 8 9 10
0 2
x 106
t [sec]
Q [
V
A
r]
0 1 2 3 4 5 6 7 8 9 10
3200 3400
t [sec]
V
[V
o
lts
The simulated results of Voltage, reactive and active power variations when four induction motors operate with SVC bank is shown in Fig.10.
Fig.10: Simulated results of voltage, reactive and active power variations when four induction motors operates with SVC.
The static VAR compensator of 1. 7MVA is turned ‘ON ‘at five seconds after starting of an induction motor. From the result of this configuration it is observed that PST is reduced to 0.6216, and it is decreased by 45.85%,
which is well below the planning level. It is also observed that the response time of SVC is 177 milliseconds, which are less than compensation with the fixed capacitor bank. However, the SVC is switched only twice every cycle, and the device frequency response is inherently limited as well as SVC is incapable of injecting active power.
5.2.4 Distribution Static Synchronous Compensator (DSTATCOM)
The DSTATCOM is shunt connected, solid state switching power converter that exchanges reactive current with the distribution system. It uses three-phase inverters to transfer leading and lagging reactive current with the distribution system via coupling transformer. The DSTATCOM supplies reactive power by synthesizing its output for insertion into the AC power system through high frequency power electronic switching. The most common scheme used to switch on and off the semiconductors is a pulse-width-modulated (PWM) scheme to generate higher than fundamental frequency currents for injection into the distribution system. This injection of high frequency current allows the DSTATCOM to provide harmonic load current compensation. By regulating the output voltage of the inverter, the reactive power injected into or absorbed from the system can be controlled and as in the SVC, in such a way that the reactive current variations of the system load compensator are kept as small as possible, mitigating voltage fluctuations. Connecting the compensator to an energy storage device gives it an additional ability to regulate active power flow in the system.
The DSTATCOM can be installed at the distribution feeder or transmission feeder in the power system. However, the voltage boost of the point with which the DSTATCOM is connected, will be more notable when DSTATCOM is connected to distribution level. This is due to the influence of the inductance of the upstream transformer. Therefore, DSTATCOM for voltage flicker mitigation is usually used at the distribution level in the power system, so called DSTATCOM. An arrangement of DSTATCOM is shown in Fig.11.
0 1 2 3 4 5 6 7 8 9 10
0 5x 10
6
t [sec]
P [
W
]
0 1 2 3 4 5 6 7 8 9 10
0 2
x 106
t [sec]
Q
[V
A
r]
0 1 2 3 4 5 6 7 8 9 10
3200 3400
t [sec]
V
[V
o
lts
Non-fluctuating
load
IM1 IM2 IM3 IM4
Induction motors already in operation
Induction motors to be
connected
cable length=500m Rc=0.20ohm/km Xc=0.105ohm/km
PCC2
PCC1
DSTATCOM
Fig.11: Reactive power Compensation using DSTATCOM
The DSTATCOM with DC capacitor can inject reactive power at the point of common coupling. The detailed results from simulations about voltage, reactive and active power Variations when four induction motor operates with DSTATCOM is shown in Fig.12.
Fig.12: Simulated results of voltage, reactive and active power variations when four induction motors operates with DSTATCOM.
It has been observed that DSTATCOM of ±1.7 MVA is turned ‘ON ‘at five seconds after the induction motor start. From this it is observed that PST is reduced to 0.618 and is decreased by 46.16%, which is well below the
planning level. It is also observed that the response time is 128 milliseconds, which are less than fixed capacitor bank and SVC voltage flicker compensation methods. The comparison of different mitigation measures for flicker compensation is shown in Table 3.
Table 3. Comparison of different mitigation measures for flicker compensation
Configuration P (kW)
Q (kVAR)
V (Volts)
Response Time
PST %PST
reduction Induction motor IM1-IM4
+2 cable parallel
2019 1544 3206 Nil 1.123 2.18%
Induction motor IM1-IM4 +Capacitor bank(850 kVAR)
2019 737 3188 250 msec 0.709 38.24%
Induction motor IM1-IM4 +SVC(0-1.7MVA)
2019 64 3211 177 msec 0.6216 45.85%
Induction motor IM1-IM4+DSTATCOM
2028 58 3211 128msec 0.6180 46.16%
0 1 2 3 4 5 6 7 8 9 10
0 5x 10
6
t [sec]
P
[W
]
0 1 2 3 4 5 6 7 8 9 10
0 2
x 106
t [sec]
Q
[V
A
r]
0 1 2 3 4 5 6 7 8 9 10
3200 3400
t [sec]
V
[V
o
lt
s
6. IMPACT OF CHANGE IN LINE X/R RATIO ON VOLTAGE FLICKER COMPENSATION.
The ability of a reactive power compensator to compensate a flicker load is influenced by the line impedance. As induction motors draw a substantial amount of active power, the more resistive line and associated loads, the reactive power compensation provided by custom power devices may not be effective. A more mathematical approach which verifies the above statement is given in Appendix- A. It is also verified using matlab/PSB simulation. In this simulation, the magnitude of the line impedance was kept constant at 0.34109Ω. By changing the angle of line impedance, different ratios of line reactance to resistance (X/R) are obtained. Simulating each of these scenarios and calculating the voltage flicker before and after compensation by SVC and DSTATCOM is shown in Table 4.
Table 4. Impact of change in line impedance X/R on voltage flicker compensation
X/R Ratio
PST
(Uncompensated)
PST
(Compensated with SVC)
% Compensation
with SVC
PST(Compensated
with DSTATCOM)
% Compensation
with DSTSTCOM
0.5 1.12 0.9216 17.71 1.53 36.60
1 1.13 0.8436 25.34 0.7023 37.84
1.5 1.53 0.746 51.24 0.6915 54.80
2 1.37 0.7196 47.47 0.6520 52.40
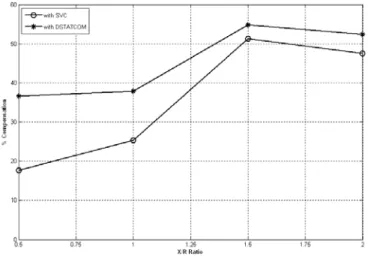
The comparative plots of both custom power compensators are shown in Fig.13.
Fig. 13: Percentage compensation provided by SVC and DSTATCOM due to change in line impedance X/R ratio.
cause voltage flicker. With reference to Appendix-A, active power flowing through a resistive line impedance will cause a larger voltage drop than active power flowing through a reactive line impedance. Thus a load drawing both active and reactive current cause maximum voltage drop over the line impedance at a specific ratio result in maximum flicker condition. In spite of the uncompensated flicker increasing with X/R ratio, improvement is seen in the compensated flicker level and percentage compensation achieved using custom power devices. This support the theoretical analysis explained in the Appendix-A by showing a reactive power compensator are much better at compensating a system fed by a reactive line than by a resistive line. From the plot in Fig.13, it is observed that when X/R=1.5, maximum reactive compensation achieved by SVC is 51.24 % and by DSTATCOM is 54.80%. 7. CONCLUSION
In this paper, we have proposed a statistical method suggested by IEC applied for calculating the short time voltage flicker level which helps in pre-connection studies of induction motors. It also suggests different custom power devices for reducing the short time voltage flicker level. It has been observed that the distribution static synchronous compensator (DSTATCOM), which is essentially a controlled ac voltage source, is found effective. Using DSTATCOM short time flicker level is reduced to 0.618, indicating the reduction of flicker by 46.16%.It’s response time is also 128 milliseconds, which is faster than all other mitigation methods suggested. The voltage profile maintained by a DSTATCOM at the point of common coupling is better than other reactive power compensation methods. It is found that when X/R =1.5, maximum reactive compensation achieved by DSTATCOM is 54.80%.
Acknowledgements
The author would like to thanks to the Director/ Principal and Prof. Ganesh Jadhav of Dnyanganga College of Engineering and Research, Pune for providing support and encouragements for completing this paper.
APPENDIX A.
Impact of line R/X ratio on Reactive power Compensation
The effect of change in line impedance nature on reactive power compensation can explained with reference to Fig.2.
Case1: If the cable line is inductive, hence
line line
jX
Z
A.1 Then the amplitude of the voltage at the PCC2 without compensation can be calculated asLine Load
Load S
XLine pcc
jX
R
R
V
V
2 A.2 Where
V
S is the source voltage,V
pcc2Xline is the voltage at PCC2 when line is inductive,R
loadis the load resistance and
X
load is the load reactance.Case2: If the cable line is resistive, hence
Line Line
R
Z
A.3 Then the magnitude of voltage at PCC2 isLine Load
Load S
RLine pcc
R
R
R
V
V
2 A.4 Where
V
pcc2Rline is the voltage at PCC2 when line is resistive.RLine pcc XLine
pcc
V
V
2
2 A.5 Hence voltage flicker compensation is more effective if cable line X/R ratio is more (reactive nature) and vice versa.References
[1] M. Bollen, I. Y. H. Gu. P. (2006), Signal Processing of Power Quality Disturbance,. New York: IEEE Press, John Wiley & Sons. [2] Angelo Baggini. P. (2008), Handbook on Power Quality, John Wiley & Sons.
[3] R. C. Dugan, M. F. Mc Granaghan, and H. W. Beaty. P. (1996), Electrical Power System Quality, New York: McGraw-Hill. [4] J. A. Arrillaga, N. R. Watson, and S. Chen. P. (2000), Power System Quality Assessment, New York: John Wiley & Sons. [5] M.M. Morcos, J.C. Gomez, Flicker sources and mitigation, IEEE Power Engineering Review, November 2002.
[6] J.Jatskevich, O. Wasynczuk,L. Conrad, A method of evaluating flicker and flicker reduction strategies in power systems, IEEE Trans. on Power Delivery, vol. 13, no. 4, pp.1481-1487, Oct. 1998.
[7] Mahmoud Mazadi, Seyed Hossein H., Eilliam Rosehart, David T. Westwick, Instantaneous voltage estimation for assessment and monitoring of flicker indices in power systems, IEEE Trans. on Power Delivery, vol. 22, no. 3, pp.1841-1846, July 2007.
[8] Weihao Hu,Zhe Chen,Yue Wang, Flicker mitigation by active power control of variable speed wind turbine with full scale back to back power converters, IEEE Trans. Energy Convers., vol. 24, no. 2, pp. 640-649, Sept. 2009.
[9] Garcia-Cerrada A. Garcia-Gonzalez P.,Collantes R., Gomez T., Anzola J, Comparison of thyristor-controlled reactors and voltage-source inverters for compensation of flicker caused by arc furnaces, IEEE Transactions on Power Delivery, vol. 15, no. 4, pp. 1225–1231, 2000. [10] Z. Zhang, N. Fahmi and W. Norris. Flicker Analysis and Methods for Electric Arc Furnace Flicker Mitigation (A Survey) 2001, IEEE
Porto Power Tech Conference, Porto, Portugal, Sept. 2001.
[11] IEC 61000-3-7), Electromagnetic compatibility (EMC)-Part-3: Limits-Section 7: Assessment of Emission Limits for fluctuation Loads in MV and HV Power Systems,(1996-11)
[12] UIE, Flicker Measurement and Evaluation, Technical Report, Second Edition, 1991.
[13] IEC 61000-3-3, Electromagnetic compatibility (EMC)-Part-3-3: Limitation of voltage changes, voltage fluctuations and flicker in public low-voltage supply systems, for equipment with rated current less than 16 A per phase and not subject to conditional connection, (1994-12). [14] IEC 61000-4-15, Amendment 1 - Electromagnetic compatibility (EMC), Part 4: Testing and measurement techniques-Section 15: Flicker
meter functional and design specifications, (2003-01). [15] UIE, Connection of Fluctuating Loads, Technical Report, 1988.
[16] IEEE, Standard Dictionary of Electrical and Electronics Terms, Std.100, IEEE, 1984.
[17] Walid G., Morsi, M. E. El-Hawary, On the appropriate monitoring period for voltage flicker measurements in the presence of distributed generation, Electric power system research, vol .79, pp-557-561, 2009.
Biography of authors:
* S.A.Deokar has completed his graduation in Electrical Engineering from Shivaji University, Kolhapur in 1992 and post graduate from Pune University in 2006. He is pursuing his Ph.D from S.G.G.S. College of Engineering and Technology, Nanded since July, 2007. He is presently working as a Vice Principal and H.O.D.in Electrical Engineering at Dnyanganga College of Engineering and Research in Pune University. He is also BEE Certified Energy auditor. He has 10 international conference research papers on his credit. His area of interest is power Quality,Renewable energy,Energy Audit and Energy Conservation.