Article
ISSN 0102-695X
http://dx.doi.org/10.1590/S0102-695X2011005000127 Received 14 Apr 2011 Accepted 4 Jun 2011 Available online 24 Jul 2011
metal oxide sensor array electronic nose
Shuguang Chen,
1,2Jian Mao,
1Bangxing Han,
*,3,4Naifu Chen
41School of Food Science and Technology, Jiangnan University, Popular Republic of
China,
2Department of General Surgery, Peking Union Medical College Hospital, Popular
Republic of China,
3School of Pharm, Jiangsu University, Zhenjiang 21 as y2013, Jiangsu, Popular
Republic of, China,
4Research Center of Plant Cell Engineering of Anhui Province, Popular Republic of
China.
Abstract: The scent fingerprint of Rosa laevigata Michx., Rosaceae, samples harvested at different periods was investigated. Principal component analysis (PCA) and discriminant factor analysis (DFA) were done on the scent response values measured by an electronic nose (EN) sensor. Statistical quality control (SQC) analysis was also conducted. The R. laevigata samples were clustered into two categories after being analyzed by PCA and DFA. One cluster consisted of samples No. 1 to No. 6, and the other consisted of samples No. 7 to No. 10. The combination of EN, PCA, and DFA for scent analysis can be used for the quality control of traditional Chinese medicines.
Keywords: harvest
Rosa laevigata
quality scent
Introduction
Rosa laevigata Michx. is a member of the Rosaceae family. Its fruits are commonly used as traditional Chinese medicine (TCM). It is used as a kidney tonic to reduce urination; it is also used for cleansing the intestines and for arresting leucorrhea. According to the Chinese Pharmacopoeia, R. laevigata
fruit can be harvested when it is ripe and red (The Pharmacopoeia Comittee of People’s Republic of China, 2010). Some references ascribe its anti-uretic and astringent properties to its acerbity; when it is ripe and red, it tastes sweet and loses its medicinal value. It should therefore be harvested when it is partly yellow but not yet ripe (Shen, 2003). There are two harvest periods for R. laevigata: the first is when it is ripe, and the second is when it is partly yellow but not yet ripe.
Secondary metabolites, which are highly dynamic in different periods of growth of a medicinal plant, directly influence its medicinal effect (Stitt & Fernie, 2003). Hence, the seasonal changes in secondary metabolites of R. laevigata should be fully studied to reasonably harvest. In spite of some well documents concern about chemical compounds of R. laevigata,
such as Laevigatins E, F, G, 2α-methoxyursolic acid, 11α-hydroxytormentic acid, loliolide,
6,7-diethoxycoumarin, diethylmalate et al has been reported
(Yoshida et al., 1989; Fang et al., 1991a; 1991b; Yuan et al., 2008), and some studies on the dynamic changes in its non-volatile components (such as flavones and polysaccharides) have been done (Zhou et al., 2005; Han et al., 2008; He et al., 2009; Liu et al., 2011). However, there is no paper about its volatile components. The present work used an electronic nose (EN) to detect the dynamic changes in its volatile components as it was harvested at different periods. Principal component analysis (PCA) and discriminant factor analysis (DFA) were adopted to cluster the R. laevigata samples and provide a reference for the systematic harvesting of R. laevigata and the promise of drug effect.
Materials and Methods
Rosa laevigata samples
Determination of the EN response resistance
An αFOX 4000 sensor array system and
eighteen metal oxide sensors (Alpha M.O.S.) were used to determine the dynamic scent changes in the R. laevigata samples. The amount of sample used was 1 g. Detection conditions were: dry air carrier gas at 150
mL•min-1; 55 °C headspace temperature; 300 s residence
time; 120 rpm stirring speed; 1000 µL injection volume; 120 s acquisition time; 600 s lag time. The detection of each sample was repeated five times.
Statistical analysis
The data were analyzed by PCA, DFA and
SQC analysis using the αSOFTV9.1 software.
Results
Results of the sensor signals of R. laevigata samples
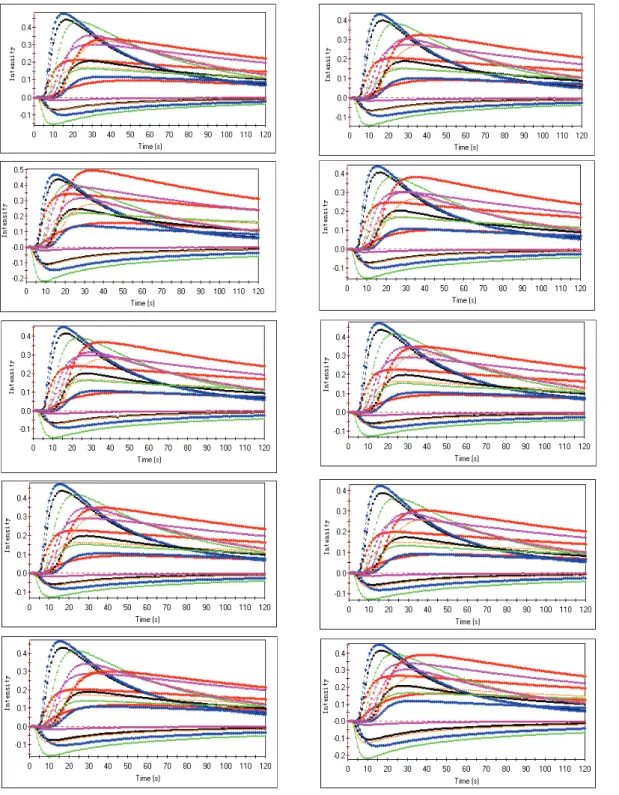
Figure 1 shows the sensor signals produced by R. laevigata samples. The response intensity on the ordinate axis corresponds to the rate of change of the relative resistance of the different sensors [(R0-R)/ R0], where R0 is the resistance value at t=0, and R is the resistance value with the changes in time. Figure 1 shows that the sensors detected a small difference in the scent R. laevigata samples; only a few sensor signals differ.
The fingerprint map of the EN sensor signals were analyzed to understand better the response of the 18 metal-oxide sensors of the EN toward the scent of R. laevigata at different harvest periods. The fingerprint map was prepared by evenly placing the 18 sensors at 20-degree intervals along the circumference of a circle. The maximum response value for each sensor was recorded and marked. There are small differences in the samples harvested at different periods, and some small differences were detected by the T30, P30 and PA-type sensors (Figure 2).
PCA
Figure 2. Scent fingerprint map of Rosa laevigata samples.
A credible conclusion could not be drawn due to the a large amount of information in the original signal map and the small difference between the signals of the samples. Therefore, stoichiometry data processing was
adopted to analyze intuitively and scientiically the results.
PCA is a type of multivariate statistical method, which data-converses and dimensionality-reduces the extracted
multi-index information of sensors. It linearly classiies
the characteristic vector after dimensionality reduction and displays the major two-dimensional map on a PCA analysis map. In the case of the absence or lack of sample information, PCA can quickly scan all data to determine the
associated features of the samples and make a conclusion based on the available information (Hansen et al., 2005; Pereira et al., 2006; Park et al., 2010].
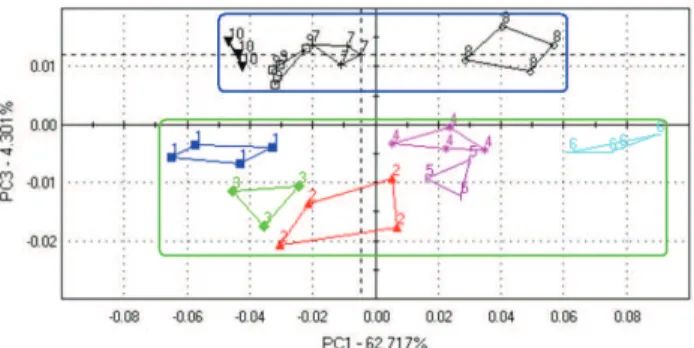
PC1 and PC3 are taken as the coordinate axes to conduct a PCA analysis on the samples. Figure 3 shows that the response data points are close to the coordinate axis, and are clustered about 0.1. The response values of the sample data points collected before October 27, 2009 (sample No. 6) are negative in PC3, while the response values after the harvest period are positive. This implies that samples No. 1 to No. 6 may be clustered as one category, while samples No. 7 to No. 10 may be clustered as another category (Figure 3).
Figure 3.The PCA map of 10 samples of Rosa laevigata.
DFA
DFA is a classiication technique that optimizes
the distinguishability by recombining sensor data (Rosselli et al., 2005). With mathematical manipulation, it minimizes the differences between data of the same type and broadens the disparities between data from different categories to establish a data recognition model. Figure 4 shows that EN was able to distinguish between the R. laevigata
samples harvested at different periods. Samples No. 1 to No. 6 evidently cluster together as one category, and the differences between their signals are small; samples No. 7 to No. 10 belong to one category, but the differences between them are larger.
SQC analysis
The SQC analysis is based on the sample diversity, and is performed by acquiring an acceptance region and a rejection region by calculating data from a reference
sample. Unknown samples are mapped in the igure, from
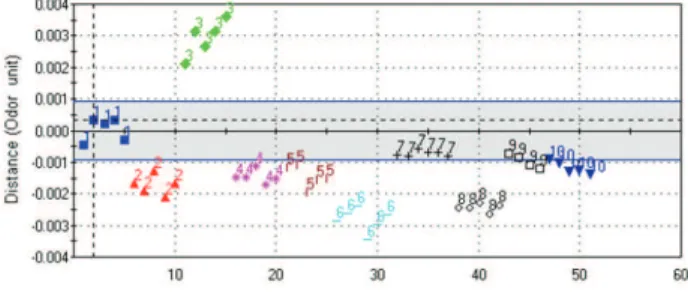
which a conclusion (acceptance or rejection) may be made (Bleibaum et al., 2002; Munoz, 2002). A single olfactory value can be achieved by computing the sample mean and standard deviation. For every data point, the distance in scent units demonstrates the difference in scent.
SQC analysis was carried out by taking sample No. 1 as the reference. Small differences between the samples were detected by the EN; this dillustrates the high sensitivity of the EN (Figure 5).
Figure 5. SQC analysis of ten samples of Rosa laevigata.
Discussion
The scent of a TCM is the major basis of judging its quality. Scent analysis a TCM with modern technologies such as gas chromatography (GC) and gas chromatography-mass spectrometry (MS). GC-MS in itself yields information on the concentration of volatiles present in a sample, but little is known about the relationship between these volatiles in a mixture and how they contribute to perceived sensory attributes (Hansen et al., 2005). Moreover, GC and GC-MS are still expensive and require trained personnel, EN instruments impress by virtue of simple or no sample work-up, automated measurement capability and easy, but mostly black box, pattern recognition and interpretation software (Alexandros et al., 2002; Hans et al., 2008; Han et al., 2009].
The EN is designed with electrochemical sensor arrays and proper identification equipment. It differs from GC, GC-MS, and other analytical methods in that it obtains not the qualitative and quantitative results of the individual components of the samples, but rather the overall information of the volatile components in the samples, that is, the fingerprint data. The EN can compare and analyze the scent information of different samples as well as establish an information database using standard samples, by adopting stoichiometry to qualify and quantitatively analyze unknown samples (Gardner & Bartlett, 1994). Currently, the EN has been
extensively applied in food analysis (Dutta et al., 2003; Thi et al., 2004; Gan et al., 2005; Wolfrum et al., 2006), environmental quality monitoring (Zhang et al., 2003), scent pattern analysis (Been, 2010), disease diagnosis (Di et al., 2003), and in other fields. This study used the EN to detect the changes in the volatile components of
R. laevigata samples harvested at different periods to provide a reference for quantifiable scent indicators for
R. laevigata.
Research results by Han show that the flavone content of R. laevigata harvested at different periods tends to increase initially and then decrease, and generally reaches its highest content in late September and early October (Han et al., 2008). The polysaccharide content also initially increases and then decreases, and is highest in November and December (Zhou et al., 2005). Flavone and polysaccharide content are used as standards. There are apparently two reasonable periods for harvesting R. laevigata, which is consistent with documentary records. The results of the present study show that the R. laevigata samples harvested from different periods are clustered according to their amount of volatile components. As they were harvested during the last third of October, the R. laevigata samples are divided into two categories. It is common knowledge that the same plant can have different medicinal materials if harvested at different times, as in the case of the ripe and unripe Forsythis suspense (Li & Li., 2006), and in Pericarpium citri reticulatae viriole and
Pericarpium citri reticulatae (Zhou et al., 2009) Further pharmacological studies are required to confirm the practicality of having two different harvesting periods for R. laevigata.
Acknowledgements
This study was supported by the Natural Science Foundation of China (No. 30901972), key science foundation for the excellent youth scholars of high education of Anhui Province of China (Grant No. 2010SQRL182ZD).
References
Alexandros KP, Naresh M, Cliodna M, Jeff MJ, Dorothy S, Jonathon B, Anthony PFT 2002. Use of an electronic nose system for diagnoses of urinary tract infections.
Biosens Bioelectron 17: 893-899
Been CG 2010. Breeding of fragrant yellow phalaenopsis and scent pattern analysis by GC/SAW electronic nose system. Korean J of Hortic Sci & Tech 28: 656-663. Bleibaum RN, Stone H, Tan T, Labreche S, Saint-Martin E, Isz S
2002. Comparison of sensory and consumer results with electronic nose and tongue sensors for apple juices. Food Qual Prefer 13: 409-422.
Pereira G, EHilbert G, Gaudillere JP, Soyer JP, Leeuwen C. Laviale O, Moing A, Deborde C, Maucourt M, Rolin D
2006. 1H NMR metabolite ingerprints of grape berry:
Comparison of vintage and soil effects in Bordeaux grapevine growing areas. Anal Chim Acta 563: 346-352 Rosselli FP, Albuquerque CN, Silva ABF 2005. Quantum
chemical and statistical study of Megazol-derived compounds with trypanocidal activity. Int J Quantum Chem 103: 738-748.
Shen K 2003. Mengxibitan. Changchun: Jilin Photography Press, p. 180.
Stitt M, Fernie AR 2003. From measurements of metabolites to
metabolomics: an‘on the ly’perspective illustrated by
recent studies of carbon nitrogen inter actions. Curr Opin Biotechnol 14: 136-144.
The Pharmacopoeia Comittee of People’s Republic of China 2010. Chinese Pharmacopoeia. Beijing: Chemical Industry, p. 153 .
Thi UT, Keitaro S, Hiroshi O, Seiichi H, Kenichi O 2004. Analysis of the tastes of brown rice and milled rice with different milling yields using a taste sensing system. Food Chem 88: 557-566.
Wolfrum E, Meglen R, Peterson D, Sluiter J 2006. Metal oxide sensor arrays for the detection, differentiation, and
quantiication of volatile organic compounds at
sub-parts-per-million concentration levels. Sensor Actuat B: Chem 115: 322-329.
Yoshida T, Tanaka K, Chang XM, Okuda T 1989. Dimeric ellagitannins, Laevigatins E, F and G, from Rosa Laevigata. Phytochemistry 28: 2451-2454.
Yuan JQ, Yang XZ, Miao JH, Tang CP, Ke CQ, Zhang JB, Ma XJ, Ye Y 2008. New triterpene glucosides from the roots of
Rosa laevigata Michx. Molecules 13: 2229-2237. Zhang LY, Wen LJ, Zhou F, Zhang S, Yang PY 2003. Electronic
nose for the determination of formaldehyde in Air. Chem J Chinese U 24: 1381-1384.
Zhou Rb, Cheng SH, Cheng XP, Gao J, He YX, Tong XZ, Liu XJ 2005. Studies on the trends changes of the content of polusaccharide in fructus Rosae Laevigatae. Res Inf Tradit Chin Med 7: 16-18.
Zhou X, Huang QH, Mo YY, Liao SM 2009. Analysis on the volatile oil of Xinhui Pericarpium citri reticulatae in different years by GC/MS. J Chin Med Mat 32: 24-26.
*Correspondence
Bangxing Han
School of Food Science and Technology, Jiangnan University 1800 Lihu Avenue, Wuxi, jiangsu 214122, P.R. China [email protected]
G, Roscioni C, Finazzi-Agrò A, D'Amico A 2003.
Lung cancer identiication by the analysis of breath by
means of an array of nonselective gas sensors. Biosens Bioelectron 18: 1209-1218.
Dutta R, Hines EL, Gardner JW, Kashwan KR, Bhuyan M 2003. Tea quality prediction using a tinoxide-based electronic
nose: an artiicial intelligence approach. Sensor Actuat B-Chem 94: 228-237.
Fang JM, Wang KC, Cheng YS 1991a. Steroids and triterpenoids from Rosa laevigata. Phytochemistry 30: 3383-3387. Fang JM, Wang KC, Cheng YS 1991b. The chemical constituents
from the aerial part of Rosa laevigata. J Chin Chem Soc 38: 297-299.
Gan HL, Tan CP, Che Man YB, NorAini I, Nazimah SAH 2005. Monitoring the storage stability of RBD palm olein using the electronic nose. Food Chem 89: 271-282.
Gardner JW, Bartlett PN 1994. A brief history of electronic nose.
Sensor Actuat B-Chem 18: 211-220.
Han BX Chen NF Yao Y 2009. Discrimination of Radix Pseudostellariae according to geographical origin by T-NIR spectroscopy and supervised pattern recognition.
Phcog Mag 5: 279-286.
Han BX, Chen NF, Zhang L, Wang Y, Xie S 2008. Preliminary studies on quality standand of Rosa leavigata Michx.
Chin Arch Tradit Chin Med 26: 1507-1509.
Hans R, Fritz S, Otmar Z 2008. Citrus juice classiication by
SPME-GC-MS and electronic nose measurements. Food Sci Technol 41: 1906-1912
Hansen T, Petersen MA, Byrne DV 2005. Byrne Sensory based
quality control utilising an lectronic nose and GC-MS analyses to predict end-product quality from raw materials. Meat Sci 69: 621-634
He RR, Yao XS, Yao N, Wang M, Dai Y, Gao H, Yu Y, Kurihara H 2009. Protective effects of radix Rosa laevigata against Propionibacterium acnes and lipopolysaccharide-induced liver injury. Biosci Biotech Bioch 73: 1129-1136. Li WJ, Li XE 2006. Regulation of dry substance and active
components accumulation in fruit of Forsythia suspensa. Chin Tradit Herb Drugs 37: 921-924.
Liu YT, Lu, BN, Peng, JY 2011. Hepatoprotective activity of the
total lavonoids from Rosa laevigata Michx. fruit in mice treated by paracetamol. Food Chem 125: 719-725. Munoz AM 2002. Sensory evaluation in quality control:
anoverview, new developments and future opportunities.
Food Qual Prefer 13: 329-339.
Park MK, Cho IH, Lee S, Choi HK, Kwon DY, Kim YS
2010. Metabolite proiling of Cheonggukjang, a