Engenhari a Agrícola
ISSN: 1809-4430 (on-line) www.engenhariaagricola.org.br
2 Universidade Federal de Uberlândia/ Uberlândia - MG, Brasil. 3 Universidade Estadual Paulista/ Botucatu - SP, Brasil.
Received in: 6-26-2017
Doi:http://dx.doi.org/10.1590/1809-4430-Eng.Agric.v38n2p 232-237/2018
SPECTRUM AND VELOCITY OF DROPLETS OF SPRAY NOZZLES WITH AND WITHOUT
AIR INDUCTION
Jorge A. L. França
1*, João P. A. R. da Cunha
2, Ulisses R. Antuniassi
31*Corresponding author. Universidade Federal de Uberlândia/ Uberlândia - MG, Brasil. E-mail: jorge.10.franca@g mail.co m
KEYWORDS
spray drift
, droplet
size, application
technology of
pesticides.
ABSTRACT
The aim of this study was to evaluate the spectrum and the velocity of droplets produced
by nozzles with and without air induction, under different pressures and flow rates. The
experiment was conducted in a completely randomized design with five replications, in a
factorial 2 x 3 x 3 (two spray nozzles, three flow rates and three operating pressures). The
spray nozzles with and without air induction of the Hypro manufacturer (GA and VP)
were evaluated, with nominal flow rates of 0.76; 1.14 and 1.51 L min
-1and pressures of
200, 300 and 400 kPa. The spectrum and velocity of the droplets were determined
directly, using a Visisize Portable P15 (Oxford Lasers, Imaging Division). The pressure
increases further reduction of the VMD and the relative amplitude, and increases the
droplet velocity. The droplets generated by the spray nozzles with air induction showed
on average amplitude 1.54 times higher than the droplets generated by spray nozzles
without air induction. The droplet velocity showed little variation between the nozzles
with and without air induction with the same pressure and flow rate, however, spray
nozzles with larger flow rates and pressures produced droplets with higher velocities.
INTRODUCTION
The use of air induction nozzles is a commonly used method as a drift reduction strategy in the application of crop protection products. Several studies using these nozzles types indicate reduction of drift percentage in relation to nozzles without air induction (Bueno et al., 2013; Silva et al., 2014a; Silva et al., 2016). The mechanis m at these nozzles follo ws the operating principle of a Venturi tube. These stand out from the other spray nozzle types because the flow rate of liquid and air are mixed inside a chamber, when passing under high pressure by the nozzle and coming into contact with the atmosphere, it forms droplets with air bubbles inside (Mota & Antuniassi, 2013; Leite & Serra, 2013; Silva et al., 2014b).
These nozzles with air induction reduce the drift problem because they generally produce droplets larger than the droplets usually produced by similar nozzles without induction, and many of these droplets contain one or more air bubbles (Matthews, 2000). Chechetto et al. (2013), in an experiment evaluating the influence of spray nozzles and adjuvants on the potential of wind drift reduction, found that the lowest values of drift percentage
were obtained with the nozzles with air induction in all treatments, in co mparison with pre-orifice nozzles.
However, air bubbles inside the droplet interfere with its transport and deposition pattern. Faggion (2008) stated that the velocity of the droplets is lower for the air induction nozzles than the conventional ones. The velocity increases with the decrease of the air captured percentage. According to the author, this result is expected because the presence of air inside the droplets increases their diameter and decreases their density; consequently the velocity of displacement reduces by the resistance force to the passage offered by the air.
does not increase the drift risk, since there is a predominance of the drop velocity effect.
Therefore, the movement mechanis m of a droplet after its launch by the nozzles is complex, confirming the necessity of more accurate studies, since this information can be useful for the understanding of the spray penetration in the plant canopy and of the drift risk.
Most of the equipment fo r evaluating droplet size in real time is based on the laser diffraction technique; however, this technique may present accuracy problems when used with liquids of different physicochemical composition (Murphy et al, 2004). In addition, many are unable to measure the droplets velocity. So, a great deal of interest has arisen in the equipment of image analysis, which do not present the problems mentioned for the laser beam d iffraction equip ment (Kashdan et al., 2007).
Wang et al. (2015), studying the performance of spray nozzles by image analysis, stated that the relation between droplet size and velocity still needs more scientific studies for their understanding. Sayinci (2015) also showed that this relation is unclear and attribute this to high velocity variation for droplets of the same size in a spray jet.
Thus, the aim of this study was to evaluate the spectrum and the velocity of droplets produced by nozzles with and without air induction of the same manufacturer submitted to different operating pressures and flow rates.
MATERIAL AND MET HODS
The experiment was carried out at the Machinery and Agricultural and Forestry Tires Test Center (NEMPA) at the Lageado Experimental Farm of the School of Agronomy - FCA/UNESP, in Botucatu – SP, Brazil.
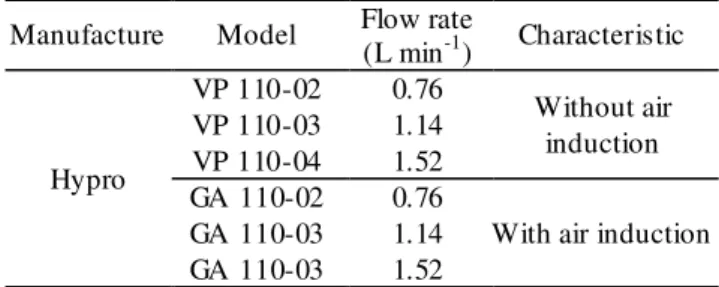
The spectrum and the velocity of droplets generated by different spray nozzles with and without air induction were evaluated under different operating conditions. The spray nozzles used in the experiment are described in Table 1.
TABLE 1. Spray nozzles used in the tests.
Manufacture Model Flow rate
(L min-1) Characteristic
Hypro
VP 110-02 0.76
Without air induction VP 110-03 1.14
VP 110-04 1.52 GA 110-02 0.76
With air induction GA 110-03 1.14
GA 110-03 1.52
The experiment was conducted in a completely randomized design, with five replications, in the 2 x 3 x 3 factorial scheme (two spray nozzle models, three flo w rates and three operating pressures). Each replicate consisted of one spray nozzle where five equal spray nozzles were used to mount the five replicates. Spray nozzles with and without air induction were evaluated, with nominal flow rates of 0.76; 1.14 and 1.51 L min-1 and at pressures of 200, 300 and 400 kPa.
In order to reduce the surface tension of the spray to levels closer to those used in the field, Agral’s adjuvant fro m Syngenta was added, characterized as adhesive spreader of the Nonil Feno xi Poli Ethanol chemical group. The surface tension of the water at 25°C was 72 mN m-1, and after the adjuvant addition at the concentration of
0.05% v v-1, it was reduced to 32 mN m-1. All tests were performed with the same spray type.
The spraying was evaluated by taking into account the spectrum and velocity of droplets produced by the nozzles under different operating conditions. The following parameters were obtained: Dv0.5 (droplet diameter such that 50% of the volume of the sprayed liquid consists of droplets of size smaller than this value, also known as volume median d iameter- VM D), droplet velocity and relative amp litude (RA).
The determinations were performed directly, using a real-time droplet analy zer based on high resolution image analysis. The VisiSize Portable P15 image particle analyzer was used (Oxford Lasers, Imaging Division, Oxford, U.K.). For this method, the characterization is carried out in real time by Visisize Particle Sizing software, developed by the same equip ment manufacturer. The system analyzes the droplet spectrum using a technique called Particle/Droplet Image Analysis (PDIA) (Carvalho et al., 2017). The system is capable of
measuring droplets with diameter above 5 μm. In addition
to measuring the particle diameter d istribution, the equipment provides the velocity of the particles in real time. To provide the average of the spray parameters, the system was programmed to count ten thousand droplets in each repetition.
Prior to the performance of each test, in the VisiSize Portable P15 image particle analy zer, a calibration was performed using a spray nozzle fro m the TeeJet, XR8003 model and a spray containing only water, which produces droplets with VMD around 150 μm.
In the determination of the droplet spectrum, a spray equipment was assembled so that all the sprayed jet passed transversely through the light beam of the analyzer, allo wing the direct average droplet spectrum to be obtained directly for each desired condition. The spray nozzle was located 50 cm above the optical beam (ASAE, 2000).
The tests were carried out in a controlled environment in order to minimize the effect of environmental conditions (air temperature below 28°C, relative air humid ity above 60% and absence of winds).
All data were first submitted to the residues normality tests of the Shapiro-Wilk and Kolmogorov-Smirnov and the variances homogeneity of Levene, both at 0.01 o f significance, with the SPSS 20 program (SPSS, 2013). In cases where the assumptions were not met, the
data were transformed into √x and submitted to the new
analysis. Only when the transformation corrected at least one of the assumptions, without harming the others, the transformed data were used for analysis of variance. Otherwise, the original data were used.
In all experiments, after the analysis of the assumptions, the data were submitted to analysis of variance by the SISVAR 5.3 statistical program (Ferreira, 2008). When relevant, the treatments were compared by Tukey test, at 0.05 significance.
RES ULTS AND DISCUSS ION
TABLE 2. Su mmary of the variance analysis table of the data related to the volume median diameter (VM D), relative amp litude (RA) and droplet velocity, resulting fro m application with spray nozzles with and without air induction, with different flo w rates and operating pressures.
Calculated F value
Source of variation VM D RA Velocity
Nozzle 3811.202** 3562.219** 0.000ns
Flow rate 170.030** 39.007** 186.624** Pressure 703.680** 382.762** 48.472** Nozzle x Flo w rate 91.242** 39.996** 5.843**
Nozzle x Pressure 333.119** 75.754** 0.883ns Flow rate x Pressure 63.253** 36.938** 2.747* Nozzle x Flo w rate x Pressure 39.494** 15.506** 0.613ns
C.V. (%) 3.69 3.40 7.88
C.V.: Coefficient of variation; * significant at 0.05; ** significant at 0.01, ns not significant at 0.05.
The spray nozzles with air induction produced droplets with higher VMD than the spray nozzles without air induction (Table 3), at all operating pressures and nominal flow rates, which are less prone to drift losses. The existence of the Venturi system attached to the pre-orifice leads to the increase of the droplets size in function of the air mixture to the droplets. This behavior is already known (Mcginty et al., 2016); however, the magnitude of the increase in the droplet size due to the different geometries of construction is not known.
The nozzles without air induction provided lower RA values than the nozzles with air induction at all operating pressures and rated flow rates. This result may
have been due to the fact that the mixtu re of air and liquid inside the nozzle with air induction chamber causes to each droplet to have a different amount of air inside it, corroborating for greater variation in its diameter. The higher the RA is, the greater will be the variation of spray droplet sizes, and a ho mogeneous droplet spectrum has RA value tending to zero. The higher the relative amplitude value is the larger will be the droplet size range (Cunha et al., 2016). The spray nozzles with air induction, although they produced droplets of larger diameters, presented a greater variation of diameter than the droplets generated by the nozzles without air induction.
TABLE 3. Vo lu me median diameter (VMD) and relative amplitude (RA) resulting fro m the application of spray nozzles with (GA) and without (VP) air induction, with different flo w rates and operating pressures.
VMD (µ m) Nozzle
Flow rate (L min-1) Pressure (kPa) VP GA
0.76
200 153.74 b 277.86 a 300 142.46 b 228.74 a 400 134.42 b 203.00 a
1.14
200 142.48 b 241.84 a 300 134.06 b 184.66 a 400 128.58 b 168.56 a
1.52 200 300 158.82 b 138.76 b 355.32 a 224.42 a 400 130.72 b 179.90 a
C.V./ FLEVENE/ K-S 3.69/4.211/0.079
RA Nozzle
Flow rate (L min-1) Pressure (kPa) VP GA
0.76 200 300 1.05 a 0.96 a 1.55 b 1.63 b
400 0.92 a 1.42 b
1.14
200 1.11 a 1.87 b
300 0.92 a 1.64 b
400 0.88 a 1.24 b
1.52
200 1.11 a 1.62 b
300 0.93 a 1.41 b
400 0.88 a 1.15 b
C.V./ FLEVENE/ K-S 3.40/2.208/0.100
Averages followed by lower case letters in the lines differ from each other by the Tukey test at the 0.05 level of significan ce. FLevene, K-S:
Table 4 shows the results obtained from VMD and RA for the unfolding of the interaction between pressure and flow rate.
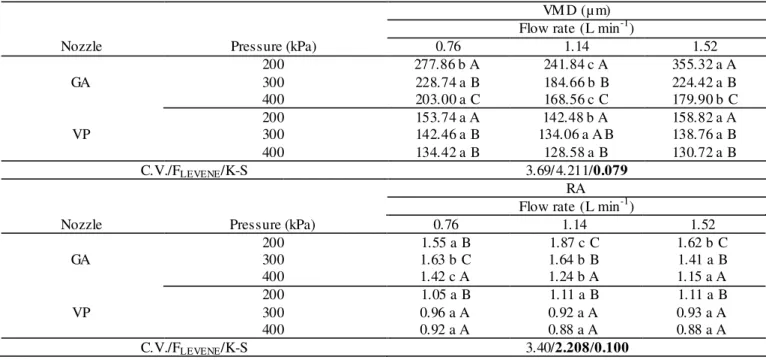
TABLE 4. Vo lu me median diameter (VMD) and relative amp litude (RA) resulting fro m the application with spray nozzles (GA) and without (VP) air induction, with different flo w rates and operating pressures.
VMD (µ m) Flow rate (L min-1)
Nozzle Pressure (kPa) 0.76 1.14 1.52
GA
200 277.86 b A 241.84 c A 355.32 a A 300 228.74 a B 184.66 b B 224.42 a B 400 203.00 a C 168.56 c C 179.90 b C
VP 200 300 153.74 a A 142.46 a B 134.06 a A B 142.48 b A 158.82 a A 138.76 a B 400 134.42 a B 128.58 a B 130.72 a B C.V./FLEVENE/K-S 3.69/4.211/0.079
RA Flow rate (L min-1)
Nozzle Pressure (kPa) 0.76 1.14 1.52
GA 200 300 1.63 b C 1.55 a B 1.64 b B 1.87 c C 1.62 b C 1.41 a B 400 1.42 c A 1.24 b A 1.15 a A
VP
200 1.05 a B 1.11 a B 1.11 a B 300 0.96 a A 0.92 a A 0.93 a A 400 0.92 a A 0.88 a A 0.88 a A C.V./FLEVENE/K-S 3.40/2.208/0.100
Averages followed by distinct letters, lowercase in the row and upper case in the co lumn, differ from each other by the Tukey test at the 0.05 level of significance. FLevene, K-S: statistics of the Levene and Kolmogorov-Smirnov tests, respectively; values in bold indicate residues with
normal distribution and homogeneous variances at 0.01 of significance. CV (%): coefficient of variation.
At the nozzles with air induction and pressure of 200 kPa, the highest VMD was obtained with a flow rate of 1.52 L min-1. When the pressure was raised to 300 kPa, no statistical difference was observed between the VMD of the spray nozzles with air induction and flow rate of 0.76 and 1.52 L min-1, which were higher than the VMD of the nozzle with flow rate of 1.14 L min-1 (184.66 μm). The highest VMD at the pressure of 400 kPa was obtained at the nozzle with flow rate of 0.76 L min-1 (203 μm). With this, there was an inversion of the VMD results between spray nozzles with flow rates of 0.76 and 1.52 L min-1 when the pressure increased from 200 to 400 kPa. The VMD o f the nozzle with air induction and flow rate of 1.14 L min-1 was lower than the other flow rates evaluated. In general, a linear relation is expected, in which the increase of the flow rate leads to the increase of the VMD, due to the increase of the outlet orifice. Ho wever, this relation, especially at the nozzle with air induction, can be altered by the existence of a pre-orifice controlling the flow rate and the outlet orifice, wh ich controls the droplet size. Etheridge et al. (1999) also found unexpected results of this nature. The authors attributed this to the internally generated turbulence at the nozzle with air induction.
The nozzles without air induction at 200 kPa pressure with a flow rate of 0.76 and 1.52 L min-1 showed no statistical difference between the VMD, but these were higher than the VMD of the nozzle with flow rate of 1.14 L min-1. When submitted to pressures of 300 and 400 kPa, there was no difference for the VMD among the different flow rates. With this, the increase of the pressure reduces
the VMD variation of the nozzles without air induction, even of different flo w rates.
The spray nozzles with air induction and flow rate of 0.76 L min-1 presented lower RA when subjected to a
pressure of 200 kPa (1.55). However, when the pressure was raised to 300 and 400 kPa, the lowest RA values were obtained with the nozzles with flow rate of 1.52 L min-1.
Cunha et al. (2007) verified that the increase in pressure corroborates for larger RA. In the same study, when using the ADI 110-02 low drift nozzles, the lowest RA values were found at a pressure of 200 kPa (1.00), while at a pressure of 400 kPa the RA was 1.27.
The RA values of the spray nozzles without air induction did not present significant differences among the flow rates. However, when the nozzles without air induction were subjected to a pressure of 200 kPa, the highest values of RA were observed. This relation is possibly due to the very constructive geometry of this high advanced model.
The droplet velocity was equal between the spray nozzles with and without air induction for the flow rates of 0.76 and 1.52 L min-1 (Table 5). However, the spray
TABLE 5. Droplet velocity (m s-1) resulting fro m the application with spray nozzles with (GA ) and without (VP) air induction, with different flo w rates.
Velocity (m s-1) Nozzle
Flow rate (L min-1) VP GA
0.76 1.88 a B 1.94 a C
1.14 2.74 a A 2.55 b B
1.52 2.76 a A 2.86 a A
C.V./ FLEVENE/ K-S 7.880/3.342/0.137
Averages followed by distinct letters, lowercase in the row and upper case in the column, differ from each other by the Tukey test at the 0.05 level of significance. FLevene, K-S: statistics of the Levene and Kolmogorov-Smirnov tests, respectively; values in bold indicate residues with
normal distribution and homogeneous variances at 0.01 of significance. CV (%): coefficient of variation.
This difference can be explained by the fact that the velocity is not only related to the droplet size, but also to the kinetic energy of the droplet launch and its density. Depending on the operating conditions, one of these factors may be more pronounced than the other, leading to a behavior variation as found in this operation. Droplets produced by the nozzles with air induction are larger; however, its nozzle ejection speed may be lower, given the pressure fall pro moted by the turbulence chamber responsible for mixing the air and the liquid. Although, after their ejection, they suffer less reduction in fall velocity than the droplets produced by nozzles without air induction. This can be exp lained by the fact that smaller droplets, which have lower mass, tend to have their velocity reduced by the action of wind resistance in the path between their release and the target.
Nozzles with and without air induction with higher flow rates produced droplets with higher velocities. In a
study conducted by Nuyttens et al. (2009), using spray nozzles with and without air induction, with flow rates of 0.76; 1.14; 1.52 and 2.27 L min-1, also verified that the
droplets generated by nozzles with higher flo w rates presented higher velocities. The authors attributed this mainly to the larger droplet diameter generated at the nozzles of higher flo w rate.
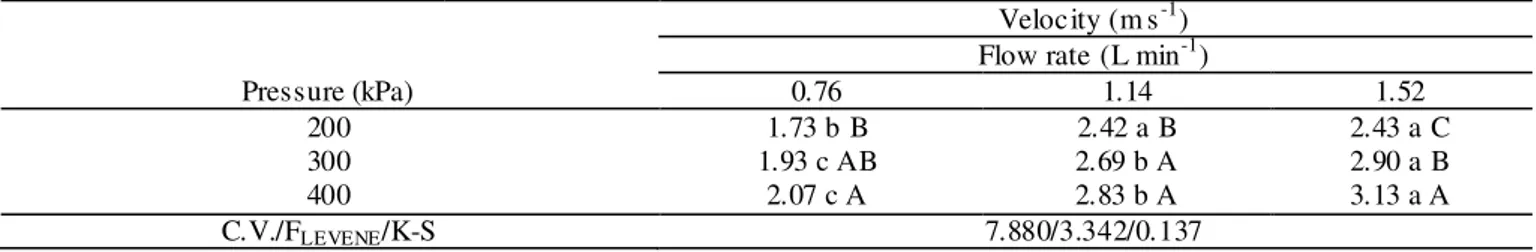
Spray nozzles with h igher flow rates produced droplets with higher velocities (Table 6), except for the pressure of 200 kPa, where the droplet velocities were statistically the same for the nozzles with flow rates of 1.14 L min-1 and 1.52 L min-1 (2.42 and 2.43 m s-1, respectively). Nozzles with higher flow rates have a larger outlet orifice, which pro motes less restriction to the passage of the liquid, possibly contributing to the increase in droplet velocity.
TABLE 6. Droplet velocity (m s-1) resulting from the application with spray nozzles with different flow rates and at different operating pressures.
Velocity (m s-1)
Flow rate (L min-1)
Pressure (kPa) 0.76 1.14 1.52
200 1.73 b B 2.42 a B 2.43 a C
300 1.93 c AB 2.69 b A 2.90 a B
400 2.07 c A 2.83 b A 3.13 a A
C.V./FLEVENE/K-S 7.880/3.342/0.137
Averages followed by distinct letters, lowercase in the row and upper case in the column, differ from each other by the Tukey test at the 0.05 level of significance. FLevene, K-S: statistics of the Levene and Kolmogorov-Smirnov tests, respectively; values in bold indicate residues with
normal distribution and homogeneous variances at 0.01 of significance. CV (%): coefficient of variation.
The increases in pressure caused a raise in the droplets velocity at all flow rates. At 1.52 L min-1, the highest velocity was obtained at a pressure of 400 kPa (3.13 m s-1). Kun et al. (2015) and Miller & Smith (1997)
found similar results, they found that the increase in pressure caused a raise in droplet velocity. Also Nuyttens et al. (2009), using standard flat spray nozzles with flo w rates of 1.14 L min-1 under different pressures, found a 25.8% increase in droplet velocity when the pressure was raised fro m 200 to 400 kPa.
The increase of the pressure raises the kinetic energy of the droplets, resulting in increased velocity. Higher velocities cause the path between the mo ment of the droplet launch and the target to be traveled in a shorter time, contributing to drift reduction (Ozkan, 1998). However, as pressure increases, VMD reduction also occurs, interfering inversely with the drift. Therefore, it is clear that only the increase in operating pressure is not a
totally viable alternative when reducing drift in crop protection products applications.
It should be noted that in this work the droplet velocity was calculated for the average for each nozzle. Different analysis can be done by considering the velocity for each class of droplet size for each nozzle, which would allo w an understanding of the difference between them in each class of droplet size.
CONCLUS IONS
The spray nozzles with air induction produced droplets with larger VMD than corresponding nozzles without air induction. This increase is 63.31%.
Nozzles with air induction promoted a less homogeneous droplet spectrum than the nozzles without air induction.
The droplet velocity showed little variation between nozzles with and without air induction with the same flo w rate and pressure; however, nozzles with higher flow rates produced droplets with higher velocities.
ACKNOWLEDGMENTS
We thank to CNPq, Fapemig and Capes for the financial support to conduct this research.
REFERENCES
ASAE - A merican Society of Agricultural Engineering (2000) Spray no zzle classification by droplet spectra. (ASAE Standard S572 AUG99). A SAE, p389-391. Bueno MR, Cunha JPA R da, Ro man RAA (2013)
Tamanho de gotas de pontas de pulverização em d iferentes condições operacionais por meio da técnica de difração do raio laser. Engenharia Agríco la 34(5):976-985.
Carvalho FK, Antuniassi UR, Chechetto RG, Mota AAB, Jesus MG de, Carvalho LR de (2017) Viscosity, surface tension and droplet size of sprays of different formu lations of insecticides and fungicides. Crop Protection 101:19-23. Chechetto RG, Antuniassi UR, Mota AAB, Carvalho FK, Silva ACA E, Vilela CM (2013) Influência de pontas de pulverização e adjuvantes no potencial de redução de deriva em túnel de vento. Semina: Ciências Agrárias 34(1):37-46.
Cunha JPAR da, Marques RS, Alves GS (2016) Deposição da calda na cultura da soja em função de diferentes pressões de trabalho e pontas de pulverização. Revista Ceres 63(6):761-768.
Cunha JPAR da, Teixeira MM, Fernandes HC (2007) Avaliação do espectro de gotas de pontas de pulverização utilizando a técnica da difração do raio laser. Engenharia Agrícola:10-15. Nú mero especial.
Etheridge RE, Wo mac AR, Mueller TC (1999)
Characterization of the spray droplet spectra and patterns of four venturi-type drift reduction nozzles. Weed Technology 13(4):765-770.
Faggion F (2008) Estimativa da velocidade das gotas através das forças de impacto. Pesquisa Aplicada & Agrotecnologia 1(1):163-170.
Ferreira DF (2008) Sisvar: u m programa para análises e ensaios de estatística. Revista Sy mposium 6(1):36-41. Kashdan JT, Shrimpton JS, Whybrew A (2007) A digital image analysis technique for quantitative characterisation of high-speed sprays. Optics and Lasers in Engineering 45(1):106-115.
Kun L, Yu YG, Zhao N (2015) Experimental Study on Spray Characteristic of A ir-assist Swirl Nozzle in Confined Space. Acta Armamentary 36(10).
Leite MF, Serra JCV (2013) Avaliação dos impactos amb ientais na aplicação dos Agrotóxicos. A mbiência Guarapuava (PR) 9(3):675-682.
Matthews GA (2000) Pesticide application methods. Malden, Blackwell. 432p.
Mcginty JA, Bau mann PA, Hoffmann WC, Fritz BK (2016) Evaluation of the spray droplet size spectra of drift-reducing agricultural spray nozzle designs. American Journal of Experimental Agriculture 11(3):1-5.
Miller PCH, Smith RW (1997) The effect of forward speed on the drift fro m boom sprayers. In: BRIGHTON CROP PROTECTION CONFERENCE. Proceedings... Brighton: BCPC, p399-406.
Mota AAB, Antuniassi UR (2013) Influência de
adjuvantes no espectro de gotas de ponta com indução de ar. Revista Energia na Agricultura 28(1):1-5.
Murphy SD, Mortimer V, Lydon M (2004) Droplet Sizing and Imag ing of Agricu ltural Sprays Using Particle/Droplet Image Analysis. In: International Conference on Pesticide Application for Drift Management. Waikoloa.
Proceedings… Pullman: WSU, p324-329.
Nuyttens D, De Schampheleire M, Verboven P, Brusselman E, Dekeyser D (2009) Droplet size and velocity characteristics of agricultural sprays. Transactions of the Asabe 52(5):1471-1480.
Ozkan HE (1998) Effects of major variables on drift distances of spray droplets. FactSheet AEX 525-98. Colu mbus. Oh io State Un iversity Extension. 16p.
Sayinci B (2015) The influence of strainer types on the flow and droplet velocity characteristics of ceramic flat-fan nozzles. Turkish Journal of Agricultural and Forestry 39:1-14.
Silva JER da, Cunha JPA R da, No melini QSS (2014a) Deposição de calda em folhas de cafeeiro e perdas para o solo com diferentes taxas de aplicação e pontas de pulverização. Revista Brasileira de Engenharia Agrícola e Ambiental 18(12):1302–1306.
Silva BP da, Machado ÂA, Fonseca ED da, Ferreira M D da C (2014b) Distribuição, d iâmetro de gotas e
fito xicidade de herbicidas aplicados em mudas de eucalipto com pontas de indução de ar. Revista Brasileira de Herbicidas 13(3):225-234.
Silva JER da, Cunha JPA R da, No melini QSS (2016) Controle estatístico de processo em pulverização hidropneumática na cultura do café. Coffee Science 11(1):11-21.
SPSS (2013) SPSS statistics for Windows, version 22.0. Armonk, IBM Corporation.
Wang S, Dorr GJ, Khashehchi M, He X (2015)