Doi: https://doi.org/10.25186/.v15i.1663
Estimation of genetic parameters and selection of Coffea canephora
progenies evaluated in Brazilian Western Amazon
Celso Luis Bergo1 , Daniela Popim Miqueloni2 , Aureny Maria Pereira Lunz1 , Giselle Mariano Lessa de Assis1
1Empresa Brasileira de Pesquisa Agropecuária/Embrapa, Embrapa Acre, Rio Branco, AC, Brasil 2Universidade Federal do Acre/UFAC, Centro de Ciências Biológicas e da Natureza, Rio Branco, AC, Brasil
Contact authors: [email protected], [email protected], [email protected], [email protected]
Received in November 1, 2019 and approved in March 10, 2020
ABSTRACT
Coffee has emerged as an economic alternative culture in the State of Acre, Brazil, but without a clonal variety recommended for the state to overcome the unevenness presented by seed crops. Thus, in order to estimate genetic parameters and indicate progenies of Coffea canephora to compose a clonal variety for the State of Acre, yield, vegetative vigor and plant height were evaluated in five harvests of a randomized complete block experiment with 46 progenies, 4 repetitions and 10 plants per plot by mixed model methodology (REML/BLUP). The harvests were evaluated individually, by the model that considers one harvest, one location and the mean of progenies, and joint analysis (all harvests), by repeatability model with stability and temporal adaptability by the harmonic mean of relative performance of genotypic values method (MHPRVG), with genotypic values of progenies grouped by the Tocher method. There was variability, with possibility of selection, only for grain yield. The yield was strongly affected by production bienniality, with high environmental influence and harvests mean ranging from 14.13±4.60 to 46.20±14.94 bags ha-1 and individual heritabilities from 0.10 to 0.44. Sixteen
‘Conilon’ coffee progenies with selection gains above 23% were selected. The MHPRVG method allows the refinement of progeny selection throughout the harvests, identifying the most adapted and stable.
Key words: ‘Conilon’ or ‘Kouilou’ coffee; Breeding; Mixed models.
1 INTRODUCTION
Coffee crop of the Brazilian Western Amazon, especially in the State of Acre, has emerged as an economic alternative of agricultural cultivation. From 2012, and with evidence of good coffee prices in the last two years, Acre government launched a coffee crop strengthening program of the State of Acre in partnership with producers, banks, agricultural extension and research with the support of Embrapa Acre and Embrapa Rondônia (Brando et al., 2013). Because of the program, there has been a progressive increase in coffee established area, which currently occupies about 1,650 ha distributed in 15 of 22 Acre municipalities. This area corresponds to 12% of total agricultural occupation of the State, located mainly in small properties, generating USD$2.7 million annually, which corresponded to 11.5% of the total value of the state’s agricultural production in 2017 (IBGE, 2019).
The preference for ‘Conilon’ coffee in Acre occurs by climate characteristics favorable for its development and the later onset of the harvest (since May) coinciding with the dry season, which facilitates the drying of grains. Even with the increase in planted area and good yield mean in relation to the Northern Brazilian States, 26 bags of clean coffee per ha (IBGE, 2019), roasters from the State of Acre still import coffee for domestic consumption. Data from Acre State Treasury Department, for the year 2015, reveal an import of approximately 5,500 clean coffee bags of 60 kg of ‘Conilon’ variety.
Thus, coffee culture in Acre, considering the internal consumption of the state and also the possibility of exportation,
presents growth prospects supported by the incentive to expand the cultivation area. There is furthermore the prospect of increasing production and yield based on technological innovations and introducing new varieties with high productive potential, such as clonal varieties of ‘Conilon’ coffee.
The coffee tree, being a species of perennial character, contains several characteristics that differentiate its genetic improvement compared to annual species. Examples of such differences are generation overlap, character expression over multiple cycles, and bienniality, leading to use of selected individuals for several years, and hence unbalanced data (Resende; Valle; Jank, 2008; Rocha et al., 2015). In this manner, greater accuracy and precision in selection methods are necessary to ensure genetic parameters estimation and appropriate genotypic values prediction, considering the information of production superiority linked to measurements (or evaluations) in various harvests.
This type of analysis contemplates the differential behavior of the genotype, that is, genotype x environment interactions, which may result in distinct performance under environmental conditions throughout cultivation. The ability to adjust to the environment and the constant behavior under various conditions are adaptability and stability characteristics of genetic material and are related to its genetic constitution (Resende; Valle; Jank, 2008). As follows, an efficient method that capitalizes on adaptability, stability and yield is to obtain the harmonic mean of relative performance of genotypic values (MHPRVG). This method provides genotypic information and allows dealing with unbalancing data and heterogeneity of
variance situations, as well as allowing the calculation of genetic gains while considering these attributes (Resende, 2007).
Another characteristic of the species is obligatory cross-fertilization. This makes the fruits harvested in a Coffea canephora plant necessarily come from crosses of this matrix with other nearby plants that acted as male parents, but which are not always productive, that may reduce crop yield and uniformity (Rocha et al., 2015). Currently, there is not a recommended clonal coffee variety for the State of Acre to overcome this irregularity presented by seed crops. Given the context, this study aimed to estimate genetic parameters and indicate progenies of Coffea canephora, based on the genotype x environment interaction, in order to support the next steps of species breeding for the Acre State.
2 MATERIAL AND METHODS
The experiment was conducted at experimental field of Embrapa Acre, located in Rio Branco, AC (Latitude 9°58’22” S, longitude 67°48’40” W, WGS 84) at about 160 m altitude.
Acre’s climate is classified as tropical humid, with high rainfall, between 1,800 and 2,500 mm per year, with a marked dry period between July and September. The annual temperature mean is around 24.5 ºC, while the maximum of 32 ºC remains relatively uniform throughout the State and the lowest temperatures in July, between 17 and 22 ºC (ACRE, 2010).
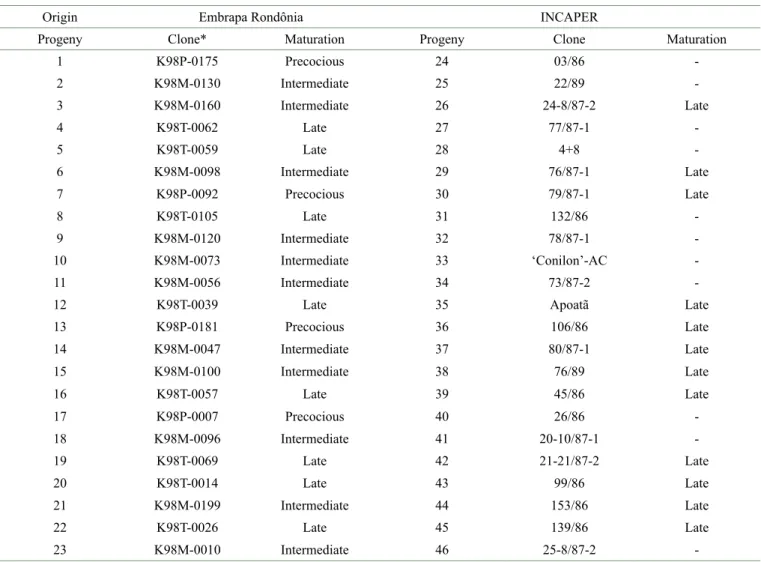
The genetic material was obtained from Instituto Capixaba de Pesquisa, Assistência Técnica e Extensão Rural – INCAPER (23 clones) and from Empresa Brasileira de Pesquisa Agropecuária – Embrapa Rondônia (23 clones) (Table 1). The experiment was carried out in January 2007 and conducted until December 2013 from seeds (called progenies), which were sent by the two research institutions mentioned. These seeds were obtained from the harvest of each clone identified from both sources (INCAPER and Embrapa Rondônia) and implanted in a randomized complete block design with 46 progenies, 4 replications and 10 plants per plot, with 4 x 3 m spacing.
The experiment was carried out in an area of dystrophic Red Argisol with the following chemical Table 1: Identification, origin and maturation cycle of Coffea canephora progenies evaluated in Rio Branco, AC.
Origin Embrapa Rondônia INCAPER
Progeny Clone* Maturation Progeny Clone Maturation
1 K98P-0175 Precocious 24 03/86 -2 K98M-0130 Intermediate 25 22/89 -3 K98M-0160 Intermediate 26 24-8/87-2 Late 4 K98T-0062 Late 27 77/87-1 -5 K98T-0059 Late 28 4+8 -6 K98M-0098 Intermediate 29 76/87-1 Late 7 K98P-0092 Precocious 30 79/87-1 Late 8 K98T-0105 Late 31 132/86 -9 K98M-0120 Intermediate 32 78/87-1 -10 K98M-0073 Intermediate 33 ‘Conilon’-AC -11 K98M-0056 Intermediate 34 73/87-2
-12 K98T-0039 Late 35 Apoatã Late
13 K98P-0181 Precocious 36 106/86 Late 14 K98M-0047 Intermediate 37 80/87-1 Late 15 K98M-0100 Intermediate 38 76/89 Late 16 K98T-0057 Late 39 45/86 Late 17 K98P-0007 Precocious 40 26/86 -18 K98M-0096 Intermediate 41 20-10/87-1 -19 K98T-0069 Late 42 21-21/87-2 Late 20 K98T-0014 Late 43 99/86 Late 21 K98M-0199 Intermediate 44 153/86 Late 22 K98T-0026 Late 45 139/86 Late 23 K98M-0010 Intermediate 46 25-8/87-2
attributes: pH in water: 6.4; P: 9 mg kg-1; K: 31 mg kg-1;
Na: 0 mg kg-1; Ca 3.9 cmol
c kg-1; Mg: 1.1 cmolc kg-1; Al:
0 cmolc kg-1; H+Al: 0.8 cmolc kg-1; Organic C: 1.09 g kg-1.
The cultural practices used in the experiment consisted of basic fertilization according to soil analysis, control of pest and invasive plants between rows and under canopy. The initial fertilization consisted of 100 g of corral manure, 250 g of simple superphosphate, 100 g of dolomitic limestone and 50 g of potassium chloride per pit. Regular NPK-based fertilizations were performed in subsequent years, as recommended by Prezotti et al. (2007) for the culture.
Development and production of progenies were evaluated. Regarding development, the vegetative vigor and plant height evaluations were performed in the 10 plants within the plot, resulting in five evaluations for vigor in the years: 2008, 2009, 2010, 2012 and 2013; and four to plant height in: 2008, 2009, 2012 and 2013. Plant vigor was estimated based on a visual scale, according to Carvalho, Mônaco and Fazuoli (1979), considering the individual aspects of sanity: 1. very bad; 2. between very bad and bad; 3. bad; 4. between bad and regular; 5. regular; 6. between regular and good; 7. good; 8. between good and very good; 9. very good; 10. excellent. Height was measured using a measuring tape.
The production was evaluated by grain yield, in processed coffee bags (PCB), 60 kg ha-1, during the years
2009, 2010, 2012 and 2013, considering the progeny mean. There were no evaluations in 2011.
The mixed model methodology was employed in data analysis, in which the variance components were estimated by the Restricted Maximum Likelihood (REML) and the genotypic values were predicted by the Best Linear Unbiased Prediction (BLUP). Development characteristics (vigor and height) and yield were initially analyzed for each year in order to evaluate the heterogeneity of variances among harvests, as determined by the Hartley’s test. When necessary, phenotypic variables were multiplied by the correction factor that considers individual heritability, according to Resende (2007): hgi/
h
g , where hgi is thesquare root of the individual heritability of character in harvest i and
h
g is the square root of the heritability mean of all harvests.The one-site, one-harvest, and plot (progeny) mean evaluation model was used for development and yield characteristics (Equation 1):
In the analysis with all harvests together, the repeatability model with stability and temporal adaptability by the harmonic mean of relative performance of genotypic values method (MHPRVG), considering the plot mean, was used for development and production (Equation 2):
y = Xr + Zg + e (1) where y is the data vector, r is the repetition effects vector (considered fixed) plus the overall mean, g is the genotypic effects vector (considered random), and e is the errors or residuals (random) vector. Capital letters represent the matrices of incidence for these effects.
y = Xm + Zg + Wp + Ti + e (2) where y is the data vector, m is the measurement-repeat combinations effect vector (considered fixed) plus the general mean, g is the genotypic effects vector (considered random), p is the permanent environment effect vector (plots, considered random), i is the interaction genotype x measurements effects vector and e is the vector of errors or residuals (random). Capital letters represent the matrices of incidence for these effects.
The variance components estimated by REML were used to estimate the genetic parameters, according to Resende (2002): individual heritability in the broad sense (h2
g), heritability standard deviation (shg), progeny mean
heritability (h2
m), genotypic coefficient of variation (CVg),
residual coefficient of variation (CVe), variance of prediction
error (VPE), standard deviation of predicted genotypic value (SDPG) and confidence interval. Additionally, for the model (2), repeatability estimates (r), coefficient of determination of permanent environmental effects (c2
p), coefficient of
determination of interaction genotype x measurement effects (c2
gm) and genotypic correlation through measurements or
mean repeatability of harvests (rm) were obtained.
The model effects were tested by deviance analysis using the likelihood ratio test (LRT), given by the difference of the value of -2log10L, where L is the likelihood function
of the parameterized model and the model without the tested effect (Resende, 2016).
To subsidize the selection of superior progenies, the grouping by adapted Tocher’s optimization method was used, which using univariate mode determined groups based on the MHPRVG values of yield, derived from the genotypic values ranking of the model (2). In this case, the principle of formation of more homogeneous groups internally and heterogeneous among themselves was maintained, obtaining non-empty subgroups by minimizing the pre-established mean similarity (Cruz; Regazzi; Carneiro, 2012), however considering only one variable. The most similar pairs of individuals were formed from the dissimilarity matrix, which, in this case, now contains only the production values, including new elements according to the smallest differences. The admission of new elements into the group, which may increase internal distances (or production differences), was limited by the predetermined maximum distance criterion, that is, the broadest difference in production values for each group.
The analyzes by the REML/BLUP methodology were performed with the aid of the SELEGEN - REML/BLUP software
(Resende, 2016) and the grouping of progeny yield means by the Tocher method with the GENES software (Cruz, 2016).
3 RESULTS AND DISCUSSION
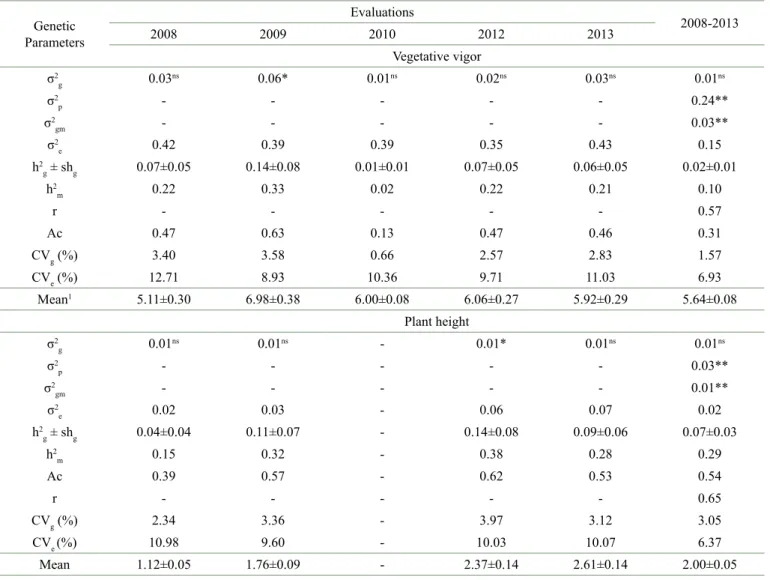
Regarding development characteristics, there was variability between progenies only for vegetative vigor evaluated in 2009 and plant height in 2012 (Table 2). For the remaining years and the joint analysis, the development characteristics did not indicate genotypic variation. In general, the development characteristics support the coffee breeding process, since the greater plant vigor is related to the adaptability and stability of production (Ferreira et al., 2013; Pedro et al., 2011) and lower plant heights are related to harvest easiness and phytosanitary procedures (Carvalho; Mônaco; Fazuoli, 1979; Rocha et al., 2015). However, without
progeny differentiation because of low genetic variability, it is unfeasible to obtain selection gains based on these characteristics.
The estimates of heritability in the broad sense (h2 g),
which by magnitude indicates the degree of difficulty of improving the interest characteristic, and the genotypic coefficients of variation (CVg) reinforce this result.
Heritabilities were low (h2
g<0.15), according to Resende
(2002) classification, with low to moderate accuracy (0.13<Ac<0.62). The ratios between the CVg and CVe were below 1.0 for characters as vegetative vigor and plant height, indicating low genetic influence. But then, the residual coefficients of variation (CVe) were close to or below 10%, indicating good experimental accuracy, however without guaranteeing the required selection accuracy (Ac>70%) at this stage of breeding (Resende, 2002; Resende; Duarte, 2007). Table 2: Genetic parameters estimated for characteristics such as vegetative vigor (grades 1 to 10) and plant height (m), evaluated annually and by joint analysis for 46 coffee progenies.
Genetic Parameters Evaluations 2008-2013 2008 2009 2010 2012 2013 Vegetative vigor σ2 g 0.03ns 0.06* 0.01ns 0.02ns 0.03ns 0.01ns σ2 p - - - 0.24** σ2 gm - - - 0.03** σ2 e 0.42 0.39 0.39 0.35 0.43 0.15 h2 g ± shg 0.07±0.05 0.14±0.08 0.01±0.01 0.07±0.05 0.06±0.05 0.02±0.01 h2 m 0.22 0.33 0.02 0.22 0.21 0.10 r - - - 0.57 Ac 0.47 0.63 0.13 0.47 0.46 0.31 CVg (%) 3.40 3.58 0.66 2.57 2.83 1.57 CVe (%) 12.71 8.93 10.36 9.71 11.03 6.93 Mean1 5.11±0.30 6.98±0.38 6.00±0.08 6.06±0.27 5.92±0.29 5.64±0.08 Plant height σ2 g 0.01ns 0.01ns - 0.01* 0.01ns 0.01ns σ2 p - - - 0.03** σ2 gm - - - 0.01** σ2 e 0.02 0.03 - 0.06 0.07 0.02 h2 g ± shg 0.04±0.04 0.11±0.07 - 0.14±0.08 0.09±0.06 0.07±0.03 h2 m 0.15 0.32 - 0.38 0.28 0.29 Ac 0.39 0.57 - 0.62 0.53 0.54 r - - - 0.65 CVg (%) 2.34 3.36 - 3.97 3.12 3.05 CVe (%) 10.98 9.60 - 10.03 10.07 6.37 Mean 1.12±0.05 1.76±0.09 - 2.37±0.14 2.61±0.14 2.00±0.05
1Mean ± confidence interval. ns: not significant; and ** and *: significant at 1% and 5% of probability, respectively, by the deviance analysis, based
on the LRT test. σ2
g: genotypic variance; σ2p: variance of permanent plot effects; σ2gm: variance of genotype x measurement interaction effect;
σ2
e: residual variance; h2g: heritability in the broad sense; shg: heritability standard deviation; h2m: plot mean heritability; Ac: selection accuracy; r:
The mean values of plant height indicated an increase over time, evidencing the establishment period of culture, which generally tends to stability after the fourth year of cultivation (Pereira et al., 2014). This characteristic is highly influenced by the environment, as observed by the significant variance of permanent plot effects (σ2
p) in the repeatability
model (Table 2), and reflects factors such as water availability, plant density, soil clay content, density and fertility (Carvalho et al., 2013; Pereira et al., 2014; Rodrigues et al., 2016).
There was variability only in the second evaluation (measurement) for plant vigor, in which the phenotypic potential indicated greater expression, also demonstrating the high environmental influence on this characteristic. This can also be noted by the significant plot (σ2
p) and genotype x
evaluation (σ2
gm) interactions in joint analysis, corroborating
the observed for species in the States of Espírito Santo and Minas Gerais (Carias et al., 2016; Silva et al., 2015b).
The vigor mean values varied throughout the evaluations, from 5.11 to 6.98, that is, between regular and good, but without association with the highest grain yields (Table 3). On the other hand, Rocha et al. (2015) highlight the importance of this characteristic, because the vegetative vigor
relationship with small plants has occurred since the juvenile phase, allowing the precocious selection of more robust and smaller plants, characteristics that facilitate harvesting. Vigor values of this magnitude are commonly reported for the species, for both ‘Conilon’ and Robusta progenies (Carias et al., 2016; Silva et al., 2015a, b).
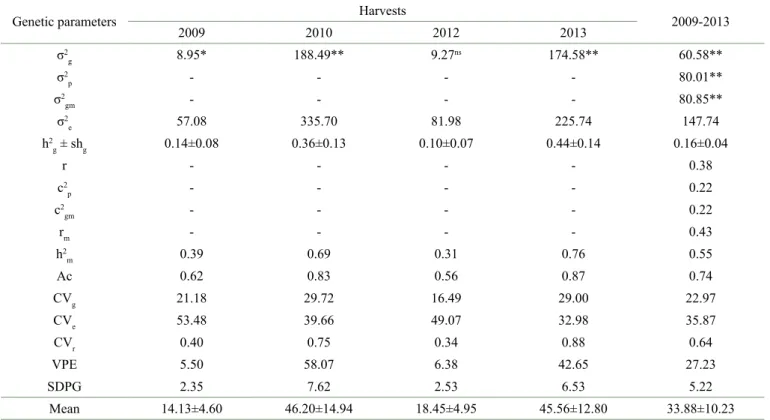
For the joint analysis, repeatability (r), which indicates the maximum value that heritability can reach at this specific location, was moderate for vigor and high for plant height according to Resende (2002) classification, suggesting that three evaluations were necessary to predict with 80% of reliability the actual value of individuals with respect to these characteristics. There was genotypic variability in three harvests and in the joint analysis for yield (Table 3), in addition to considerable variation among them, characterizing marked production bienniality. Grain yield remains the most important factor in adopting a cultivar or selecting plants for clonal multiplication, mainly because of the direct impact on production cost amortization (Galeano; Krohling, 2019). Thus, productivity is one of the critical selection criteria used in the genetic improvement of species (Carias et al., 2016; Ramalho et al., 2016; Pereira et al., 2013; Silva et al., 2015b).
Table 3: Genetic parameters estimated for processed coffee yield (bags ha-1) for 46 coffee progenies, evaluated for individual and
joint analysis (repeatability model) of harvests.
Genetic parameters Harvests 2009-2013
2009 2010 2012 2013 σ2 g 8.95* 188.49** 9.27ns 174.58** 60.58** σ2 p - - - - 80.01** σ2 gm - - - - 80.85** σ2 e 57.08 335.70 81.98 225.74 147.74 h2 g ± shg 0.14±0.08 0.36±0.13 0.10±0.07 0.44±0.14 0.16±0.04 r - - - - 0.38 c2 p - - - - 0.22 c2 gm - - - - 0.22 rm - - - - 0.43 h2 m 0.39 0.69 0.31 0.76 0.55 Ac 0.62 0.83 0.56 0.87 0.74 CVg 21.18 29.72 16.49 29.00 22.97 CVe 53.48 39.66 49.07 32.98 35.87 CVr 0.40 0.75 0.34 0.88 0.64 VPE 5.50 58.07 6.38 42.65 27.23 SDPG 2.35 7.62 2.53 6.53 5.22 Mean 14.13±4.60 46.20±14.94 18.45±4.95 45.56±12.80 33.88±10.23
ns: not significant; ** and *: significant at 1% and 5% of probability, respectively, by the deviance analysis, based on the LRT test. σ2
g: genotypic
variance; σ2
p: variance of permanent plot effects; σ2gm: variance of genotype x measurement interaction effect; σ2e: residual variance; h2g: heritability
in the broad sense; shg: heritability standard deviation; r: repeatability; c2p: coefficient of determination of permanent environmental effects; c2gm:
coefficient of determination of interaction genotype x measurement effects; h2
m: mean heritability; rm: genotypic correlation through measurements;
Ac: selection accuracy; CVg: genotypic coefficient of variation; CVe: residual coefficient of variation; CVr: relative coefficient of variation; VPE:
Another substantial factor for selection is the bienniality of coffee production, which is characterized by alternation of yields between harvests, with the influence of several factors, such as the reduction of plant reserves in years of high yields. This makes the following year production will be inferior because of lower growth of plagiotropic branches. Moreover, the genetic variability of C. canephora species itself causes variation, since there are coffee genotypes with varying characteristics of vegetative vigor and different recovery capacities from one harvest to another. Variation can occur in highly productive genotypes, with marked bienniality, even in those with lower production load, but with greater stability (Rocha et al., 2015). This genetic variation is also important in coffee grain maturation cycles, which, despite climatic influences, have a direct effect on homogeneity of culture and harvest and production costs (Ramalho et al., 2016; Souza et al., 2017).
The largest yield presented higher heritability, considered moderate and, consequently, with high selection accuracy (Ac>0.70), according to Resende (2002) classification. The progeny means heritability, which reflects the plot environment, was also higher, as well as the less discrepant CVg and CVe. This indicates a greater possibility of
gains with selection (Resende; Duarte, 2007) when compared to those obtained for the development characteristics (Table 2), but all lower than the unit.
Production stability associated with progeny adaptability, as well as selection efficiency, based on repeated evaluations, allows the selection of superior and less biennial genotypes (Ramalho et al., 2016). As follows, the repeatability model allows the simultaneous estimation of individual heritability and repeatability and genetic correlation between harvests, essential for selection strategies definition (Pereira et al., 2013). For this model, there was variability for grain yield, with significant effect of permanent plot and harvest interaction (Table 3). The individual heritability in the broad sense was lower compared to the best analyzes by harvest, but with the similar levels of CVg and CVe. This was reflected in the joint analysis model because it considers the environment interaction, since environmental effects are determinant in the expression in that characteristic, even in cases where there is genetic superiority (Ramalho et al., 2016). Climate factors are an example as they directly influence the maturation cycle of grains, which in turn is a quantitative characteristic, that is, with complex inheritance and governed by several genes, which affects the harvest period (Souza et al., 2017).
Progeny mean heritability (h2
m) provided high selection
accuracy, with median repeatability, according to Resende (2002) classification, already observed for culture, but under higher progeny variability (Pereira et al., 2013; Ramalho et al., 2016). Repeatability (r) is of fundamental importance in predicting genotypic values of perennials plants by evaluating
the maintenance of genetic superiority throughout the harvest and increasing selective efficiency (Ramalho et al., 2016; Resende; Valle; Jank, 2008). In this study, estimates indicate that seven harvests are required to reach a coefficient of determination of 80% in evaluation of permanent phenotypic value of a plot, obtaining h2
m of 0.64, with 46%
of efficiency compared to evaluation of only one harvest. But then, considering a 70% coefficient of determination, 37% efficiency is obtained regarding the four evaluated harvests. Normally, four harvests have been sufficient to evaluate the productivity of both C. canephora and C. arabica in the States of Minas Gerais and Rondônia (Pereira et al., 2013; Ramalho et al., 2016).
The genotypic correlation through measurements or mean repeatability of harvests (rm) was higher than
that observed for the species, between 0.01 to 0.13, and the coefficient of determination of interaction genotype x measurement effects (c2
gm) was less than 0.64 to 0.66, already
reported in literature (Carias et al., 2014). According to Resende, Valle and Jank (2008), this interaction is problematic in the perennial species breeding, since the performance of progenies among seasons can vary substantially. Therein study this correlation was moderate, suggesting that about 43% of progenies are coincident in all harvests. In general, the ‘Conilon’ coffee clonal cultivars consist of 8 to 20 clones (Ramalho et al., 2016) from superior progenies, giving higher safety to the commercial populations in cross-fertilization and lower percentage of mocha-type grain production, because of gametophytic self-incompatibility. In that case, the mean repeatability of harvests reveals about 20 progenies as the most stable, coming from Rondônia and most (85%) of intermediate and late maturation cycle (data of genotypic values not shown), indicating enough progenies number to compose a clonal cultivar.
The selection of 16 progenies, about 35% of selection, considering the two most productive groups (II and IV) by the Tocher’s method of mean optimization (Table 4), indicated the most stable and adapted genetic materials to the analyzed conditions with genotypic gain of 7.87 bags ha-1 (Table 5). Six
of 14 progenies indicated in the group II (progenies 2, 3, 9, 10, 11 and 21, all with intermediate maturation cycle) are part of the commercial polyclonal variety ‘Conilon BRS Ouro Preto’, indicated for cultivation in the Rondônia State (Ramalho et al., 2014).
The 16 best progenies by the harmonic mean of relative performance of genotypic values method (MHPRVG) provided a yield mean of 41.35 bags ha-1 (groups II and IV),
ranging from 36.27 to 55.86 bags ha-1. The harmonic mean,
in this case, reflects the relationship between productivity and environment. The use of arithmetic mean reflects only the mean yield over evaluation years, thus losing the information about environmental influence. In addition, extreme harvests,
Table 4: Coffee progenies grouping by the modified Tocher’s method based on the harmonic mean of relative performance of genotypic values (MHPRVG) for coffee yield.
Groups I II III IV V
Progenies
1(P) 25 36(L) 2(I) 14(I) 29(L) 4(L) 28
5(L) 26(L) 37(L) 3(I) 15(I) 40 6(I)
-8(L) 27 39(L) 7(P) 17(P) - - -12(L) 30(L) 41 9(I) 20(L) - - -16(L) 31 42(L) 10(I) 21(I) - - -18(I) 32 43(L) 11(I) 22(L) - - -19(L) 33 44(L) 13(P) 38(L) - - -23(I) 34 45(L) - - - - -24 35(L) 46 - - - - -NP 27 14 2 2 1 Mean1 30.17 39.37 23.22 55.23 17.36
Maturation cycle: (P): Precocious; (I): Intermediate; (L): Late. NP: number of progenies. 1bags ha-1.
Table 5: Estimated genotypic values of processed coffee yield (PCB), in bags ha-1, and progeny ranking (Order) for the four
harvests individually analyzed and for the joint analysis, considering adaptability and stability of production by the harmonic mean of relative performance of genotypic values method (MHPRVG), considering about 35% of selection pressure, and grain maturation cycle.
Prog 2009 2010 2012 2013 MHPRVG Cycle2
Order PCB Order PCB Order PCB Order PCB Order PCB
-2 21 14.09 7 55.04 9 20.56 3 69.68 5 42.37 I 3 4 17.02 8 54.53 6 21.05 13 51.77 4 42.62 I 4 1 19.22 2 75.69 2 21.81 2 70.96 2 54.60 L 6 2 18.62 1 86.41 4 21.19 1 73.47 1 55.86 I 7 12 15.38 11 51.99 7 20.91 8 55.67 6 41.11 P 9 13 15.38 3 62.90 3 21.21 10 53.98 3 43.39 I 10 10 15.63 20 47.71 8 20.85 12 52.82 9 39.64 I 11 17 14.72 4 59.93 27 17.79 15 50.52 13 37.42 I 13 19 14.39 13 51.92 10 19.87 25 44.00 15 36.42 P 14 5 16.85 12 51.95 20 18.12 4 62.95 7 40.69 I 15 7 15.86 22 47.31 5 21.16 9 54.03 8 40.27 I 17 15 14.94 19 47.84 31 17.68 6 59.20 14 36.67 P 20 3 17.04 10 53.17 32 17.63 11 53.13 10 38.54 L 21 9 15.64 14 51.26 18 18.33 23 45.32 16 36.27 I 22 25 13.80 15 49.63 11 19.85 7 57.82 11 37.99 L 38 11 15.46 5 57.09 17 18.34 21 47.37 12 37.72 L General mean 14.13 46.20 18.45 45.56 33.48 Selection mean 15.88 56.52 19.77 56.42 41.35 Maximum 19.22 86.41 21.81 73.47 55.86 Minimum 13.80 47.31 17.63 44.00 36.27 SG 1.75 10.32 1.32 10.86 7.87 SG% 12.40 22.34 7.14 23.84 23.51
both high and low yields, would have a greater influence on the calculation, disregarding the information of production stability, since the most stable harvests present harmonic mean close to the arithmetic mean and the most uneven harvests present harmonic mean close to the lowest production values. Thus, this method favors genotypes with values genetically superior and with less variation among harvests (Resende, 2007; Resende; Duarte, 2007).
Considering the individual harvests, the highest gain estimate was obtained in the fourth harvest (23.84%), and the lowest in the third harvest (7.14%). The selection gain represents about 1.5 bags in the smallest harvest and more than 10 bags in the best harvest in the evaluated progenies. Considering the State of Acre’s yield mean of 26 bags ha-1 in
the year 2019 (IBGE, 2019), these values represent up to 40% in the increase of the State productivity mean, emphasizing the importance of cloning these genetic materials and the continuity of the breeding program.
Progenies 4 and 6 of the late and intermediate maturation cycle, respectively, were well ranked in all harvests, showing superiority of production even in the meagrest harvests. Progenies 3, 7, 9, 10 (intermediate cycle, except for the 7 with a precocious cycle) also demonstrated superiority because they were classified among the first 16 genetic materials during the harvests. The other progenies showed good yields throughout the harvests, but with less stability, especially progenies 14, 15, 17, 20, 21 and 22, composing a group with less homogeneous maturation trend compared to the others, with progenies of all maturation cycles. The remaining progenies presented general mean 8.39, 46.59, 10.21 and 50.28 bags ha-1, in 2009, 2010,
2012 and 2013 respectively. These mean values represents about 47% lower in most productive harvests and up to 18% lower in less productive harvests compared to the selected progenies mean. Besides, the most progenies not selected were from Espírito Santo State.
These results show, in general, that progenies from the State of Rondônia boast better performance in the study region, compared to the genetic materials from Espírito Santo, with only one selected progeny. A probable cause of this superiority may be related to the advanced adaptation of genetics materials from Rondônia, a state with climatic characteristics similar to those of State of Acre, whose coffee breeding activities began in the 1990s, when pre-selected ‘Conilon’ coffee plants were cloned for installation of the first clonal tests (Ramalho et al., 2016). In fact, of the best performing progenies indicated, 6 are part of the commercial cultivar ‘Conilon BRS Ouro Preto’, developed through the coffee breeding program of Rondônia State (Ramalho et al., 2014). In Espírito Santo, on the other hand, the first clonal varieties were released in the early 1990s, such as the ‘Emcapa 8111’ evaluated among 1989-1992 and released in 1993, but adapted to the climate of that region (Ferrão et. al., 2007).
These results still characterize simple environmental interaction (Cruz; Regazzi; Carneiro, 2012), as observed by the values of c2
gm and rm, by the relative consistency of
clones superiority in relation to harvests variations, because of bienniality effect, which, although pronounced in arabica coffee, it is also common in canephora coffee (Carias et al., 2014). In this case, the good agreement of classification among harvests shows that selection based on MHPRVG can conduct more refinement in selection based on repeated measures analysis, with minor alterations due to broader genetic control and genotype x environment correlation (Canuto et al., 2016). The genotype control ‘Conilon’-AC had a median yield of 31.34 bags ha-1, and despite being about 20% above the
State of Acre mean, it was ranked 25th among intermediate
performance progenies, which shows good prospects for yields gain with selection. The ‘Apoatã’ variety was not classified among the best performing progenies under the conditions of this experiment.
Because of the low variability observed, especially for development characteristics, subsequent crossbreeding with populations of different origins may benefit selection, especially in long-term strategies (Farias Neto; Resende, 2001). Another strategy could be the progenitor selection within the observed divergent groups, which may benefit new hybrid combinations, increasing the selection probability of superior individuals (Pereira et al., 2013) and enhancing genotypic variability in the selection population in future stages of activities in the State coffee breeding program. In addition, the environmental influence, especially on yield, should be analyzed in order to allow a selection that minimizes its effects, especially of the production bienniality and grain maturation periods (Carias et al., 2014).
4 CONCLUSIONS
There is genetic variability among ‘Conilon’ coffee progenies for processed grain yield, with the possibility of selection gains.
The selected progenies show good relative performance throughout the harvests, but with a tendency to marked production bienniality, environmental influence and intermediate cycle trend, but with selection gain above 20%.
The harmonic mean of relative performance of genotypic values method MHPRVG makes it possible to refine the selection of progenies throughout the seasons, identifying the most adapted and stable ones.
5 ACKNOWLEDGMENTS
The authors would like to thank Consórcio Pesquisa Café and the National Treasury for financial support and the technician Francisco de Sales for their fieldwork.
6 REFERENCES
ACRE. Governo do Estado. Programa Estadual de
Zoneamento Ecológico-Econômico do Acre. Zoneamento
Ecológico-Econômico do Acre-Fase II: Escala
1:250.000. Documento Síntese. 2. ed. Rio Branco, AC, 2010. 358p.
BRANDO, R. et al. Programa de fortalecimento da
cafeicultura do Estado do Acre. Rio Branco: SEPN,
2013, 35p.
CANUTO, D. S. de O. et al. Estabilidade e adaptabilidade em testes de progênies de Myracrocruon urundeuva sob quatro sistemas de plantio. Revista Cerne, 22(2):171-180, 2016.
CARIAS, C. M. O. M. de. et al. Predição de ganhos genéticos via modelos mistos em progênies de café conilon. Coffee
Science, 11(1):39-45, 2016.
CARIAS, C. M. O. M. de. et al. Produtividade de grãos de cafeeiro conilon de diferentes grupos de maturação pelo procedimento REML/BLUP. Semina: Ciências Agrárias, 35(2):707-718, 2014.
CARVALHO, A.; MÔNACO, L. C.; FAZUOLI, L. C. Melhoramento do café. XL - Estudos de progênies e híbridos de café Catuaí. Bragantia, 38(22):202-216, 1979.
CARVALHO, L. C. C. et al. Variabilidade espacial de atributos físicos do solo e características agronômicas da cultura do café. Coffee Sciencie, 8(3):265-275, 2013. CRUZ, C. D. Genes Software - Extended and integrated with the R, Matlab and Selegen. Acta Scientiarum.
Agronomy, 38(4):547-552, 2016.
CRUZ, C. D.; REGAZZI, A. J.; CARNEIRO, P. C. S.
Modelos biométricos aplicados ao melhoramento Genético. 4. ed. Viçosa, MG: UFV, 2012. 514p.
FARIAS NETO, J. T. de.; RESENDE, M. D. V. de. Aplicação da metodologia de modelos mistos (REML/BLUP) na estimação de componentes de variância e precisão de valores genéticos em pupunheira (Bactris gasipaes).
Revista Brasileira de Fruticultura, 23(2):320-324, 2001.
FERRÃO, R. G. et al. Cultivares de Café Conilon. In: FERRÃO, R. G. et al. de. (Eds.). Café Conilon. Vitória, ES: Incaper, 2007. p. 203-225.
FERREIRA, A. D. et al. Desempenho agronômico de seleções de café Bourbon Vermelho e Bourbon Amarelo de diferentes origens. Pesquisa Agropecuária Brasileira, 48(4):388-394, 2013.
GALEANO, E. V.; KROHLING, C. A. Economic viability of arábica coffee in the state of Espírito Santo considering manual and semi-mechanized harvest. Coffee Science, 14(2):223-230, 2019.
INSTITUTO BRASILEIRO DE GEOGRAFIA E
ESTATÍSTICA - IBGE. Levantamento Sistemático da
Produção Agrícola (LSPA). Available in: <https://sidra.
ibge.gov.br/home/lspa/brasil>. Access in: August, 28, 2019. PEDRO, F. C. et al. Comportamento agronômico de
progênies F4 de cafeeiros oriundos do cruzamento entre os cultivares Mundo Novo e Catuaí. Revista Ceres, 58(3):315-322, 2011.
PEREIRA, A. A. et al. Descrição do crescimento vegetativo do caffeiro cultivar Rubi MG 1192, utilizando modelos de regressão. Coffee Science, 9(2):266-274, 2014.
PEREIRA, T. B. et al. Eficiência da seleção de progênies de café F4 pela metodologia de modelos mistos (REML/ BLUP). Bragantia, 72(3):230-236, 2013.
PREZOTTI, L. C. et al. Calagem e adubação. In: FERRÃO, R. G. et al. Café Conilon. Vitória, ES: Incaper, 2007. p.330-343.
RAMALHO, A. R. et al. Progresso genético da produtividade de café beneficiado com a seleção de clones de cafeeiro ‘Conilon’. Revista Ciência Agronômica, 47(3):516-523, 2016.
RAMALHO, A. R. et al. Cultivar de cafeeiro Conilon
BRS Ouro Preto – Características agronômicas e
agroindustriais. Porto Velho: Embrapa Rondônia, 2014. 10 p. (Comunicado técnico, 396).
RESENDE, M. D. V. de; DUARTE, J. B. Precisão e controle de qualidade em experimentos de avaliação de cultivares.
Pesquisa Agropecuária Tropical, 37(3):182-194, 2007.
RESENDE, M. D. V. de. Genética biométrica e estatística
no melhoramento de plantas perenes. Brasília, DF:
Embrapa Informação Tecnológica, 2002. 975p. RESENDE, M. D. V. de. Matemática e estatística na
análise de experimentos e no melhoramento genético.
Colombo: Embrapa Florestas, 2007. 362p.
RESENDE, M. de. V. de. et al. Estimativas de parâmetros genéticos e predição de valores genotípicos no melhoramento do cafeeiro pelo procedimento REML/ BLUP. Bragantia, 60(3):185-193, 2001.
RESENDE, M. D. V. de. Software Selegen-REML/BLUP: A useful tool for plant breeding. Crop Breeding and
RESENDE, R. M. S.; VALLE, C. B. do; JANK. L.
Melhoramento de forrageiras tropicais. Campo Grande:
Embrapa Gado de Corte, 2008. 293p.
ROCHA, R. B. et al. Melhoramento de Coffea canephora: Considerações e metodologias. In: MARCOLAN, L. A.; ESPINDULA, M. C. (Eds.). Café na Amazônia. Brasília, DF: Embrapa, 2015. p.101-1126.
RODRIGUES, R. R. et al. Crescimento inicial do caffeiro conilon sob déficit hídrico no solo. Coffee Science, 11(1):33-38, 2016.
SILVA, F. L. da et al. Variabilidade genética entre genótipos de café robusta no Estado de Minas Gerais. Coffee
Science, 10(1):20-27, 2015a.
SILVA, F. L. da et al. Seleção de clones de café robusta com potencial produtivo para a Zona da Mata mineira. Coffee
Science, 10(4):464-474, 2015b.
SOUZA, C. A. de et al. Componentes genéticos do desenvolvimento e maturação de frutos de Coffea canephora Pierre ex. A. Froehner. Coffee Science, 12(3):355-364, 2017.