Amorphization of Graphite Flakes in Gray Cast Iron Under Tribological Load
Ruth Hinrichsa* , Marcos Antonio Zen Vasconcellosb, Werner Österlec, Claudia Prietzelc
Received: November 10, 2017; Revised: February 09, 2018; Accepted: April 14, 2018
A gray cast iron disc, which had been submitted to a heavy duty automotive brake test, was
examined with energy filtered transmission electron microscopy. A graphite flake in a convenient angular position showed the shear interaction of graphite layers with the iron matrix in nano-scale resolution.
Atomic layers of graphite were wedged into the ferritic bulk, allowing the entrance of oxygen and
the subsequent formation of magnetite. The exfoliated few-layer graphene batches deformed heavily when forced into the matrix. When Raman spectra from the disc surface, which show distinctive
carbonaceous bands, were compared with Raman spectra from graphite subjected to deformation in
a shaker mill with different milling times, it could be seen that the shear stress on the brake surface was much more effective to induce disorder than the milling, where compressive and impact forces had been additionally exerted on the sample. During shear load the high anisotropy of elastic modulus
in the graphite crystalline structure and the low adhesion between graphite basal planes allowed the exfoliation of wrinkled few-layer grapheme batches, causing the formation of more defect related
Raman bands than the mechanical stress during high-energy milling.
Keywords: Graphite, Shear load, Amorphization, EFTEM, Raman spectroscopy.
*e-mail: [email protected]
1. Introduction
Transmission electron microscopy (TEM) is an invaluable tool to visualize nano-scale mechanisms. However the effects of some mechanisms are rarely seen, because there
has to occur a fortunate combination of circumstances
to bring them into the diminutive field of view of the TEM. This was the case when we were able to observe a graphite flake inside a gray cast iron brake disc after shear stress, which had wedged off iron particles from the
matrix, a mechanism, that allowed oxygen to percolate the cracks, forming nano-scale particles of magnetite1.
In the present paper we report on further studies centered
on the deformation of the graphite flake. The fact that the (002) planes of graphite are almost as hard as diamond2,3
is seldom perceived in macroscopic tasks, except e.g.
when massive graphite work pieces are machined4, where
the cutting tools wear off at an extremely high rate. Only
diamond tools are able to withstand the machining of graphite without considerable wear5.
When machining gray cast iron, which contains randomly oriented graphite flakes, the shearing force of the tool on
the work piece removes the graphite chips together with the
iron. However when shearing forces are applied by a large
counterface rather than a sharp cutting tool, as is the case in tribological applications, macroscopic chipping is prevented
and replaced by other deformation mechanisms. In this work
we report on nanoscale deformation of graphite flakes under
shear load, as occurs between the brake pads and gray cast iron brake discs of automobiles during heavy duty braking, and compare it to the deformation that occurs during high
energy ball milling. In brake tribo-layers a microstructure
of interlayered distorted graphite and magnetite is formed, involving mechanical action and chemical reactions6,7. In
this work we focus on the effects of shearing forces applied
on graphite during braking, where the shear is applied to a graphite particle anchored in the matrix, and compare their
effect to the alterations that are induced by a shaker mill on
loose graphite particles, where impact, compression, and shear are the deformation agents8. For this purpose Raman
spectroscopy, which is sensitive to structural ordering of carbonaceous material9-11 was used to compare graphite
from the friction film with graphite that had been milled for different milling times.
2. Materials and Methods
A friction couple consisting of a commercial polymer
matrix composite (PMC) brake pad and a gray cast iron
disc was evaluated with a general performance friction
test in a full scale bench dynamometer (AK Master, SAE J2522)12, simulating real vehicle conditions to test the
brake effectiveness.
aInstituto de Geociências, Universidade Federal do Rio Grande do Sul, Porto Alegre, RS, Brasil
bInstituto de Física, Universidade Federal do Rio Grande do Sul, Porto Alegre, RS, Brasil
Graphite powder was submitted to impact in a shaker
mill (SPEX Certi prep 8000 Mixer/Mill® High-Energy Ball
Mill) loaded with commercially pure graphite and 8 mm cast iron spheres for different milling times (30 min, 1 h 45 min, 3 h 30 min, 7 h 30 min).
The surface of the cast iron disc before and after the
friction test and the milled graphite were examined with micro-Raman spectroscopy in a lab assembled spectrometer described elsewhere13. The 633 nm line of a He-Ne laser
was used for excitation. An objective x50 was used both
to focus the incident laser beam onto a spot with diameter
about 1 µm and to collect the scattered light. Special care was taken to avoid thermal damage at the laser spot. The
spectrometer was calibrated using a diamond standard
(Raman peak at 1332 cm-1) and spectra were obtained in a
broad range (200-1800 cm-1). The spectra were fitted with
five Gaussian functions using a Levenberg-Marquardt least square fitting algorithm.
Electron micrographs and X-ray maps were obtained with a dual beam scanning electron microscope (JEOL JIB 4500), equipped with an X-ray detector (SDD Thermo Fisher Scientific).
The TEM lamella was micro-machined from the gray
cast iron disc surface using 30 keV Ga ions in a focused ion
beam FIB instrument (FEI Strata 200xP). The TEM sample was soldered to an Omniprobe holder and examined in a 200 kV EFTEM (Jeol JEM2200FS), equipped with a field emission gun and Ω-filter.
3. Results and Discussion
Fig.1a shows a backscattered electron image (BEI) of the disc surface after the AK-Master friction test. The graphite flakes and the ferritic matrix are partially covered with a dark gray magnetite film. Light gray areas are exposed iron, bright dots correspond to either tin sulfide or barium sulfate that were transferred from the PMC-pad. The composite map in Fig. 1b shows that a significant area of the iron (red) is now associated with oxygen (cyan). Only few graphite flakes (green) appear on the surface, however in the whole magnetite area (salmon colored), small amounts of carbon were detected.
Most carbonaceous material have strong Raman scattering
cross sections and the spectra of graphitic material present
two prominent features: the "G band", due to symmetric E2g
vibrations of the carbon rings in plane of the graphite sheets,
and the "D band", due to the A1g breathing mode, allowed
only at the broken borders of the graphite planes. The D
band becomes more intense with increasing crystallographic disorder14,15. The apparent simplicity of carbon spectra,
however, is misleading15. According to Sadezky et al.16
Raman spectra of soot and related carbonaceous material are
due to five vibrational modes that can be adjusted with five Gaussian or Lorentzian curves. Besides the G and D bands
they included three additional vibrations due to disorder in
the crystal lattice: the D2 vibration, at 1610 cm-1, related to
disorder inside the graphite planes, the D3 vibration, centered
around 1500 cm-1, due to the presence of amorphous carbon,
and the D4 band, centered around 1200 cm-1, attributed
to ionic impurities. A high G/D Raman band area ratio is
indicative of highly crystalline material, while increasingly
smaller ratios indicate increasing disorder in the structure. In Fig. 2a the micro-Raman spectrum taken on a graphite flake of the pristine disc (black spectrum) reveals the characteristic G and D bands attributed to crystalline graphite. The gray spectrum in Fig. 2a was obtained on thinly smeared out graphite on the iron matrix. In Fig. 2b the
black spectrum was taken on a friction plateau of the tested
disc, the gray one was obtained between friction plateaus. Both spectra present G and D bands of strongly disordered graphite, with much broader peaks and a lower G/D band ratio than the graphite in the pristine disc.
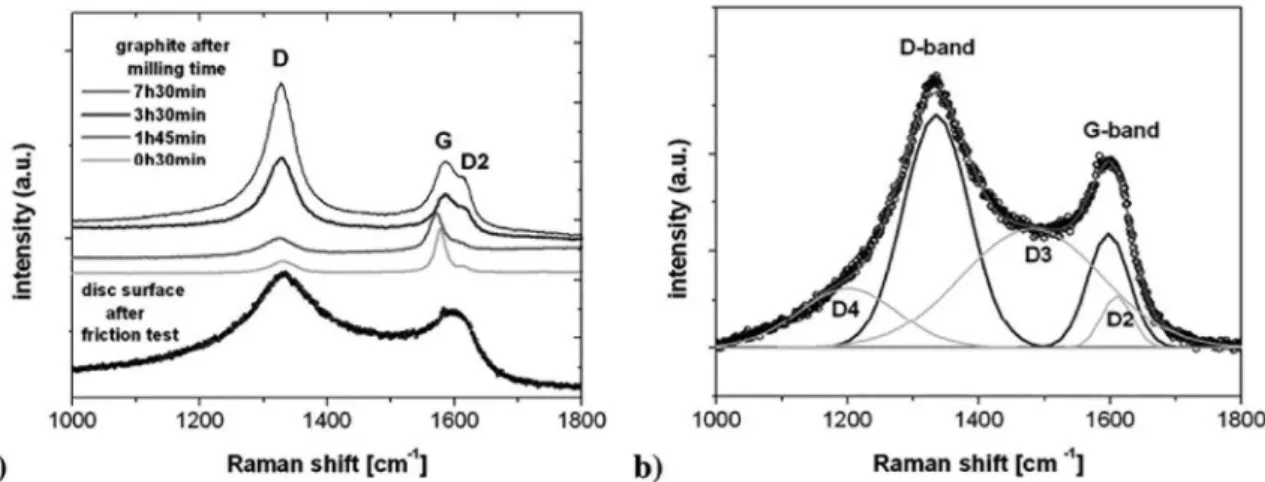
To be able to estimate the disordering of graphite due
to macroscopic mechanical action, crystalline graphite was
milled for different time intervals in a shaker mill with cast iron spheres. The Raman spectra obtained from these samples (Fig. 3a) were consistent with data from literature17,18. Five
Gaussian bands (G, D, D2, D3, and D4) were fitted into the spectra, and the fit of a spectrum of the carbonaceous material present on the disc surface is shown in Fig. 3b.
When the ratios of G/D band areas of the spectra mentioned above are compared (Table 1), it can be seen that
it takes almost 8 hours of milling to reach the disorder that
is achieved in a few minutes of the friction test.
The carbon on the disc surface had much broader G and D bands and showed the presence of more deformation
bands then the milled graphite, even after many hours of
milling time. Even though high energy ball milling produces
impact, compression, and shear forces on the sample, the Raman spectra from braking discs after friction tests show
that the braking is more effective than ball milling to induce disorder in graphite. Raman spectroscopy is a very sensitive
technique to estimate the disorder of graphite15, which is
difficult to observe with X-ray diffraction, because the main
002 graphite peak disappears after short milling times, while
in the HR-TEM the crystal planes are still discernible19,20.
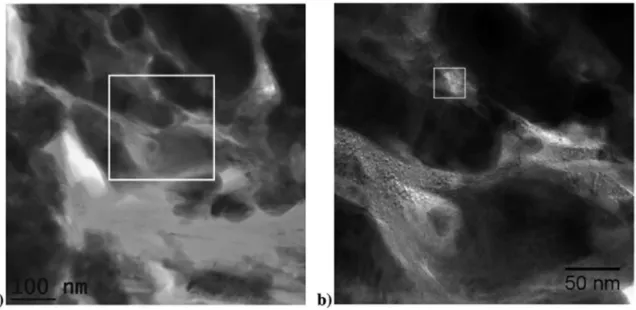
The high resolution EFTEM images of a cross section of
the disc surface help to elucidate the nano-scale mechanisms
that occur in the graphite flake. An overview micrograph of the boundary between graphite and iron is shown in Fig. 4a. The light gray ribbon-like structures are graphite, the massive
dark gray grains are iron, while the blotchy gray grains are
magnetite. A lamellar batch of graphite is terminated in a thickened region next to a crack and to magnetite grains.
The zero-loss EFTEM micrograph in Fig. 4a shows thin
graphite crystals being forced apart due to the friction stress, and few-layer graphene batches wedged into the iron bulk,
Figure 1. a) BEI of disc surface after the AK-Master friction test. Dark gray surface film is magnetite. Light gray areas are exposed iron,
bright spots correspond to tin sulphide or barium sulphate. b) Composite X-ray map of the same area (graphite: green, iron: red, oxygen: cyan, Fe+O results salmon colored); scale bar is 2 µm.
Figure 2. Micro-Raman spectra a) from graphite flakes of the pristine disc; b) after the AK-master test. Magnetite and graphite G and
D bands are indicated.
Figure 3. a) Micro-Raman spectra from graphite milled in shaker mill for different times (indicated) and spectrum from the disc surface
after the AK-master friction test; b) Fitting of the Raman spectrum of carbonaceous material from the disc surface with five Gaussian bands.
grains are anchored in a matrix, they cannot orient their
basal planes parallel to the direction of shear stress, as e.g.
in friction tests, where graphite powder is used as lubricant21.
When the graphite crystals are immobilized and unable to
reorient, they can be forced into the metallic matrix due to
Table 1. Raman band area ratios: G/D and G/(D+D2+D3+D4)
Sample G/D G/(D+D2+D3+D4)
Graphite from pristine disc 0.89 0.76
Graphite from used disc 0.58 0.28
Milled graphite (30 min) 1.60 1.19
Milled graphite (1h 45 min) 1.09 0.87
Milled graphite (3h 30 min) 0.71 0.26
Milled graphite (7h 30 min) 0.60 0.21
Figure 4. EFTEM images showing a thin graphite lamella between magnetite and iron grains at the boundary between the graphite flake
and the iron matrix; a) overview; b) higher magnification of the area of the white square in (a). The small white square in (b) indicates where the high resolution image (Fig. 5a) was made.
Figure 5. a) High resolution EFTEM micrograph of graphite next to magnetite grains. SAED pattern inset (from the area of the small
white square in Fig. 4a); b) Inverse fast Fourier transform (FFT) reconstructed from the graphite spots, showing that planes are crumpled. Same scale for both images.
The region of the white square in Fig. 4b was magnified as high resolution EFTEM image in Fig. 5a and a selected area electron diffraction (SAED) pattern was obtained (inset in Fig. 5a).
The blurry oval spots (white vertical arrow on the inset in Fig. 5a) are consistent with the diffraction of the 002
graphite plane, and demonstrate the disordered nature of
on this image, resulting in a pattern similar to the SAED pattern. The FFT contains all the periodic information of the image, and an inverse FFT will reconstruct the original image. When masking tools are applied to the FFT of the
image, it is possible to reconstruct the image that is due to
certain spots of the FFT. So the inverse FFT of the graphite diffraction spots allowed to reconstruct the image of the graphitic phase, shown in Fig. 5b. The graphite planes have
the correct mean inter-planar distance, however they are not
flat, but crumpled into a highly disordered structure.
4. Conclusions
The amount of disorder induced by a few minutes of a
friction test that simulates braking conditions was compared to the disorder generated in crystalline graphite subjected
to different milling times in a high energy shaker mill. The disorder was assessed using graphite Raman spectra,
comparing the area ratio of the G band to the disorder related
D band. It was shown that G/D band ratio of the used disc
was comparable to the amorphization induced by 8 h of
high energy milling. TEM images and their FFT analyses showed that during braking the graphite flakes of the brake
disc became heavily disordered, with exfoliation of wrinkeled
few-layer graphene batches. EFTEM captured the process
of graphite exfoliation, revealing that magnetite formation
is fostered by the differences in elastic moduli of iron and graphite. The high modulus of graphite along the basal
planes causes few-layer graphite batches to penetrate the
iron bulk, peeling off iron nano-particles. The low adhesion
between graphite basal planes allows the exfoliation of few-layer batches that are further wedged apart by minute iron
or magnetite particles. This mechanism explains the fast
amorphization of graphite during braking and the formation
of nano-scale magnetite in friction films.
5. Acknowledgements
RH thanks Alexander von Humboldt Foundation for a research period in Berlin, MAZV acknowledges financial support from Brazilian agencies Finep and CNPq. CP and WO acknowledge financial support from German Research Foundation (DFG), project No. OS 77/14-1.
6. References
1. Hinrichs R, Vasconcellos MAZ, Öesterle W, Prietzel C. A TEM snapshot of magnetite formation in brakes: The role of the disc's cast iron graphite lamellae in third body formation. Wear. 2011;270(5-6):365-370.
2. Lee C, Wei X, Kysar JW, Hone K. Measurement of the Elastic Properties and Intrinsic Strength of Monolayer Graphene. Science. 2008;321(5887):385-388.
3. Gao Y, Cao T, Cellini F, Berger C, de Heer WA, Tosatti E, et al. Ultrahard carbon film from epitaxial two-layer graphene. Nature Nanotechnology. 2018;13:133-138.
4. Cabral G, Gäbler J, Lindner J, Grácio J, Polini R. A study of diamond film deposition on WC-Co inserts for graphite machining: Effectiveness of SiC interlayers prepared by HFCVD. Diamond and Related Materials. 2008;17(6):1008-1014.
5. Schroeter RB, Kratochvil R, Gomes JO. High-speed finishing milling of industrial graphite electrodes. Journal of Materials Processing Technology. 2006;179(1-3):128-132.
6. Österle W, Prietzel C, Dmitriev AI. Investigation of surface film nanostructure and assessment of its impact on friction force stabilization during automotive braking. International Journal of Materials Research. 2010;101(5):669-675.
7. Österle W, Dörfel I, Prietzel C, Rooch H, Cristol-Bulthé AL, Degallaix G, et al. A comprehensive microscopic study of
third body formation at the interface between a brake pad and
brake disc during the final stage of a pin-on-disc test. Wear. 2009;267(5-8):781-788.
8. Baláž P. High Energy Milling. In: Baláž P. Mechanochemistry in Nanoscience and Minerals Engineering. Berlin: Springer-Verlag; 2008. p. 103-132.
9. Rodrigues S, Marques M, Suárez-Ruiz I, Camean I, Flores D, Kwiecinska B. Microstructural investigations of natural and synthetic graphites and semi-graphites. International Journal of Coal Geology. 2013;111:67-79.
10. Barzoi SC. Shear stress in the graphitization of carbonaceous
matter during the low-grade metamorphism from the northern
Parang Mountains (South Carpathians) - Implications to graphite geothermometry. International Journal of Coal Geology. 2015;146:179-187.
11. Nakamura Y, Oohashi K, Toyoshima T, Satish-Kumar M, Akai J. Strain-induced amorphization of graphite in fault zones of the Hidaka metamorphic belt, Hokkaido, Japan. Journal of Structural Geology. 2015;72:142-161.
12. Agudelo CE, Ferro E. Technical overview of brake performance testing for Original Equipment and Aftermarket industries in the US and European markets. Link Technical Report Fev 205-1. 27 p.
13. Schmidt JS, Hinrichs R, Araujo CV. Maturity estimation of phytoclasts in strew mounts by micro-Raman spectroscopy. International Journal of Coal Geology. 2017;173:1-8. 14. Yoshida A, Kaburagi Y, Hishiyama Y. Full width at half maximum
intensity of the G band in the first order Raman spectrum of carbon material as a parameter for graphitization. Carbon. 2006;44(11):2333-2335.
15. Ferrari AC. Raman spectroscopy of graphene and graphite: Disorder, electron-phonon coupling, doping and nonadiabatic effects. Solid State Communication. 2007;143(1-2):47-57. 16. Sadezky A, Muckenhuber H, Grothe H, Niessner R, Pöschl U.
Raman microspectroscopy of soot and related carbonaceous
17. Shen TD, Ge WQ, Wang KY, Quan MX, Wang JT, Wei WD, et al. Structural disorder and phase transformation in graphite produced by ball milling. Nanostructured Materials. 1996;7(4):393-399.
18. Kumar GR, Jayasankar K, Das SK, Dash T, Dash A, Jena BK, et al. Shear-force-dominated dual-drive planetary ball milling for the
scalable production of graphene and its electrocatalytic application
with Pd nanostructures. RSC Advances. 2016;6(24):20067-20073.
19. Österle W, Orts-Gil G, Gross T, Deutsch C, Hinrichs R, Vasconcellos MAZ, et al. Impact of high energy ball milling on
the nanostructure of magnetite-graphite and
magnetite-graphite-molybdenum disulphide blends. Materials Characterization. 2013;86:28-38.
20. Häusler I, Dörfel I, Peplinski B, Dietrich PM, Unger WES, Österle W. Comprehensive characterization of ball-milled powders simulating a tribofilm system. Materials Characterization. 2016;111:183-192.