Dissertation
Master in Building Construction
Ductility Considerations in Seismic Design of
Reinforced Concrete Building
Mahmoud Helal SaadEldin Elawady
Dissertation
Master in Building Construction
Ductility Considerations in Seismic Design of
Reinforced Concrete Building
Mahmoud Helal SaadEldin Elawady
Dissertation developed under the supervision of Hugo Rodrigues, adjunt professor at the School of Technology and Management of the Polytechnic Institute of Leiria.
ii
iii
Dedication
I dedicate this thesis to the soul my parents; who were always supporting me during whole my life, they were a sample for giveness and the sacrifice trying to give me have a better future, they were alawys take care of my furture and encourage me so much to study and learn more as much as it is possible, they had a stong believe in me, they make me believe in myself. I know they already passed away, but they are with me in each step in my life to support me, and they are happy for me.
iv
v
Acknowledgements
I would like to express my gratitude to my supervisor Professor Hugo Rodrigues for believing in me and for providing me with invaluable advice throughout the duration of this research. I am also thankful to him for his patient and constructive reviews of the thesis.
I would also like to thank all my professors during the whole master course for their advices and their motivation.
I would like to express my sincerest thanks to all my family and my friends for their encouragement, belief in me and for their good spirit. You all deserve the best!
vi
vii
Resumo (in Portuguese)
Este estudo foi realizado por form a avaliar os métodos propostos pela norma sísmica europeia, a fim de verificar as vantagens da aplicação de diferentes classes de ductilidade no dimensionamento sísmico de edifícios de betão armado. Assim, foi dimensionaod um edifício de betão armado de acordo com o prescrito no Eurocódigo 8 para as diferentes classes de ductilidade, e o final foi avaliada a sua performance sísmica de acordo com uma análise pushover, de acordo com o EC8. Considerou-se que o edifício em estudo está localizado em diferentes zonas de perigo sísmico (perigo baixo, médio e alto) no continente de Portugal, sujeitas a cargas horizontais defenidas no código documento de aplicação nacional de acompanha o Eurocode 8.
Há uma recomendação estrita do código sísmico europeu (Eurocódigo 8) (EN 1998-1, 2004), para considerar uma das três classes de ductilidade mencionadas no Eurocódigo 8, classe baixa de ductilidade DC L, classe média de ductilidade DC M e alta classe de ductilidade DC H, o Eurocode 8 explica detalhadamente as regras para projetar a estrutura para a classe de dutilidade de três, no entanto, não é claro para o designer selecionar a classe de ductilidade adequada para que a estrutura tenha alcançado o maior desempenho da estrutura do edifício durante o terremoto com menos danos e custos econômicos.
A análise estática não-linear de empuxo, usada para avaliar o desenho dos quadros para três classes de ductilidade em diferentes zonas sísmicas, os resultados da avaliação mostram que, Ducility classe média DC M, têm um alto desempenho próximo a Ductility classe alta DC H, mesmo no alto as zonas sísmicas de perigo e os custos para DC M estão próximos de DC H, poderia ser menor se a mão-de-obra for incluída, porque a DC H custará mais pela mão-de-obra de acordo com a complexidade dos detalhes.
viii
Palavras-chave:
Dimensionamento sísmico, ductilidade, avaliação do comportamento sísmico, pushover
ix
x
Abstract
This study is conducted to review the methods proposed by European national seismic codes in order to incorporate the concept of ductility of structural elements. In order to assess how to take in account the ductility class of a reinforced concrete building which is prescribed in Eurocode 8 and its influence in the structural design of the building, the structures are analysed with Sap2000 software for their responses to lateral loading by applying the static non linear push-over analysis. These structures are assumed to be located in different seismic hazard zones (Low, Medium and High hazard) in the mainland of Portugal, subjected to horizontal loads deducted from the European seismic code and designed using Eurocode 8.
There a strict recommendation from the European seismic code (Eurocode 8) (EN 1998-1, 2004), to consider one of three ductility classes mentioned in Eurocode 8, ductility class low DC L, ductility class medium DC M, and ductility class high DC H, Eurocode 8 explaines in details the rules to design the structure for the the three ductility class, however it is not clear for the designer to select the suitable ductility class for the structure to have achieve the highest performance of building structure during the earthquake with less damages and economic cost.
Nonlinear pushover static analysis, used to assess the design of the frames for three ductility classes in different seismic zones, the assessment results show that, Ducility class medium DC M, have a high performance near to Ductility class high DC H, even in the high hazard seismic zones, and the costs for DC M are close for DC H, could be less, if the workmanship is included, because DC H will cost more for the workmanship according to its complexity of the detailing.
xi Keywords:
xii
xiii
List of figures
FIGURE 2.1 SWAY MECHANISMS IN LATERALLY LOADED MULTISTOREY FRAMES.(PAULAY, 1983) ... 5
FIGURE 2.2 DUCTILITY STRAIN. ... 6
FIGURE 2.3 DUCTILITY CURVATURE. ... 7
FIGURE 2.4 DUCTILITY ROTATION. ... 7
FIGURE 2.5 DUCTILITY DISPLACEMENT. ... 7
FIGURE 2.6 TYPES OF JOINTS IN A MOMENT RESISTING FRAME(UMA, 2015) ... 8
FIGURE 2.7 EXTERIOR AND INTERIOR BEAM-COLUMN JOIN T SUBASSEMBLIES OF A DUCTILE MOMENT RESISTING FRAME SUBJECTED TO LATERAL LOADS.(PAK AND CHEUNG, 1991) ... 9
FIGURE 2.8 THE DEFLECTED SHAPE OF AN INELASTIC FRAME UNDER EARTHQUAKE ATTACK.(PAK AND CHEUNG, 1991) ... 10
FIGURE 2. 9 HISTORICAL SEISMICITY (1300–1960) AND INSTRUMENTAL SEISMICITY (1961–2014, IPMA DATABASE) WITH THE ASSOCIATED QUALITY FACTOR (QF), USING THE MODIFIED MERCALI INTENSITY (MMI) SCALE. (FERRÃO ET AL., 2016) ... 13
FIGURE 2.10 MAINLAND PORTUGAL HAZARD MAPS FOR A EXCEEDANCE PROBABILITY OF 10% IN 50 YEARS (CAMPOS COSTA, SOUSA AND CARVALHO, 2008). ... 14
FIGURE 2.11 MAINLAND PORTUGAL SEISMIC ZONATION FOR PORTUGUESE NATIONAL ANNEX OF NP EN 1998-1 (CAMPOS COSTA, SOUSA AND CARVALHO, 2008) ... 15
FIGURE 3.1 COMPARISON OF REDUCTION/BEHAVIOR FACTORS RECOMMENDED IN DIFFERENT NATIONAL CODES (KHOSE, SINGH AND LANG, 2012). ... 21
FIGURE 3.2 COMPARISON OF DUCTILITY CLASSES AND THEIR BEHAVIOUR FACTORS... 21
FIGURE 3.3 DIRECTION OF ACTION OF COLUMN AND BEAM MOMENT RESISTANCES AROUND A JOINT IN THE CAPACITY DESIGN CHECK OF THE COLUMN FOR BOTH DIRECTIONS OF THE RESPONSE TO THE SEISMIC ACTION. ... 28
FIGURE 3.4 DIMENSIONING OF REINFORCEMENT IN COLUMN SECTION FOR BIAXIAL MOMENTS WITH AXIAL FORCE. ... 31
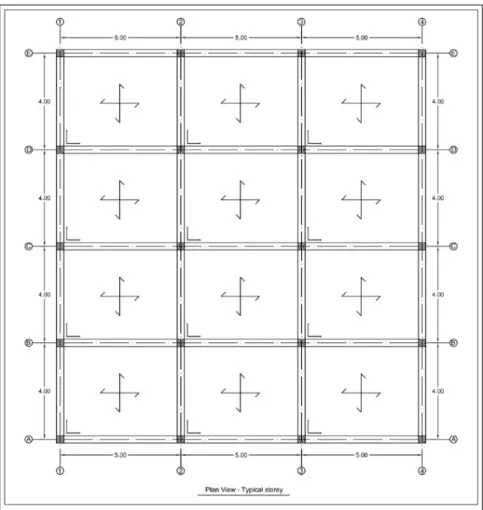
FIGURE 4.1 PLAN VIEW SHOWING AXIS, COLUMNS AND BEAMS OF THE BUILDING WITH THE DIMENSIONS. ... 40
FIGURE 4.2 ELEVATION VIEW OF THE BUILDING SHOWING THE FRAMES IN X DIRECTION ... 40
FIGURE 4.3 ELEVATION VIEW FOR THE BUILDING SHOWING THE FRAMES IN X DIRECTION... 40
FIGURE 4.4 HAZARD SEISMIC ZONES ... 41
xiv
FIGURE 5 1 THE SELECTED RC FRAME FOR THE DESIGN , AXIS C-C ... 45 FIGURE 5.2 DEAILED LAYOUT DESIGN OF COLUMNS AND BEAMS OF RC FRAME FOR DC L IN SEISMIC ZONE
1.1 ... 54 FIGURE 5.3 DEAILED LAYOUT DESIGN OF COLUMNS AND BEAMS OF RC FRAME FOR DC M IN SEISMIC ZONE 1.1 ... 55 FIGURE 5.4 DEAILED LAYOUT DESIGN OF COLUMNS AND BEAMS OF RC FRAME FOR DC H IN SEISMIC ZONE
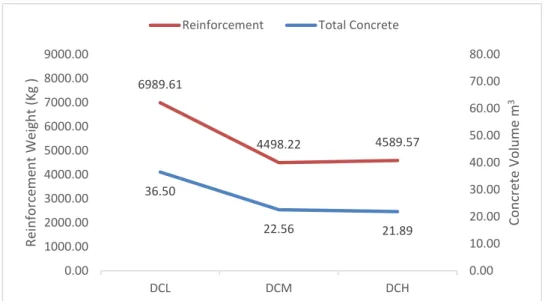
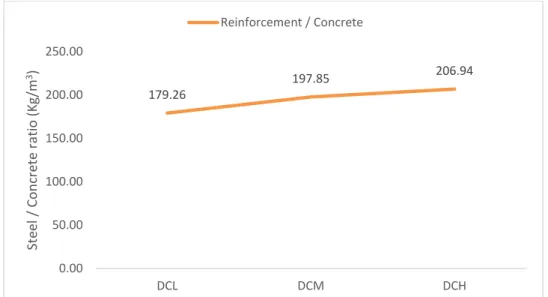
1.1 ... 56 FIGURE 5.5 TOTAL CONCRETE AND REINFORCEMENT QUANTITES FOR DC L, D M AND DC H FRAMES IN
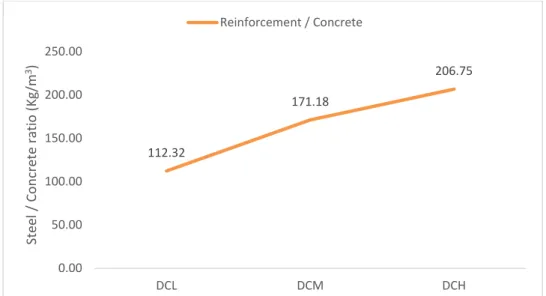
SEISMIC ZONE 1.1 ... 57 FIGURE 5.6 REINFORCEMENT / CONCRETE RATIO (KG/M3) FOR DC L, D M AND DC H FRAMES IN SEISMIC
ZONE 1.1 ... 57 FIGURE 5.7 TOTAL CONCRETE AND REINFORCEMENT QUANTITES FOR DC L, D M AND DC H FRAMES IN
SEISMIC ZONE 1.2 ... 58 FIGURE 5.8 REINFORCEMENT / CONCRETE RATIO (KG/M3) FOR DC L, D M AND DC H FRAMES IN SEISMIC
ZONE 1.2 ... 58 FIGURE 5.9 TOTAL CONCRETE AND REINFORCEMENT QUANTITES FOR DC L, D M AND DC H FRAMES IN
SEISMIC ZONE 1.3 ... 59 FIGURE 5.10 REINFORCEMENT / CONCRETE RATIO (KG/M3) FOR DC L, D M AND DC H FRAMES IN SEISMIC
ZONE 1.3 ... 59 FIGURE 5.11 TOTAL CONCRETE AND REINFORCEMENT QUANTITES FOR DC L, D M AND DC H FRAMES IN
SEISMIC ZONE 1.4 ... 60 FIGURE 5.12 REINFORCEMENT / CONCRETE RATIO (KG/M3) FOR DC L, D M AND DC H FRAMES IN SEISMIC
ZONE 1.4 ... 60 FIGURE 5.13 TOTAL CONCRETE AND REINFORCEMENT QUANTITES FOR DC L, D M AND DC H FRAMES IN
SEISMIC ZONE 1.5 ... 61 FIGURE 5.14 REINFORCEMENT / CONCRETE RATIO (KG/M3) FOR DC L, D M AND DC H FRAMES IN SEISMIC
ZONE 1.5 ... 61 FIGURE 5.15 TOTAL CONCRETE AND REINFORCEMENT QUANTITES FOR DC L, D M AND DC H FRAMES IN
SEISMIC ZONE 2.3 ... 62 FIGURE 5.16 REINFORCEMENT / CONCRETE RATIO (KG/M3) FOR DC L, D M AND DC H FRAMES IN SEISMIC
ZONE 2.3 ... 62 FIGURE 5.17 TOTAL CONCRETE AND REINFORCEMENT QUANTITES FOR DC L, D M AND DC H FRAMES IN
SEISMIC ZONE 2.4 ... 63 FIGURE 5.18 REINFORCEMENT / CONCRETE RATIO (KG/M3) FOR DC L, D M AND DC H FRAMES IN SEISMIC
ZONE 2.4 ... 63 FIGURE 5 19 TOTAL CONCRETE AND REINFORCEMENT QUANTITES FOR DC L, D M AND DC H FRAMES IN
xv
FIGURE 5.20 REINFORCEMENT / CONCRETE RATIO (KG/M3) FOR DC L, D M AND DC H FRAMES IN SEISMIC
ZONE 2.4 ... 64
FIGURE 5.21 TOTAL REQUIRED CONCRETE (M3) FOR DC L, DC M AND DC H FRAMES FOR SESIMIC ZONES TYPE 1 ... 65
FIGURE 5.22 TOTAL REQUIRED REINFORCEMENT (KG) FOR DC L, DC M AND DC H FRAMES FOR SESIMIC ZONES TYPE 1 ... 65
FIGURE 5.23 TOTAL REQUIRED CONCRETE (M3) FOR DC L, DC M AND DC H FRAMES FOR SESIMIC ZONES TYPE 2 ... 66
FIGURE 5.24 TOTAL REQUIRED REINFORCEMENT (KG) FOR DC L, DC M AND DC H FRAMES FOR SESIMIC ZONES TYPE 1 ... 66
FIGURE 5 25 TOTAL MATERIAL COSTS FOR DC L, DC M AND DC H FRAMES IN SEISMIC ZONE 1.1 ... 67
FIGURE 5 26 TOTAL MATERIAL COSTS FOR DC L, DC M AND DC H FRAMES IN SEISMIC ZONE 1.2 ... 67
FIGURE 5 27 TOTAL MATERIAL COSTS FOR DC L, DC M AND DC H FRAMES IN SEISMIC ZONE 1.3 ... 68
FIGURE 5 28 TOTAL MATERIAL COSTS FOR DC L, DC M AND DC H FRAMES IN SEISMIC ZONE 1.4 ... 68
FIGURE 5 29 TOTAL MATERIAL COSTS FOR DC L, DC M AND DC H FRAMES IN SEISMIC ZONE 1.5 ... 69
FIGURE 5 30 TOTAL MATERIAL COSTS FOR DC L, DC M AND DC H FRAMES IN SEISMIC ZONE 2.3 ... 69
FIGURE 5 31 TOTAL MATERIAL COSTS FOR DC L, DC M AND DC H FRAMES IN SEISMIC ZONE 2.4 ... 70
FIGURE 5 32 TOTAL MATERIAL COSTS FOR DC L, DC M AND DC H FRAMES IN SEISMIC ZONE 2.5 ... 70
FIGURE 5 33 COMPARISON BETWEEN TOTAL FRAME COST FOR DC L, DC M AND DC H IN DIFFERENT SEISMIC ZONES ... 71
FIGURE 6.1 STRUCTURE DATA (FAJFAR AND GAŠPERŠIČ, 1996) ... 79
FIGURE 6.2 NONLINEAR STATIC PUSHOVER ANALYSIS OF MDOF (FAJFAR AND GAŠPERŠIČ, 1996) ... 79
FIGURE 6.3 EQUIVALENT SDOF MODEL (FAJFAR AND GAŠPERŠIČ, 1996) ... 80
FIGURE 6.4 PUSHOVER CAPACITY CURVES FOR DC L, DC M AND DC H OF SEISMIC ACTIONS X DIRECTION OF SEISMIC ZONE 1.1 ... 81
FIGURE 6.5 IDEALIZED PUSHOVER CAPACITY CURVES FOR DC L, DC M AND DC H OF SEISMIC ACTIONS X DIRECTION OF SEISMIC ZONE 1.1, EUROCODE 8 ANNEX B ... 82
FIGURE 6.6 DETERMINATION OF THE TARGET DISPLACEMEN TFOR THE EQUIVALENT SDOF SYSTEM ... 82
FIGURE 6.7 BASE SHEAR (VB) OF SESIMIC ACTIONS IN X DIRECTION, FOR DC L, DC M AND DC H IN SEISMIC ZONES TYPE 1 ... 83
FIGURE 6.8 BASE SHEAR (VB) OF SESIMIC ACTIONS IN Y DIRECTION, FOR DC L, DC M AND DC H IN SEISMIC ZONES TYPE 1 ... 83
FIGURE 6.9 BASE SHEAR (VB) OF SESIMIC ACTIONS IN X DIRECTION, FOR DC L, DC M AND DC H IN SEISMIC ZONES TYPE 2 ... 84
FIGURE 6.10 BASE SHEAR (VB) OF SESIMIC ACTIONS IN Y DIRECTION, FOR DC L, DC M AND DC H IN SEISMIC ZONES TYPE 2 ... 84
xvi
FIGURE 6.11 TARGET DISPLACEMENT (DT) OF SESIMIC ACTIONS IN X DIRECTION, FOR DC L, DC M AND DC H
IN SEISMIC ZONES TYPE 1 ... 85
FIGURE 6.12 TARGET DISPLACEMENT (DT) OF SESIMIC ACTIONS IN Y DIRECTION, FOR DC L, DC M AND DC H IN SEISMIC ZONES TYPE 1 ... 85
FIGURE 6.13 TARGET DISPLACEMENT (DT) OF SESIMIC ACTIONS IN X DIRECTION, FOR DC L, DC M AND DC H IN SEISMIC ZONES TYPE 2 ... 86
FIGURE 6.14 TARGET DISPLACEMENT (DT) OF SESIMIC ACTIONS IN Y DIRECTION, FOR DC L, DC M AND DC H IN SEISMIC ZONES TYPE 2 ... 86
FIGURE 6.15 DUCTILITY (Μ) OF SESIMIC ACTIONS IN X DIRECTION, FOR DC L, DC M AND DC H IN SEISMIC ZONES TYPE 1 ... 87
FIGURE 6.16 DUCTILITY (Μ) OF SESIMIC ACTIONS IN Y DIRECTION, FOR DC L, DC M AND DC H IN SEISMIC ZONES TYPE 1 ... 87
FIGURE 6.17 DUCTILITY (Μ) OF SESIMIC ACTIONS IN X DIRECTION, FOR DC L, DC M AND DC H IN SEISMIC ZONES TYPE 2 ... 88
FIGURE 6.18 DUCTILITY (Μ) OF SESIMIC ACTIONS IN Y DIRECTION, FOR DC L, DC M AND DC H IN SEISMIC ZONES TYPE 2 ... 88
FIGURE 6.19 DISTRIBUTION OF PLASTIC HINGES ON DC L FRAME ON THE TARGET DISPLACEMENT IN SESIMIC ZONE 1.1, DT= 20.72 CM ... 89
FIGURE 6.20 DISTRIBUTION OF PLASTIC HINGES ON DC M FRAME ON THE TARGET DISPLACEMENT IN SESIMIC ZONE 1.1, DT = 29.9 CM ... 89
FIGURE 6.21 DISTRIBUTION OF PLASTIC HINGES ON DC H FRAME ON THE MAXIMUM DISPLACEMENT IN SESIMIC ZONE 1.1, D= 21.9 CM. ... 89
FIGURE 6. 1 FEMA 356 PERFORMANCE LEVELS (TAKEN FROM FAJFAR ET AL. 2004) ... 74
FIGURE 6.2 CONCEPTUAL DIAGRAM FOR TRANSFORMATION OF MDOF TO SDOF SYSTEM (THEMELIS, 2008). ... 76
FIGURE 6. 3 (A) CAPACITY CURVE FOR MDOF STRUCTURE, (B) BILINEAR IDEALIZATION FOR THE EQUIVALENT SDOF SYSTEM. ... 77
FIGURE A. 1 BENDING MOMENT DIAGARAMS FOR THE BEAMS ... 99
FIGURE A. 2 SHEAR FORCE DIAGRAM FOR DC LFRAME BUILDING ... 101
FIGURE B. 1 BENDING MOMENT DIAGRAMS FOR DC M FRAME. ... 116
FIGURE B. 2 SHEAR FORCE DIAGRAMS, FOR DC M FRAME IN SEISMIC ZONE 1.3 ... 122
xvii
FIGURE C. 2 SHEAR FORCE DIAGRAMS FOR DC H FRAME IN SEISMIC ZONE 1.3. ... 143
FIGURE D.1 DETAILED LAYOUT FOR DC L FRAME IN SEISMIC ZONE 1.1 ... 158
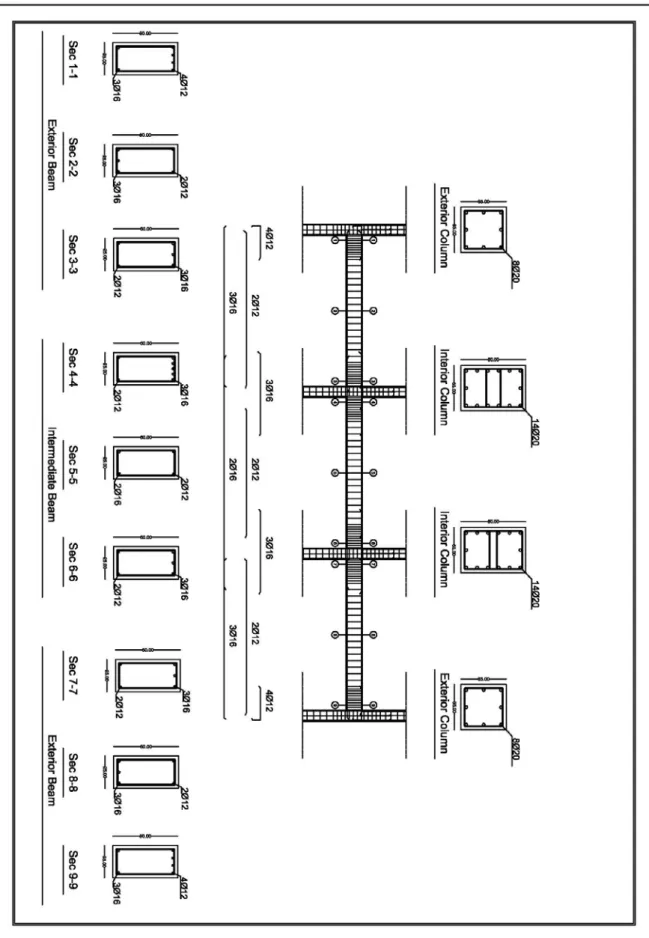
FIGURE D.2 DETAILED LAYOUT FOR DC M FRAME IN SEISMIC ZONE 1.1 ... 159
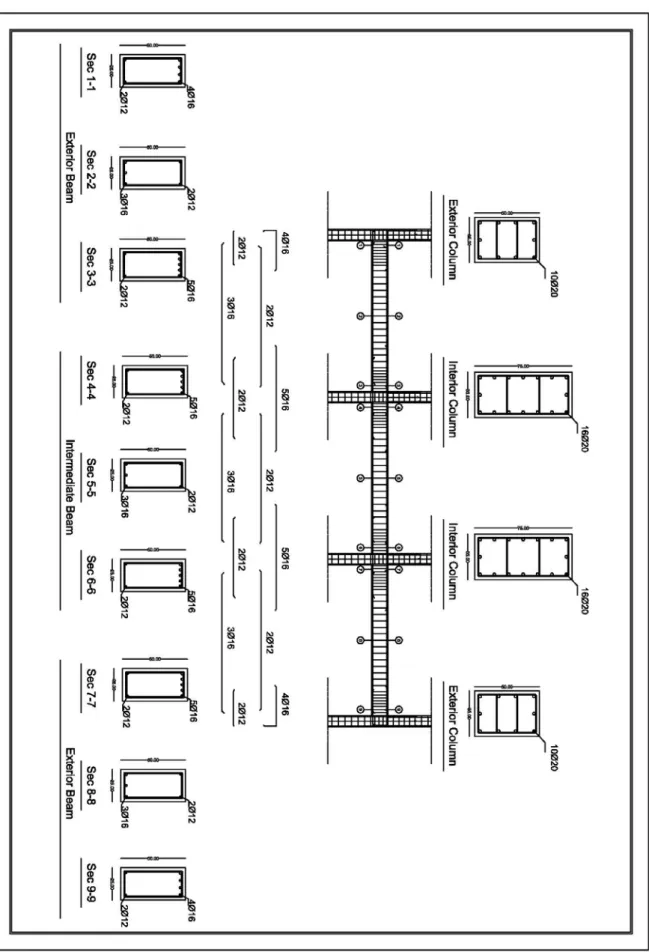
FIGURE D.3 DETAILED LAYOUT FOR DC H FRAME IN SEISMIC ZONE 1.1 ... 160
FIGURE D.4 DETAILED LAYOUT FOR DC L FRAME IN SEISMIC ZONE 1.2 ... 161
FIGURE D.5 DETAILED LAYOUT FOR DC M FRAME IN SEISMIC ZONE 1.2 ... 162
FIGURE D.6 DETAILED LAYOUT FOR DC H FRAME IN SEISMIC ZONE 1.2 ... 163
FIGURE D.7 DETAILED LAYOUT FOR DC L FRAME IN SEISMIC ZONE 1.3 ... 164
FIGURE D.8 DETAILED LAYOUT FOR DC M FRAME IN SEISMIC ZONE 1.3 ... 165
FIGURE D. 9 DETAILED LAYOUT FOR DC H FRAME IN SEISMIC ZONE 1.3 ... 166
FIGURE D. 10 DETAILED LAYOUT FOR DC L FRAME IN SEISMIC ZONE 1.4 ... 167
FIGURE D. 11 DETAILED LAYOUT FOR DC M FRAME IN SEISMIC ZONE 1.4 ... 168
FIGURE D.12 DETAILED LAYOUT FOR DC H FRAME IN SEISMIC ZONE 1.4 ... 169
FIGURE D.13 DETAILED LAYOUT FOR DC L FRAME IN SEISMIC ZONE 1.5 ... 170
FIGURE D.14 DETAILED LAYOUT FOR DC M FRAME IN SEISMIC ZONE 1.5 ... 171
FIGURE D.15 DETAILED LAYOUT FOR DC H FRAME IN SEISMIC ZONE 1.5 ... 172
FIGURE D.16 DETAILED LAYOUT FOR DC L FRAME IN SEISMIC ZONE 2.3 ... 173
FIGURE D.17 DETAILED LAYOUT FOR DC M FRAME IN SEISMIC ZONE 2.3 ... 174
FIGURE D.18 DETAILED LAYOUT FOR DC H FRAME IN SEISMIC ZONE 2.3 ... 175
FIGURE D.19 DETAILED LAYOUT FOR DC L FRAME IN SEISMIC ZONE 2.4 ... 176
FIGURE D.20 DETAILED LAYOUT FOR DC M FRAME IN SEISMIC ZONE 2.4 ... 177
FIGURE D.21 DETAILED LAYOUT FOR DC H FRAME IN SEISMIC ZONE 2.4 ... 178
FIGURE D.22 DETAILED LAYOUT FOR DC L FRAME IN SEISMIC ZONE 2.5 ... 179
FIGURE D.23 DETAILED LAYOUT FOR DC M FRAME IN SEISMIC ZONE 2.5 ... 180
FIGURE D 24 DETAILED LAYOUT FOR DC H FRAME IN SEISMIC ZONE 2.5 ... 181
FIGURE E.1 IDEALIZED BILINEAR PUSHOVER CURVE FOR X DIRECTION IN SEISMIC ZONE 1.1 ... 182
FIGURE E.2 IDEALIZED BILINEAR PUSHOVER CURVE FOR Y DIRECTION IN SEISMIC ZONE 1.1 ... 182
FIGURE E.3 IDEALIZED BILINEAR PUSHOVER CURVE FOR X DIRECTION IN SEISMIC ZONE 1.2 ... 183
FIGURE E.4 IDEALIZED BILINEAR PUSHOVER CURVE FOR Y DIRECTION IN SEISMIC ZONE 1.2 ... 183
FIGURE E.5 IDEALIZED BILINEAR PUSHOVER CURVE FOR X DIRECTION IN SEISMIC ZONE 1.3 ... 184
FIGURE E.6 IDEALIZED BILINEAR PUSHOVER CURVE FOR Y DIRECTION IN SEISMIC ZONE 1.3 ... 184
FIGURE E.7 IDEALIZED BILINEAR PUSHOVER CURVE FOR X DIRECTION IN SEISMIC ZONE 1.4 ... 185
FIGURE E.8 IDEALIZED BILINEAR PUSHOVER CURVE FOR Y DIRECTION IN SEISMIC ZONE 1.4 ... 185
FIGURE E.9 IDEALIZED BILINEAR PUSHOVER CURVE FOR X DIRECTION IN SEISMIC ZONE 1.5 ... 186
xviii
FIGURE E.11 IDEALIZED BILINEAR PUSHOVER CURVE FOR X DIRECTION IN SEISMIC ZONE 2.3 ... 187
FIGURE E.12 IDEALIZED BILINEAR PUSHOVER CURVE FOR Y DIRECTION IN SEISMIC ZONE 2.3 ... 187
FIGURE E.13 IDEALIZED BILINEAR PUSHOVER CURVE FOR X DIRECTION IN SEISMIC ZONE 2.4 ... 188
FIGURE E.14 IDEALIZED BILINEAR PUSHOVER CURVE FOR Y DIRECTION IN SEISMIC ZONE 2.4 ... 188
FIGURE E.15 IDEALIZED BILINEAR PUSHOVER CURVE FOR X DIRECTION IN SEISMIC ZONE 2.5 ... 189
xix
xx
List of tables
TABLE 2. 1 EARTHQUAKES IN PORTUGAL AND ITS ADJACENT ATLANTIC MARGIN BETWEEN 1300 AND 2014, WITH MAXIMUM OBSERVED INTENSITY IO ≥ 8. (FERRÃO ET AL., 2016) ... 11 TABLE 2.2 REFERENCE PEAK GROUND ACCELERATION, AGR (CAMPOS COSTA, SOUSA AND CARVALHO,
2008). ... 14
TABLE 3.1 OVERVIEW OF DUCTILE DETAILING REQUIREMENTS FOR RC FRAME BUILDINGS IN DIFFERENT SEISMIC DESIGN CODES(KHOSE, SINGH AND LANG, 2012) ... 20 TABLE 3.2 DIFFERENT DUCTILITY CATEGORIES OF RC FRAME BUILDINGS(KHOSE, SINGH AND LANG, 2012) . 21 TABLE 3.3 BASIC VALUE, QO, OF BEHAVIOR FACTOR PER EC8 FOR HEIGHT-WISE REGULAR BUILDINGS ... 23 TABLE 3.4 EUROCODE 8 DETAILING OF THE LONGITUDINAL BARS IN PRIMARY BEAMS (FARDIS ET AL., 2015)
... 27 TABLE 3.5 EC8 DETAILING RULES FOR VERTICAL BARS IN PRIMARY COLUMNS ... 30 TABLE 3.6 EC8 DETAILING RULES FOR THE TRANSVERSE REINFORCEMENT OF PRIMARY BEAMS ... 34 TABLE 3.7 EC8 DETAILING RULES FOR TRANSVERSE REINFORCEMENT IN PRIMARY COLUMNS ... 36
TABLE 4.1 HAZARD SEISMIZ ZONES IN PORTUGAL TYPE 1 AND TYPE 2 ... 41
TABLE 5.1 CONCRETE AND REINFORCEMENT DETAILS FOR FRAME COLUMNS AS PER EC2 ... 43 TABLE 5.2 CONCRETE AND REINFORCEMENT DETAILS FOR FRAME BEAMS AS PER EC2 ... 43 TABLE 5.3 CONCRETE AND REINFORCMENT MATERIAL CLASS (BETÃO, NR AND NR, 2017) ... 44 TABLE 5.4 CONCRETE AND REINFORCEMENT DETAILS FOR FRAME BEAMS IN SEISMIC ZONE 1.4 ... 51 TABLE 5.5 CONCRETE AND REINFORCEMENT DETAILS FOR FRAME BEAMS IN SEISMIC ZONE 1.5 ... 52 TABLE 5.6 CONCRETE AND REINFORCEMENT DETAILS FOR FRAME BEAMS IN SEISMIC ZONE 2.3 ... 52 TABLE 5.7 CONCRETE AND REINFORCEMENT DETAILS FOR FRAME BEAMS IN SEISMIC ZONE 2.4 ... 53
xxi
xxii
Table of Contents
DEDICATION III
ACKNOWLEDGEMENTS V
RESUMO (IN PORTUGUESE) VII
ABSTRACT X
LIST OF FIGURES XIII
LIST OF TABLES XX
TABLE OF CONTENTS XXII
1. INTRODUCTION 1
1.1. Objectives ... 1 1.2. Motivation ... 1 1.3. Thesis Framework ... 1
2. LITERATURE REVIEW 3
2.1. Earthquakes and Earthquake-Resisting building ... 3
2.1.1. Global Information about Earthquakes ... 3
2.1.2. Earthquake-resisting buildings ... 3
2.2. Ductility of Reinforced Concrete Frame Buildings ... 4 2.3. Beam-Columns joints in RC Frame Buildings ... 8 2.4. Hazard Seismic Zones in Portugal ... 10
3. SEISMIC PERFROMANCE OF REINFORCED CONCRETE FRAME
xxiii
3.1. Reinforced Concrete Frame Buildings... 17 3.2. Seismic Design of RC Frame Buildings ... 17
3.2.1. Conceptual design of RC frames for earthquake resistance ... 17
3.2.2. Design of RC frame building for code provisions ... 18
3.2.3. Building Ductility Classification According to code provisions ... 19
3.2.4. Seismic Design for Ductility according to EC 8 ... 22
3.2.5. Pros and Cons ofRC frames for earthquake resistance ... 23
3.3. Sizing of RC Frame Members according to EC8 ... 24
3.3.1. Sizing of Beams ... 24
3.3.2. Sizing of Columns ... 24
3.4. Detailed Design of RC Frame members in Flexure ... 26
3.4.1. Detailed Design of Beams in Flexure ... 26
3.4.2. Detailed Design of Columns in Flexure ... 28
3.5. Detailed Design of RC Frame members in Shear ... 32
3.5.1. Capacity Design Shears in Beams or Columns... 32
3.5.2. Detailed Design of Beams in Shear ... 33
3.5.3. Detailed Design of Columns in Shear ... 34
3.6. Detailing for Ductility ... 37
3.6.1. Critical Regions in Ductile Members ... 37
4. CASE STUDY 39
4.1. Building Characteristics ... 39 4.2. Loads on the buildings ... 39 4.3. Hazard Seismic Zones ... 41
5. DESIGN OF THE BUILDING 43
5.1. Design Assumption ... 43
5.1.1. Design according to Eurocode 2. ... 43
5.1.2. Design according to Eurocode 8. ... 44
5.2. Detailed design of frame columns ... 44 5.3. Detailed design of frame Beams... 50
xxiv
5.4. Total quantaties for the frame ... 57 5.5. Total cost for the frame ... 66
6. ASSESSMENT OF DESIGNED FRAMES 73
6.1. Types of Analysis Procedures ... 74 6.2. Nonlinear Static analysis Procedure ... 75
6.2.1. Performance assessment based on Pushover analysis methods ... 78
6.2.2. N2 Method ... 79
6.2.3. Results of Pushover Analysis (N2 Method) ... 81
7. CONCLUSION AND FURTURE RESEARCH 91
7.1. Main conclusion ... 91 7.2. Future research ... 92
REFERENCES 93
1
1. Introduction
1.1. Objectives
This work is aimed to study the differences obtained with differenet ductility considerations in the design of reinforced concrete frame building. The Eurocode 8 (EN 1998-1, 2004) mention three different ductility classes for the seismic design, however it is not so clear how the designer can choose the suitable ductility to start the design. Therefore in this work it were studied a reinforced concrete frame building assuming that the building is located in different seismic zones in Portugal, and in each seismic zone, the building will be designed for the three different ductility classes. The results of the designs will show the differences in cross sections and details of the columns and the beams of the frames, which it affects on the total cost of the building, and it will show how it can be more economic if the designer is able to determine suitable ductility for the building depend on previous knowledge of seismic. Economic result is not only the main objective of thesis, building performance during the earthquake is an important factor to study, to achieve minimum damages on the building during the earthquake. In the end both cases economic point view and building performance will be analysed and discussed.
1.2. Motivation
The Eurocode 8 as a provision code for seismic design in Europe, Eurocode 8 recommends three ductility classes for seismic design, however it is not clear for designers to determine the required ductility class for the design, also the effect of the ductility class on the cost and the performance of the building. It is not easy decision to determine suitable ductility class for the structure to resist seimic actions in high performance with the optimum cost.
The aim of the present work was to evaluate the effect of ductility on the performance and the cost of the building.
1.3. Thesis Framework
The present work was arranged in six chapters. The present chapter gives the introduction and motivation for the developed work.
Chapter 2, presents a literure review, giving a background of earthquake and earthquake resisting-building, ductility of reinforced concrete frame building, beam-column joints in RC frame building, and hazard seismic zones in Portugal. In
2 Chapter 3, is discussed the seismic design of reinforced concrete frame building, comparing between seismic design code provisions for RC frame buildings and the aspects of the design for each code provision, and the rules for design and detail the RC frames according to Eurocode 8.
Chapter 4, is presented the case study of six floors reinforced concrete frame building, designed according to Eurocode 2 as an initial design and according to Eurocode 8 to resist seismic actions, the building has been considered in different seismic zones in Portugal, and designed for the three ductility classes recommended by Eurocode 8, and in.
Chapter 5, considering the seismic design rules of Eurocode 8 mentioned in chapter 3, the building has been designed and detailed for the three ductility classes and comparing between cross sections of concrete and reinforcement, and longitudinal and transverse reinforcement, the total from cost for each ductility class. After the building design in
Chapter 6, is performed the seismic assessment of the building, according to N2 method mentioned in Eurocode 8, using nonlinear pushover analysis. In
3
2. Literature Review
2.1. Earthquakes and Earthquake-Resisting building
2.1.1. Global Information about Earthquakes
Earthquakes are one of the most devastating natural hazards that cause great loss of life and livelihood. On average, 10,000 people die each year due to earthquakes, while annual economic losses are in the billions of dollars and often constitute a large percentage of the gross
national product of the country affected(Hatheway, 1996). The earthquake threat has distinct
characteristics which have important consequences for the ways in which society responds to the threat, and the part that structural engineers will play in that response(Booth, 2014).
The Richter magnitude scale is a logarithmic based scale which utilizes the amplitude of seismic vibrations, recorded on a standard seismograph, to determine the strength of an earthquake. A unit increment on the scale represents a ten-fold increase in amplitude and an increase in energy release of 31.6 times. Earthquakes of Richter magnitude 6, 7 and 8 are categorized respectively as moderate, major and great earthquakes. Richter magnitude 8.5 is estimated to be the maximum that maybe anticipated in California. The Loma Prieta earthquake had a magnitude of 7.1 and was the result of a rupture along a 25-mile-long segment of the San Andreas fault between Los Gatos and Watsonville. The San Francisco earthquake of April 1906 had a magnitude of 8.25 and was the result of a rupture along a 270 mile long segment of the San Andreas fault(Alan Williams, 2000).
The intensity of an earthquake is based on the damage and other observed effects on people, buildings, and other features. Intensity varies from place to place within the disturbed region. An earthquake in a densely populated area that results in many deaths and considerable damage may have the same magnitude as a shock in a remote area that does nothing more than frighten the wildlife. Large magnitude earthquakes that occur beneath the oceans may not even be felt by humans(Lindeburg and McMullin, 2014).
2.1.2. Earthquake-resisting buildings
Major earthquakes in this century have demonstrated repeatedly that well-constructed buildings designed without adequate consideration of seismic forces have often performed satisfactorily when subjected to intense ground motions(Eams and Earls, 2000). Today’s design professionals know how to design and construct buildings and other structures that can resist even the most intense earthquake effects with little damage. However, designing structures in this manner can significantly increase their construction cost(Council, 2010).
An earthquake represents for the structure a demand to accommodate a given energy input or given imposed dynamic displacements. Seismic damage to structural elements, or even
4
to non-structural ones that follow the deformations of the structure, is due to deformations induced by the seismic response. Consistent with this reality, Eurocode 8(EN 1998-1, 2004) states that compliance criteria for the damage limitation limit state (i.e. performance level) should be expressed in terms of deformation limits. For equipment mounted or supported on the structure, limits relevant to damage may be expressed in terms of response accelerations at the positions of the equipment supports (Fardis et al., 2005).
The primary objective of earthquake resistant design is to prevent building collapse during earthquakes thus minimising the risk of death or injury to people in or around those buildings. Because damaging earthquakes are rare, economics dictate that damage to buildings is expected and acceptable provided collapse is avoided(King, 1998).
Earthquake-resistant design of buildings is intended primarily to provide for the inertial effects associated with the waves of distortion that characterizes dynamic response to ground shaking. These effects account for most of the damage resulting from earthquakes. In a few cases, significant damage has resulted from conditions where inertial effects in the structure were negligible(Omer and Amine, no date).
The beneficial influence of the deformation capacity of a structural system, that is ductility in a global sense is now probably widely accepted. However, the sources of this highly desirable, indeed life-saving, structural property are seldom properly traced, or quantified. The exploitation of ductility for its intended purpose, to provide reserve deformation capacity without significant reduction of resistance to lateral forces, is often not fully implemented. Deformation capacity is the most important structural property in areas of high seismic risk and where economic constraints limit the level of seismic resistance that can be afforded (Paulay, 1996).
2.2. Ductility of Reinforced Concrete Frame Buildings
Ductility is the ability of the structure or structural components to undergo inelastic deformation alternating repetitive after the first melting, while maintaining sufficient strength and rigidity to support the load, so that the structure remains standing despite being cracked / damaged and on the verge of collapse(Department of Publics Works, 2002).
For economical resistance against strong earthquakes most structures must behave inelastically. The average plastic energy, dissipated by a structure during the design ground motion, usually gives enough information to evaluate the structural performance. For RC structures, the essential objectives of failure mode control are: brittle failure modes should be suppressed; an appropriate degree of ductility should be provided (but the degree to which the ductility should be enhanced is debatable). While most concrete structures are designed by equivalent static analysis and codified reinforcing rules aimed at providing ductility, it is important for designers to understand how the ductility demand arises. Having made an
5
estimate of the ductility, the members should be detailed to have the appropriate section ductility (Iskhakov, 2003).
The current design practice relies on the ductile flexural response at plastic hinges as the primary source of energy dissipation during earthquake loading cycles. This requires proper care in detailing the locations where plastic hinges are expected to occur. According to the seismic design provisions in modern building codes, buildings are supposed to resist minor earthquakes without damage, moderate earthquakes without significant structural damage, and in the case of a major earthquake, some structural and non-structural damage is allowed but without collapse (Mantawy, 2015).
Using spectral accelerations that result from a response spectrum, appropriately reduced by a, so called, behaviour factor (q in Europe) or force reduction factor (R in the U.S.). Ultimately, the structural system is designed for a lower level of strength, relying that stable energy absorption will be made feasible through specific geometric and minimum reinforcement requirements along with the associated detailing rules. Fundamental requirements (i.e. collapse prevention, damage limitation, minimum level of serviceability) are also achieved through capacity design for the enhancement of global ductility (Sextos and Skoulidou, 2012). The q factor represents a global characteristic of structural behaviour and a simple tool for designers, which allows performing an equivalent elastic analysis instead an inelastic one (Vaseva, 2003).
Fundamental requirements (i.e. collapse prevention, damage limitation, and minimum level of serviceability) are also achieved through capacity design for the enhancement of global ductility. According to (EN 1998-1, 2004) in particular, the above philosophy is materialised for reinforced concrete buildings through the choice of the Ductility Class, i.e., Low (DCL), Medium (DCM) and High (DCH), each corresponding to different structural and detailing requirements. Notably, the Lower ductility class is only recommended by National Annexes in low seismicity areas or for base-isolated structures(Sextos and Skoulidou, 2012). Chapter 3, discussing the differences of the ductility classes detailing requirement as per to Eurocode 8.
6
Resistance earthquake design of RC building structure should ensure whole property resistance earthquake of structure, according to (Men and Qiu, 1998). Ductility demand of resistance earthquake of RC frame building structure is:
• Strong column and soft beam of RC frame • Moment regulate in beam end of RC frame • Shear-pressure ratio in beam of RC frame
• Strong shear and soft curve in column of RC frame • Strong connect and soft member of RC frame point • Shear-pressure ratio in column of RC frame
• Shear-pressure ratio in point of RC frame • Axial pressure ratio in column of RC frame • Axial force increases for frame supported column
• Moment increase for column base in base story of column
Building structure ductility factor μ is the ratio between the maximum deviation of the building structure due to the influence of the plan at the time of the earthquake reached the
brink of collapse conditions and deviation δm building structure at the time of the first melting
δy. At full elastic condition value μ = 1.0 (Jamal et al., 2014). Ductility level structure is
influenced by the pattern of cracks or plastic hinge, wherein the plastic joints must be arranged to form at the ends of the beams and columns. Mathematically ductility is as a comparison parameter displacement structure collapsed during the displacement at the outer tensile reinforcement when experiencing fatigue (Department of Publics Works, 2002),(Department of Public Works, 2002).
According (Pauley et al., 1992) ductility divided into:
1. Ductility strain is the ratio of maximum strain to strain on the beam melting experiencing tensile axial load or press;
𝜇𝜇𝜀𝜀 = 𝜀𝜀𝜀𝜀𝑢𝑢𝑦𝑦 (2.1)
Figure 2.2 Ductility strain.
2. Ductility curvatureccc, is the ratio between the curvature angle (rotation angle per unit length) with a maximum angle of curvature of the melting of a structural element due to bending force;
7 Figure 2.3 Ductility curvature.
3. Rotational ductility is the ratio between the maximum rotation angle of the rotation angle of melting;
𝜇𝜇𝜃𝜃 =θθ𝑢𝑢
𝑦𝑦 (2.2)
Figure 2.4 Ductility rotation.
4. Displacement ductility is the ratio between the maximum structural displacements in the lateral direction of the movement of the structure while melting.
Figure 2.5 Ductility displacement.
The ductile response of the RC components in a frame system is one of the most important aspect in the seismic design. This response is achieved by careful attention to prevent brittle failure modes such as shear and anchorage in order for the member to behave inelastically under the seismic loading cycles. Each member has to provide ductility capacity more the expected ductility demand from the maximum design level earthquake.
8
The ductility demands for each component of the RC frames in the two buildings can be calculated from the curvature histories using the following formula (Banon, Irvine and Biggs, 1981)
𝜇𝜇φ =φφ𝑚𝑚𝑦𝑦 (2.3)
where “φ𝑦𝑦” is the yield curvature of the RC element that indicates the first yield of longitudinal
reinforcing bars and “φ𝑚𝑚” is the maximum curvature along the element. The ductility demand
of an RC member indicates certain levels of damage such as the yielding of the longitudinal bars as well as cracking and spalling of concrete.
2.3. Beam-Columns joints in RC Frame Buildings
The RC joint is defined as that portion of the column within the depth of the beam(s), including the slab, that frame into the column (Pinkham et al., 1985).
Beam column joints in a reinforced concrete moment resisting frame are crucial zones for transfer of loads effectively between the connecting elements (i.e. beams and columns) in the structure. In normal design practice for gravity loads, the design check for joints is not critical and hence not warranted. But, the failure of reinforced concrete frames during many earthquakes has demonstrated heavy distress due to shear in the joints that culminated in the collapse of the structure. It is worth mentioning that the relevant research outcomes on beam column joints from different countries have led to conflicts in certain aspects of design. Coordinated programmes were conducted by researchers from various countries to identify these conflicting issues and resolve them (Park, R. and Hopkins, 1989)
Beam column joints are generally classified with respect to geometrical configuration and identified as interior, exterior and corner joints as shown in Figure 2.6 (Uma, 2015).
Figure 2.6 Types of Joints in a Moment Resisting Frame(Uma, 2015)
In RC moment resisting frame structures, the functional requirement of a joint, which is the zone of intersection of beams and columns, is to enable the adjoining members to develop and sustain their ultimate capacity. The demand on this finite size element is always severe and more complex due to the possible two-way actions in three-dimensional frame structures. However, the codes consider one direction of loading at a time and arrive at the design parameters for the joint (Uma, 2015).
9
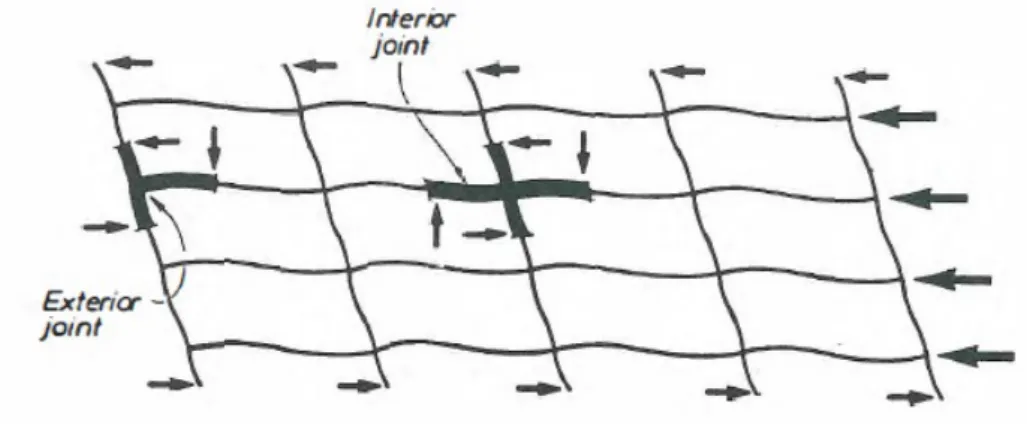
Beam-column joints in moment resisting frames are usually subjected to large shear forces due to lateral earthquake forces. This is illustrated in Figure 2.7 for typical interior and exterior planar frame joints (Pak and Cheung, 1991). Reinforced concrete beam-column joints have limited energy dissipation characteristics and suffer from rapid strength degradation when they undergo inelastic deformations. As a result, inelastic deformations in ductile moment resisting frame structures designed for earthquake resistance must be located in regions other than the beam-column joints. Some design criteria for beam-column joints were suggested in New Zealand some years ago by (Paulay T. and Park R. and Priestley, 1978). They are described as follows:
1. The strength of a joint should not be less than the maximum strength of the weakest members it connects, to eliminate the need for repair in a relatively inaccessible region and to prevent the need · for energy dissipation by mechanisms that undergo strength and stiffness degradation when subjected to cyclic loading in the inelastic range. 2. The capacity of a column should not be jeopardized by possible strength degradation
within the joint.
3. During a moderate seismic disturbance, a joint should preferably respond within the elastic range. Joint deformations should not significantly affect stiffness of a building and hence inter-storey drift.
4. The joint reinforcement necessary to ensure satisfactory performance should not cause undue construction difficulties.
Figure 2.7 Exterior and Interior Beam-Column Join t Subassemblies of a Ductile Moment Resisting Frame Subjected to Lateral Loads.(Pak and Cheung, 1991)
10 Figure 2.8 The deflected shape of an inelastic frame under earthquake attack.(Pak and Cheung, 1991)
2.4. Hazard Seismic Zones in Portugal
The Portuguese mainland and its adjacent Atlantic region are located on the western and southern margins of the Iberian Peninsula. The seismicity of this area is characterized by different regions with different seismic behaviors. The seismicity of the Portuguese territory increases in intensity from north to south, with a spatial distribution concentrated in the south and its adjacent Atlantic margins. Some seismological agencies have reported that the epicenters are concentrated near the city of Évora, in the Lisbon region, in the LowerTagusValley (LTV) region, and along the Algarve coast, especially in the southwest region in Cape of São Vicente and the Gorringe Bank(Ferrão et al., 2016).
In southern Portugal, there are several tectonic structures: the Messejana fault, which crosses the entire southern region with a northeast–southwest orientation, and the Moura– Vidigueira and Loulé faults, which are most likely responsible for the large historical earthquakes in the Algarve region(Borges et al., 2001).
The seismic hazards of the Portuguese mainland and adjacent Atlantic region are characterized by moderate-to-large onshore earthquakes and large-to-very large offshore earthquakes (Vilanova and Fonseca, 2007).
Investigation of the seismic hazards in this area continues to be critically important for the people of Portugal(Bezzeghoud, Borges and Caldeira, 2012)
The national seismographic network was created due to the 23 April 1909 (Mw 6.0), earthquake and it was further improved following an earthquake on 28 February 1969 (Ms 8.0). Until the mid- 1990s, however, the low quality of the instrumentation and the large geographic dispersion of the stations rendered the national seismographic network ineffective; it was able to locate only approximately 20% of the observed local and/or regional seismic events (Senos and Carrilho, 2003).
After several attempts to improve the coverage of the national seismographic network, 22 broadband stations were installed between 2006 and 2009. Since then, it has been possible to record all classes of earthquake magnitude that occur in Portugal (minor to major). Other organizations also have seismic equipment (e.g., the Universities of Lisbon and Évora), and this equipment provides high-quality data that contribute to the characterization of seismic
11
hazards(‘CSEM / EMSC Newsletter Recent improvements in the Broadband seismic networks in Portugal’, 2007).
In the computation of the hazard, the variability of the ground-motion model is taken into account by integrating over the aleatory uncertainty, leading to a mean value of hazard that is higher than the value obtained using the mean ground-motion model only (Bender and Perkins, 1993). Besides the aleatory uncertainty that results from the intrinsic variability of ground motion at a particular site, the incomplete knowledge about the appropriateness of the models used and the values of their parameters contributes to the overall uncertainty affecting a hazard estimate.
This aspect of hazard evaluation has been the object of intense debate in recent years. (Abrahamson and Bommer, 2005) point out that the weights assigned to each hazard value in the logic tree cannot be treated strictly as probabilities, because the models sampled by the combinations of branches do not span exhaustively the model space, nor are they mutually exclusive. As a result, (Abrahamson and Bommer, 2005) argue against the common practice of estimating mean hazard values by weighted averages of the logic tree individual branches. This procedure is also charged with being oversensitive to low-probability high-hazard end members. (McGuire, Cornell and Toro, 2005), on the contrary, taking an approach based on decision theory, favor the use of mean hazard values whenever a single-hazard curve or ground motion level has to be provided, as is the case for design (Vilanova and Fonseca, 2007).
Table 2.1 shows some of the strongest earthquakes in the period from 1300 to 2014. This table shows observations for some of the most significant earthquakes shown in Figure 2.9 (Ferrão et al., 2016).
Table 2. 1 Earthquakes in Portugal and its Adjacent Atlantic Margin between 1300 and 2014, with Maximum Observed Intensity Io ≥ 8. (Ferrão et al., 2016)
Date Longitude Latitude Locality Io M* Observations
(yyyy/mm/dd) (°) (°)
1309/02/22 −11.0 36.0 Epicenter
offshore VIII–IX —
Felt in Portugal and Europe, without damage.
1344/01/01 −8.8 38.9 Benavente VII–
VIII —
Destruction of Chapel of Lisbon and registration of deaths and falling buildings
1353/–/– −8.1 37.3 Silves VII–
VIII —
Much of the city of Silves (Algarve) was destroyed.
1356/08/24 −10.7 36.0 Epicenter
offshore VIII–IX —
Felt in Spain (Seville and Córdoba); fall and ruins of chapel and buildings in Lisbon; duration of 2 times 15 min, followed by aftershocks; and damage similar to the 1531 and 1755 earthquakes.
1512/01/28 −9.2 38.7 Lisbon VIII —
Destruction of monastery and fall of 200 buildings in Lisbon; death of 2000 people (Lisbon). 1531/01/26 −9.0 38.9 Vila Franca de Xira IX —
Destruction of churches and about 1500 buildings in Lisbon; Tagus river agitated, overtaking the margins; high seismic activity; followed by aftershocks.
1587/11/– −8.0 37.1 Loulé VII–
VIII —
The village of Loulé (Algarve) was destroyed with about 170 deaths.
12
1722/12/27 −7.6 37.2 Epicenter
offshore VIII —
Registrations fall of churches, monasteries, and buildings in Portimão; duration of 1 Ave Maria.
1755/11/01 −10.5 37.0 Epicenter
offshore X Mw 8.5
Felt throughout Europe; registration of tsunami with destructive waves more extent in Portugal, Gulf of Cadiz (Spain), and northern Morocco.
1856/01/12 −8.0 37.1 Tavira VII–
VIII —
Registration damage in temples and buildings in Algarve; Strong underground noises; followed by aftershocks.
1858/11/11 −9.0 38.2 Epicenter
offshore VIII Ms 8.5
Foreshocks; registration of deaths and injuries; ruined buildings in Lisbon and Setúbal.
1909/04/23 −8.8 39.0 Benavente X Mw 6.0
Earthquake with violent shocks; destroyed several small towns; damage and effects in the whole country.
1910/09/11 −7.8 38.8 Redondo VII–
VIII — No information. 1964/03/15 −7.9 36.1 Epicenter
offshore VII Ms 6.2
Mainshock followed by aftershocks and tsunami.
1969/02/28 −10.9 35.9 Epicenter
offshore VIII Ms 8.0
Mainshock followed by aftershocks and small tsunami; record of 13 fatalities in Portugal; felt throughout the country, with higher intensity in Algarve (Vila do Bispo, Bensafrim, Portimão); felt in Bordeaux and the Canaries.
2007/02/12 −10.5 35.9 Epicenter
offshore V ML 5.9
Felt in Portugal, some cities in Spain and Morocco; without registration of casualties or damage.
2009/12/17 −9.9 36.5 Epicenter
offshore V ML 6.0
Mainshock followed by aftershocks; felt in Portugal, especially in Algarve region, with no damage registration; largest earthquake recorded since 1969. Table 1 shows some of the strongest earthquakes in the period from 1300 to 2014. The magnitude is expressed using different scales: surface-wave magnitude (Ms), local magnitude (ML), and moment magnitude (Mw). Latitude and longitude are also reported.
* A long dash indicates instrumental magnitudes are not available.
Concerning studies with a national coverage, Oliveira (Oliveira, C., Sousa, M., Costa, 1999) carried out the first comprehensive seismic hazard assessment for Portugal, whose results served as the foundation for the seismic hazard maps currently endorsed by the Portuguese design code (Ministério da Habitação e Obras Públicas, 1983). In the scope of the draft of the National Annex for the Eurocode 8 (EN 1998-1, 2004), several additional studies were also performed resulting in a seismic hazard map for moderate magnitude events at short distance, and large magnitude events at long distances(Oliveira, C., Sousa, M., Costa, 1999). In a study by Sousa(Sousa, 2006), a seismic risk assessment was carried out, using the seismic hazard model from (Sousa, 1996), and several simplified methodologies for the building vulnerability assessment and a detailed exposure model compiled based on data from the Building Census of 2001. Sousa (Sousa, 2006) calculated human and economic loss maps for several return periods, as well as loss maps for two deterministic events equivalent to the historical earthquakes of Lisbon in 1755 and Benavente in 1909. In (Vilanova and Fonseca, 2007), a seismic hazard model for Portugal is proposed using a logic tree approach to characterize the various epistemic uncertainties such as seismic sources characterization, selection of ground motion prediction equations, earthquake catalogues and methodologies to derive the magnitude-frequency elationship parameters. This effort resulted in the creation of a national hazard map for peak ground acceleration for a probability of exceedance of 10% in 50 years (Suckale and Grunthal, 2009).
13 Figure 2. 9 Historical seismicity (1300–1960) and instrumental seismicity (1961–2014, IPMA database) with the
associated quality factor (QF), using the modified Mercali intensity (MMI) scale. (Ferrão et al., 2016)
In Eurocode 8 (EN 1998-1, 2004) the country seismic zonation is one of the Nationally Determined Parameters (NDP). Seismic zonation should be established for a reference peak
ground acceleration on type A ground, agR, correspondent to the reference return period TNCR
of seismic action for the no-collapse requirement, i.e. 475 years (Figure 1.3) (Campos Costa, Sousa and Carvalho, 2008). The initial proposal was discussed within Eurocode 8 working group, and incorporated some suggestions resulting from a public presentation for the technical and scientific Portuguese community. In accordance to those discussions, the initial proposal progressed to a five seismic zones territory division, for the long-distance scenario, and a three seismic zones division, for short distance scenario. Regarding the former scenario one intends to obtain a smoother acceleration transition between consecutive zones, and in the latter scenario some zones with approximate peak ground acceleration were eliminated (Carvalho, 2007).
14 Figure 2.10 Mainland Portugal hazard maps for a exceedance probability of 10% in 50 years (Campos Costa, Sousa
and Carvalho, 2008).
Table 2.2 presents the reference peak ground acceleration, agR for the considered seismic
zones and for the two scenarios.
Table 2.2 Reference peak ground acceleration, agR (Campos Costa, Sousa and Carvalho, 2008).
Type 1 seismic action Type 2 seismic action Seismic zone agR [m/s2] Seismic zone agR [m/s2]
1.1 2.5 2.1 2.5
1.2 2.0 2.2 2.0
1.3 1.5 2.3 1.7
1.4 1.0 2.4 1.1
1.5 0.5 2.5 0.8
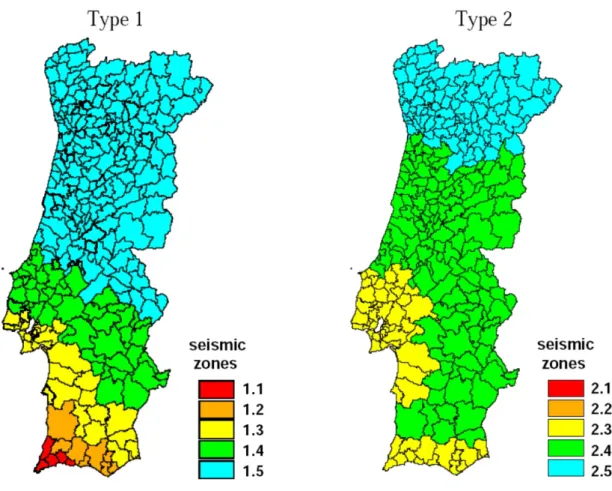
Figure 2.11 illustrates seismic zonation for the Portuguese National Annex of NP EN 1998-1 where, in what concerns Mainland Portugal, the two scenarios are distinguished. Seismic zonation was geographically disaggregated for each of the 278 Portuguese counties (Campos Costa, Sousa and Carvalho, 2008).
15 Figure 2.11 Mainland Portugal seismic zonation for Portuguese National Annex of NP EN 1998-1 (Campos Costa,
17
3. Seismic Perfromance of Reinforced Concrete Frame
Buildings
3.1. Reinforced Concrete Frame Buildings
Structural members in any structure must be designed to safely and economically support the self-weight of the structure and to resist all of the loads superimposed on the structure. In ordinary buildings, superimposed loads typically consist of live loads due to the inhabitants, dead loads due to items permanently attached to the building, and lateral loads due to wind or earthquakes. Some types of buildings must also be designed for extraordinary loads such as explosions or vehicular impact. A typical reinforced concrete building is made up of a variety of different reinforced concrete members. The members work together to support the applicable loads, which are transferred through load paths in the structure to the foundation members. The loads are ultimately supported by the soil or rock adjoining the foundations (Fanella, 2011).
As the building height increases, the importance of lateral forces due to wind and earthquake can be increased. Conventional load-bearing walls become unviable in such buildings, as the masonry wall thickness required in the lower storeys is large. The provision of thick masonry walls is not only expensive, it also reduces the flooring area in the rooms, and increases the mass, thereby attracting higher seismic forces. In such situations, frames (a skeleton of beams, columns and foundation) can be more apposite than load-bearing walls as the structural system. In very high seismic zones, it may be desirable to go for a framed construction even in single or two-storeyed buildings (Indian building Congress, 2007). Moment-resisting reinforced concrete frames are widely used as prime elements or in conjunction with structural (shear) walls for resisting seismic forces (Xu and Niu, 2003).
Many low-rise and medium-rise framed buildings have been constructed in the recent past, without proper attention paid in their design for wind or earthquake loads. This serious shortcoming in structural design and detailing has been exposed by the recent earthquakes in various parts of the country. And, there is now an increasing awareness about the need to design explicitly for seismic loads, in conformity with the prevailing codes of practices (Indian building Congress, 2007).
3.2. Seismic Design of RC Frame Buildings
3.2.1. Conceptual design of RC frames for earthquake resistance
The general layout and certain details of the geometry of an individual plane frame have a major impact on its seismic behaviour. Very important also is the overall layout of the frames in a frame structural system. Any single plane frame should run continuously from one side of the building plan to the other, without offsets, interruptions (i.e. missing beams between adjacent columns in a floor), or indirect supports of beams on other beams (Fardis et al., 2015).
18 Foundations of the building have to be stronger than the columns and the columns need to be stronger than the beams to avoid the global collapse of the building. Usually, the main cause of failures is the failure of the columns, particularly in the lower storeys. Columns and beams have to be adequately reinforced and detailed to prevent shear or bending failure. Buildings with open ground storey are particularly unsafe, as the stresses in the ground floor columns are very severe. Columns in RC framed buildings may fail under an earthquake, either in shear or in bending. Shear failures occur mainly because the column sizes provided are inadequate to resist the seismic loads and also because of inadequate lateral ties provided. Bending (flexural) failures occur because of inadequate amount of steel bars provided vertically in the columns, particularly near the beam-column joints or column-foundation junctions, and may also occur due to poor quality of concrete (Indian building Congress, 2007).
According to (Fardis et al., 2015) The ideal plane frame has: 1. Constant beam depth in all bays of a storey
2. Constant size of each column in all storeys 3. Approximately uniform spans
4. Interior columns of approximately the same size 5. Approximately the same height in all storeys
3.2.2. Design of RC frame building for code provisions
All modern national seismic design codes converge on the issue of design methodology. These are based on a prescriptive Force Based Design approach, where the design is performed using a linear elastic analysis, and inelastic energy dissipation is considered indirectly, through a response reduction factor (or behavior factor). This factor, along with other interrelated provisions, governs the seismic design forces and hence the seismic performance of code-designed buildings. However, different national codes vary significantly on account of various specifications which govern the design force level. The response reduction factor, as considered in the design codes, depends on the ductility and overstrength of the structure. Building codes define different ductility classes and specify corresponding response reduction factors based on the structural material, configuration and detailing. Another important issue, which governs the design and expected seismic performance of a building, is control of drift. Drift is recognized as an important control parameter by all the codes; however, they differ regarding the effective stiffness of RC members. Further, the procedures to estimate drift and the allowable limits on drift also vary considerably (Khose, 2012).
Different codes differ not only with respect to the design base shear but also employ different load and material factors (or strength reduction factors) for the design of members, and hence, the actually provided strength in different codes does not follow the same pattern as the design base shear. This has direct effect on the expected performance of buildings designed using different codes. Further, the other provisions of codes also indirectly govern the seismic performance. In the era of globalisation, there is a need for convergence of design methodologies to result in buildings with uniform risk of suffering a certain level of damage or
19
collapse. A first step in this direction is to compare the expected seismic performance of buildings designed using the provisions of different codes. A detailed comparison of various provisions of different codes and design base shear coefficients obtained for a given hazard were conducted by the authors earlier (Khose, Singh and Lang, 2012).
Khose (Khose, 2012) extends the comparison further and presents a comparative study of the expected seismic performance of a ductile RC frame building designed for four major codes, viz. the U.S. American (ASCE 7-10, 2010), European (EN 1998-1, 2004), New Zealand (NZS 1170.5, 2004) and Indian code (IS 1893 - Part 1, 2002). The provisions of different codes regarding effective stiffness of RC members, procedure to estimate drift, and allowable drift limits are also compared to each other.
3.2.3. Building Ductility Classification According to code provisions
Currently, all seismic design codes take into account the effect of inelastic energy dissipation by reducing the design seismic force by a ‘response reduction factor’ (also called ‘behavior factor’). Values of response reduction factor are provided for different ductility classes of buildings. In addition to ductility, the response reduction factor also takes into account the effect of overstrength. The New Zeland seismic code (NZS 1170.5, 2004) considers a separate structural performance factor in addition to the ductility factor, which represents the combined effect of the limited number of cycles having peak amplitude, overstrength, redundancy, and over-capacity due to damping in secondary components and in the foundation. Further, only the New Zeland seismic (NZS 1170.5, 2004) considers the effect of period on the relationship between ductility and the response reduction factor. All other codes provide constant response reduction factors for a particular construction type, irrespective of the period of vibration. The EUA code (ASCE 7-10, 2010) classifies RC frame buildings into three ductility classes: Ordinary Moment Resisting Frame (OMRF), Intermediate Moment Resisting Frames (IMRF) and Special Moment Resisting Frames (SMRF). The European code, Eurocode 8 (EN 1998-1, 2004) classifies the building ductility as Low (DCL), Medium (DCM) and High (DCH). NZS 1170.5 classifies structures into three ductility classes, namely Ductile Structures (DS), for which the structural ductility factor is greater than 1.25 but less than 6, Structures of Limited Ductility (SLD), which is a subset of DS with structural ductility factor between 1.25 and 3, and Nominal Ductile Structures (NDS), for which the ductility factor is between 1 and 1.25. (IS 1893 - Part 1, 2002) classifies RC frame buildings as Ordinary Moment Resisting Frames (OMRF) and Special Moment Resisting Frames (SMRF) (Khose, 2012).
Seismic design codes either provide guidelines for the design and detailing of RC buildings for different ductility classes or refer to complimentary design codes. These provisions, in general, consist of four requirements: (i) capacity design provisions to achieve a hierarchy of strength in order to avoid brittle failure modes, (ii) provision of special confining reinforcement (in the form of closely-spaced stirrups) at potential plastic hinge locations, (iii) anchorage of beam longitudinal reinforcement into columns, and (iv) design of beam-column joints to avoid shear failure. Table 3.1 summarizes the different provisions in the codes for different ductility classes of RC frame buildings (Khose, 2012).
20 Table 3.1 Overview of ductile detailing requirements for RC frame buildings in different seismic design codes(Khose, Singh and Lang, 2012)
Ductile Detailing Criteria
ASCE 71) Eurocode 8 NZS 1170.52) IS 18933) O M RF IM RF SM R F D CL D CM DC H NDS SL D D S O M RF SM R F Capacity Design Strong Column Weak Beam ○ ○ ● ○ ● ● ○ ● ● ○ ○ Capacity Shear for Column ○ ● ● ○ ● ● ○ ● ● ○ ● Capacity Shear for Beam ○ ● ● ○ ● ● ○ ● ● ○ ● Special Confinement Reinforcement Column ○ ● ● ○ ● ● ○ ● ● ○ ● Beam ○ ● ● ○ ● ● ○ ● ● ○ ● Special Anchorage Requirement Interior Joint ○ ○ ● ○ ● ● ● ● ● ○ ● Exterior Joint ○ ○ ● ○ ● ● ● ● ● ○ ●
Joint Shear Design ○ ○ ● ○ ○ ● ● ● ● ○ ○
1) Ductile detailing as per (ACI, 2008) ○ provision is not available 2) Ductile detailing as per (NZS 3101:Part 1., 2006) and (NZS 1170.5, 2004) ● provision is available 3) Ductile detailing of OMRF and SMRF as per (IS 465, 2000) and (IS 13920, 1993), respectively.
It is evident from Table 3.1 that it is not possible to have a one-to-one parity between different ductility classes of various codes. However, three broad categories of ductility can be considered, as shown in Table 3.2, where each category includes building classes with similar ductility provisions. Figure 3.1 shows the response reduction/behavior factors for different ductility classes of RC frames, according to different codes. There is a large difference in reduction factors for long-period and short-period structures according to the New Zeland Code (NZS 1170.5, 2004), whereas, as mentioned above, other codes do not consider the effect of period on response reduction factors. The reduction factors for medium and high ductility classes of (ASCE 7-10, 2010), NZS 1170.5 (for long-period structures) and the Indian Standard (IS 1893 - Part 1, 2002) (no high ductility class is available) are close, whereas the corresponding reduction factors in Eurocode 8 are quite low. For low ductility class, the response reduction factors of NZS 1170.5 and Eurocode 8 are close, whereas the response reduction factors of ASCE 7 and IS 1893 are identical and twice as high as those of Eurocode 8 (Khose, 2012). Figure 3.2 comparing between the reduction behaviour factors of the provision codes mentioned above, for the same ductility levels.
21 Table 3.2 Different ductility categories of RC frame buildings(Khose, Singh and Lang, 2012)
Category Ductility classes
ASCE 7 Eurocode 8 NZS 1170.5 IS 1893
Low dissipative structures OMRF DCL NDS OMRF
Medium dissipative structures IMRF DCM SLD SMRF
High dissipative structures SMRF DCH DS -
Figure 3.1 Comparison of reduction/behavior factors recommended in different national codes (Khose, Singh and Lang, 2012).
22
3.2.4. Seismic Design for Ductility according to EC 8
The EN Eurocodes have certain built-in flexibility on key items controlling the level of safety, serviceability and durability offered by structures designed according to them, taking into account economy. These aspects are considered to lie within national authority. To facilitate national choice on these aspects without sacrificing harmonisation of structural design codes at the European level, as well as to accommodate geographic, climatic, etc., differences (including differences in the seismotectonic environment), the system of “Nationally Determined Parameters” (NDPs) has been devised and adopted in the EN Eurocodes. NDPs include symbols (e.g., safety factors, the mean return period of the design seismic action, etc.), technical classes (e.g., ductility classes), or even procedures or methods (e.g., alternative models of calculation). Alternative classes or procedures/ methods considered as NDPs are fully described in the normative text of the EN Eurocode. For NDP-symbols, the EN Eurocode may give an acceptable range of values and will normally recommend in a non-normative note a value to be used. It may also recommend a class or a procedure/method, among the alternatives identified in the EN Eurocode text as NDPs (Panagiotakos and Fardis, 2004).
Eurocode 8, allows three alternative ductility classes for RC structures, Ductility Class Low (DC L), Ductility Class Medium (DC M), and Ductility Class High (DC H), for each ductility class there are many design and detailing aspects such as; the size of columns and beams, and detailing and dimensioning rules for the longitudinal and transverse reinforcement, and also one of the important aspect is the mechanism of the joints between the columns and beams under the seismic forces.
DC L is the ductility class with the behavior factor value q =1.5 instead of q = 1.0, Buildings of DC L are not designed for ductility; only for strength. Except certain minimum conditions for the ductility of reinforcing steel, they have to follow just the dimensioning and detailing rules specified in Eurocode 2 for non-seismic actions.
Buildings of DC M or H have q-factor values higher than the default value of 1.5 used for DC L and considered as due to overstrength alone. DC H buildings enjoy higher values of q than DC M ones; in return, they are subject to stricter detailing rules and have higher safety margins in capacity design against shear. However, unlike DC L, DC M does not systematically require more steel than DC H: the total quantities of materials are essentially the same; in DC H, transverse reinforcement and vertical members have a larger share of the total quantity of steel than in DC M. DC M and H are expected to achieve about the same performance under the design seismic action, but DC M is slightly easier to design and implement and may give better performance in moderate earthquakes. DC H may provide larger safety margins than M against collapse under earthquakes (much) stronger than the design seismic action and may be more economic for high seismicity (Fardis et al., 2015).
23 In Eurocode 8 (EC8), the value of the behaviour factor, 𝑞𝑞, of DC M and H buildings depends on:
• Ductility Class
• The type of lateral-force-resisting-system
• The regularity or lack thereof of the structural system in elevation
The value of the 𝑞𝑞-factor is linked, indirectly (through the ductility classification) or directly, to the local ductility and detailing requirements for members.
According to Eurocode 8, Basic value, 𝑞𝑞𝑜𝑜, of behavior factor per EC8 for height-wise regular frame moment-resistant buildings is
Table 3.3 Basic value, qo, of behavior factor per EC8 for height-wise regular buildings
Lateral-load-resisting structural system: DC M DC H 1
Inverted pendulum 1.5 3
2
Torsionally flexible 2 3
3 Uncoupled wall system, not in one of the two
categories above 3 4αu/ αl
4
Any structural system other than the above 3αu/ αl 4.5αu/ αl
Where αu/α1 = 1.3 for multi-storey multi-bay frames or frame-equivalent dual systems.
3.2.5. Pros and Cons ofRC frames for earthquake resistance
Fardis (Fardis et al., 2015) mention that there are different advantages and disadvantages of using Rc frame building for earthquake resistance,
The advantages of using RC frames for earthquake resistance maybe summarised as follows:
1. Frames place few constraints on a building’s architectural design, including the façade. 2. Frames may be cost-effective for earthquake resistance, because beams and columns are placed anyway for gravity loads; so, they may also provide earthquake resistance in both horizontal directions, if their columns are large.
3. Two-way frame systems, comprising several multi-bay plane frames per horizontal direction, are highly redundant, offering multiple load paths.
4. Due to their geometry (notably their slenderness), beams and columns are inherently ductile, less prone to (brittle) shear failure than walls.
5. Frames with concentric connections and regular geometry have well-known and understood seismic performance, thanks to the numerous experimental and analytical studies carried out in the past; moreover, they are rather easy to model and analyse for design purposes.