Caracterização e Avaliação do Comportamento Mecânico de
Arames de NiTi para Endodôntica - Characterization and
Evaluation of Mechanical Behaviour of Endodontic-grade NiTi
Wires
Samuel Pereira
a, André Carvalho
b,c, Luís Reis
b, Manuel Freitas
b aInstituto Superior Técnico, Universidade de Lisboa, Av. Rovisco Pais 1, 1049-001, Lisboa, Portugal bIDMEC – Instituto Superior Técnico, Universidade de Lisboa, Av. Rovisco Pais 1, 1049-001, Lisboa, Portugal. c ISEL – Instituto Superior de Engenharia de Lisboa, Rua Conselheiro Emídio Navarro 1, 1959-007, Lisboa, PortugalE-mail address: samuel.p.pereira@tecnico.ulisboa.pt
Abstract
The orthodontic files have been used in dentistry since the middle ages and, as so, the shape, material and operation mode have changed since those days. In the late days, we have seen an increasing use of Nickel-Titanium (NiTi) alloys, to the detriment of more conventional alloys. At body temperature, these NiTi alloys present a superelastic behaviour, which allow the file to follow the teeth root in an easier way comparing to conventional alloys and have been reported to be more effective in the removal of the tooth pulp tissue, and in the protection of the tooth structure.
Notwithstanding, these NiTi instruments, as all the others being subjected to bending loading, they fracture without any visual signal of degradation. Thereby, there is a need of studying these alloys, as they present a high hysteresis cycle and a high non-linearity in the Elastic Domain.
Currently, there is not an international standard for these alloys, so various authors have attempted to design systems that can test NiTi endodontic files under fatigue loads, usually based on empirical setups.
Following a systematic approach, this work presents the results of rotary fatigue tests for two Alfa Aesar® Nitinol wires with different diameters (0,58mm and 0,25mm).
Keywords: Fatigue; Superelastic Alloys; NiTi wires; Life Evaluation
1. Introduction
In dentistry, the root canal procedure is done using a rotary file that removes the existing nerve endings on a tooth. In the past, endodontic files used in this procedure were made from highly flexible steel alloys. However, steel alloy files, while being flexible, are still too rigid to avoid damaging the walls of the root canals. In order to minimize these adverse effects, Nickel-Titanium alloys are now being used in the design of endodontic rotary files instead of stainless steel alloys. NiTi alloys are superelastic metal alloys able to fully recover from large deformations (up to strains of 10% [1]). These alloys, however, have a drawback when compared to steel files their fatigue life is relatively shorter than steel and, seen in commercial endodontic files, they break without a previous mechanical warning, increasing the risk of the file failing inside the teeth.
There are some studies to determine the fatigue life of NiTi alloys, through traditional uniaxial fatigue tests and rotary bending fatigue tests [2]. Rotary bending tests are the tests that most accurately replicate the kind of loads and deformation a file is subjected to when inside a root canal. The great majority of the existing machines in the literature only perform the fatigue test with a predetermined set of shapes. However, most of the imposed deformations are far from the complex shapes of the root canals [2].
Of special interest is the rotary fatigue machine designed by Cheung and Darvell [4]. This machine consists of three pins that can be positioned manually to deform the endodontic file. The file is then put into rotation using a contra-angle. This type of machine has an advantage of being more versatile than the more common machines with simulated canal carved in a stainless-steel plate, where one can have only one predetermined curvature per plate [6-9]
In this work, an automated configurable rotary bending-testing machine was designed. This testing machine was designed to adapt and change the degree of bending from simple point bending to more complex multi-point bending. The machine consists in three pairs of pins positioned by servomotors, which deform the specimen into a desired complex shape. The specimen is then put into rotation until failure is detected.
The machine design also enables rotary bending tests with constant curvature (constant strain) along a segment. With a constant strain, one can compare directly the result with the more common uniaxial fatigue tests. Also, one can perform tests in different regions of the superelastic stress-strain curve, enabling an estimation of the stress and the metallic phase of the alloy during the test
2. Material and Methodology 2.1. Material
To perform the rotating fatigue four-point bending tests two NiTi alloy wires (Alfa Aesor® Nitinol wire) are used. One with a diameter of 0,58mm and the other with a diameter of 0,25 mm, both straight annealed and with an oxide surface. [5]
2.2. Machine Design
The experimental tests were performed in a testing machine designed by Carvalho, André et al. [3] based in the machine presented by Cheung and Darvell [4]. The machine has three pins that can be configured to preform from 1- to 4-point bending test. In figure 1 and 2 can be seen the test machine before starting the bending; and the tree pins in test configuration, respectively.
For the rotation of the specimens, a brushless DC motor with variable speed is used instead of the more common contra-angle. With a standalone DC motor, one can control the velocity of the test more precisely and automatically. The motor is able to do tests from 100rpm (1,667Hz) to 3000rpm (50Hz), which covers the range of most NiTi endodontic files with a drive speed usually between 150 and 500rpm.
To detect the specimen failure (whether it is wire or an endodontic file), an electronic failure detection system was implemented. This system uses the natural conductivity of NiTi alloys to any failure by constantly monitoring the level of voltage between the specimen and each pin. When the circuit is open it means that the specimen failed, and the test stops automatically (figure 3).
Figure 1 Test machine with an endodontic file [3] Figure 2 Test machine with the tree pins in a testing configuration
Figure 3 Fail detection circuit, where ”R” are resistances to stabilize the circuit ground and ”MCP” are the micro-processor ports [3]
2.3. Beam Model
To model the beam, one uses the Euler-Bernoulli beam theory, according to the equation (1)
(1)
Where q(x) is the distributed transverse load, E is the Young’s Modulus, I is the second moment of area of the cross section, x is the dimension across the length of the beam and w is the beam deflection.
Since, there are no distributed transverse loads (only point loads), equation (1) reduces to:
𝑑4𝑤
𝑑𝑥4
= 0
(2)Solving (2) one obtains a complete fourth-order polynomial (3).
𝑤(𝑥) =1 6𝑐1𝑥 3+1 2𝑐2𝑥 2+ 𝑐 3𝑥 + 𝑐4 (3)
Using the boundary conditions (4) one can solve the obtained polynomial. For this machine, the specimen is divided into four sub problems, as shown in figure 4, with each section having its own set of coefficients for (3). {𝑤(𝑥0) = 0 𝑤′(𝑥0) = 0 { 𝑤(𝑥1−) = 𝑤(𝑥1+) = 𝑊1 𝑤′(𝑥1−) = 𝑤′(𝑥1+) 𝑤′′(𝑥1−) = 𝑤′′(𝑥1+) { 𝑤(𝑥2−) = 𝑤(𝑥2+) = 𝑊2 𝑤′(𝑥2−) = 𝑤′(𝑥2+) 𝑤′′(𝑥2−) = 𝑤′′(𝑥2+) (4a) (4b) (4c) { 𝑤(𝑥3−) = 𝑤(𝑥3+) = 𝑊3 𝑤′(𝑥3−) = 𝑤′(𝑥3+) 𝑤′′(𝑥3−) = 𝑤′′(𝑥3+) {𝑤′′(𝑥4) = 0 𝑤′′′(𝑥4) = 0 (4d) (4e)
where W1, W2 and W3 are the imposed deflections and “+” and “-” represent the right and left sides of the points, respectively. With all 16 parameters calculated, one has the deflection curve of the specimen and can proceed to calculate the deflection for a constant curvature.
𝜀𝑥= −𝑧 𝑑2𝑤
𝑑𝑥2 (3)
2.4. Constant Curvature Generation for Wire Specimens
The main advantage of having a constant curvature in a uniform beam is that in that region the strain is also constant and proportional to the radius as in (5)
𝜀𝑥= −𝑧 1 𝜌 (5)
𝐸𝐼
𝑑
4𝑤
𝑑𝑥
4= 𝑞(𝑥)
Figure 4 Beam model of the specimen, where 𝑥0 is the clamped end of the specimen; 𝑥1, 𝑥2 and 𝑥3 are the
where ρ is the radius curvature, 𝜀𝑥 is the strain along the length of the beam and z is the distance to the
neutral surface (figure 5)
For an infinitesimal element (5) becomes
𝜀𝑥 = −𝑧 𝑑2𝑤
𝑑𝑥2 (6)
which can be applied to (3) resulting the strain profile of the specimen along its length. Imposing the following condition:
𝜀𝑥(𝑥1) = 𝜀𝑥(𝑥2) = 𝜀𝑑 (7)
Where 𝜀𝑥(𝑥) results from applying (6) into (3) and 𝜀𝑑 is the desired strain; results in a constant strain
level in the second section of the specimen (figure 4).
From the condition (7), two displacement values can be extracted:
𝑊2 = 𝑥1𝜀𝑑(𝑥12−3𝑥1𝑥2+2𝑥22)−2𝑊1𝑧(𝑥1−3𝑥2)
4𝑥1𝑧 (8a)
𝑊3 = 𝑥1𝜀𝑑(3𝑥12−9𝑥1𝑥3−2𝑥22+4𝑥2𝑥3+4𝑥32)−6𝑊1𝑧(𝑥1−3𝑥3)
12𝑥1𝑧 (8b)
The equations (8) only give two displacements out of three and an extra constraint must be supplied. As no other equation given by the Euler-Bernoulli model gives any extra usable information, so the last displacement (W1) must be obtained by indirect means.
The parameter W1 gives the amount of deflection imposed to the specimen in the first section, just after the clamp. Since we can obtain W2 and W3 that result in a constant strain level for any W1, the overall deflection of the specimen can be controlled by this parameter. The cost function for the optimization is a standard square minimum:
𝐶(𝑊1, 𝑊2, 𝑊3) = 𝑊12+ 𝑊22+ 𝑊32 (9)
where C is the cost function value, W1 is the optimization variable and W2 and W3 are given by (8). The resulting cost function is algebraic to W1 and the result obtain is:
𝑊1 =𝑥1𝜀𝑑(6𝑥1 3−18𝑥 12(𝑥2+𝑥3)+𝑥1(31𝑥22+4𝑥2𝑥3+31𝑥32)) 18𝑧(2𝑥12−2𝑥1(𝑥2+𝑥3)+3(𝑥22+𝑥32)) − 6𝑥1𝜀𝑑(3𝑥23−𝑥22𝑥3+2𝑥2𝑥32+2𝑥33) 18𝑧(2𝑥12−2𝑥1(𝑥2+𝑥3)+3(𝑥22+𝑥32)) (10)
Figure 5 Wire cross-section, where r is the wire radius, y is the axis of the bending moment
Equations (8) and (10) give us the positions of the application points the neutral surface. However, the wire and the endodontic files have finite thickness and due to that the actual positions of the pins must be adjusted accordingly.
The position of the pins must take into account the influence of thickness in the position and the requirement that the wire must be tangent to the pins at all times. This leads to a variable distance between the contact point at the surface and the neutral surface. This is done in two steps: first we find and offset of the neutral surface that passes by the centre of the pins (the pins have a diameter of 2mm at the contact point), then the following equation must be solved:
(𝑟 + 1) sin(arctan(𝑤′(𝑡))) + 𝑡 = 𝑥
𝑝𝑖𝑛 (11)
where r is the radius of the wire, w’ is the first derivative of the beam deflection, t is a parameter that follows the length (at the neutral surface and considering that there is no axial deformation t ≈ x) and 𝑥𝑝𝑖𝑛 is the
position of the pin (measured form the clamping point).
The resulting t from (11) when replaced on the offset curve gives the position of the pin. This equation must be solved numerically and each time a new deformation is calculated.
3. Results for NiTi Wire 3.1. Uni-axial Tension Test
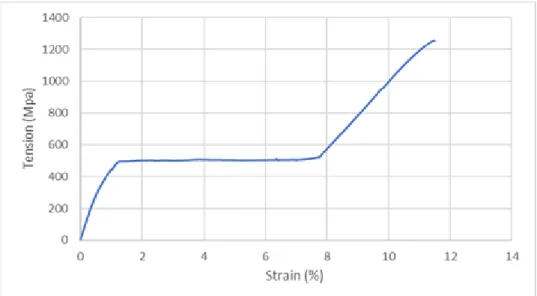
Before the rotary fatigue tests, the 0.58 specimen was tested under an uni-axial tension test and the results can be seen in figure 5. In this figure can be seen three distinct regions: the first one, from 0% to 1,2% strain, occurs when the specimen is completely in the austenitic phase; the second one, from 1,2% to 7,65% strain, occurs when there is a transformation from austenite to martensite of the specimen; the third one, from 7,65% strain to the specimen rupture, occurs when the specimen is already completely in the martensitic phase.
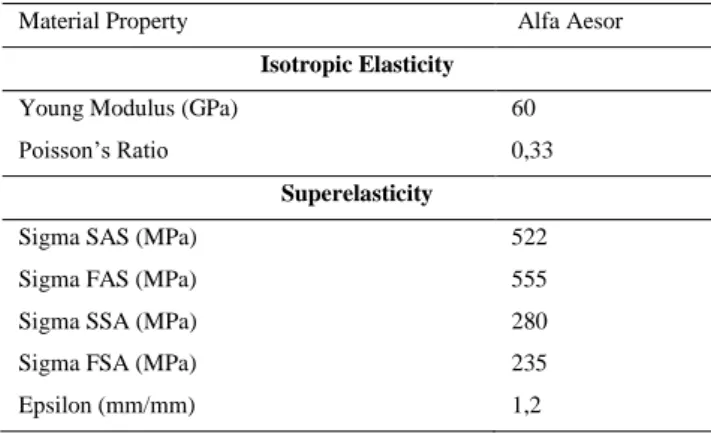
Also, the specimen was subjected to one full hysteresis cycle and, as the fatigue tests were performed to a maximum of 5% strain, the specimen was subjected to a hysteresis cycle to a maximum of 6% strain, which can be seen in figure 6. The material properties obtained can be seen in table 1.
Table 1 List of Material Properties to Alfa Aesor
Material Property Alfa Aesor
Isotropic Elasticity
Young Modulus (GPa) 60
Poisson’s Ratio 0,33
Superelasticity
Sigma SAS (MPa) 522
Sigma FAS (MPa) 555
Sigma SSA (MPa) 280
Sigma FSA (MPa) 235
3.2. Fatigue Test
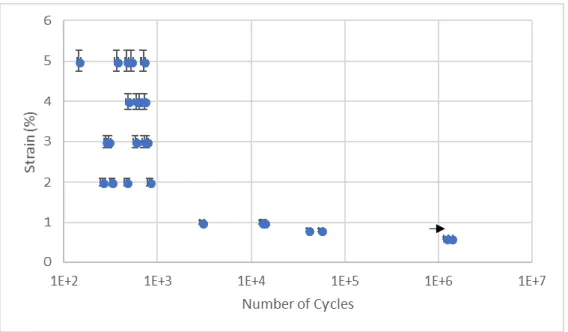
For the wire of 0.58mm diameter, the fatigue tests were performed on a range of maximum strain from 0.6% to 5%. These results can be seen in figure 7.
The specimens with strain under 1%, that correspond to the austenitic region, show a large fatigue life, comparing with the rest of points. More specifically, the 0.6% strain specimens, showed an infinite fatigue life.
The specimens with strains equal to and above of 1% show a fatigue life nearly constant, in the order of magnitude of 102. The specimen with the shortest life time failed after 145 cycles.
Figure 6 Uni-axial tension test with one hysteresis cycle to the Alfa Aesor Nitinol wire with 0.58mm diameter Figure 5 Uni-axial tension test to the Alfa Aesor Nitinol wire with 0.58mm diameter
For the specimens with 0.25mm diameter, the fatigue tests were performed with a strain range from 0.6% to 3%, for greater strains the specimens exhibit a behaviour similar to a rope as the wire would be straight between a pair of pins, and between the first pin and the clamp, and the maximum strain would occur in the pins as the radius curvature would be similar to the pin radius. These results can be seen in figure 8.
The specimens with strain under 1%, that correspond to the austenitic region, show a large fatigue life, comparing with the rest of points with some specimens showing an infinite fatigue life.
The specimens with strains equal to and above of 1% show a decreasing fatigue life as the maximum imposed strain increases. The specimen with the shortest life time failed after 1989 cycles.
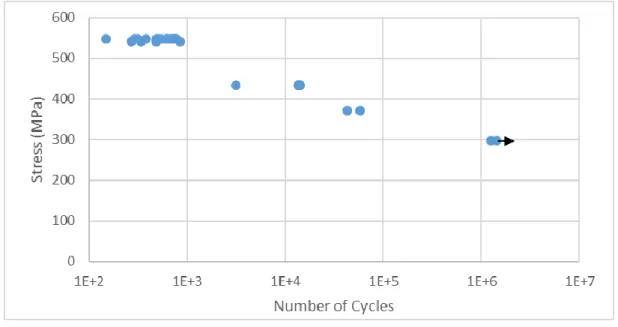
Combining the results from the tension test and the fatigue tests, ones obtain the results for Stress vs. Life Time presented in figures 9 and 10.
Figure 7 Strain vs. Life Time for the 0,58mm wire
3.3. Fracture Surfaces
The fracture surfaces resulting from the fatigue tests and from the traction test are significantly different. The first ones present a flat surface, as usually observed in failed specimens under rotating bending conditions.
After a closer looking on a Scanning Electron Microscope (SEM), JEOL existent at MicroLab from IST, ones could see that, first of all, the alloy tested, for both diameters, showed some porosities (figure 11) that act like sites of stress concentration where the crack initiation can occur. Also, after the rupture, the material presents a well-seen granular surface through which the fatigue fracture grew.
Figure 9 Stress vs. Life Time for the 0,58mm wire
The analysis of broken specimens from different strain levels showed that, for the thickest wire, the specimens with maximum strain above 2% showed a similar size of crack propagation zone before the final rupture (figures 12a – 12c), which is in line with the results obtained in the fatigue tests. For the tests of 2% maximum strain, a bigger crack growth size can already be seen (figure 12d); and for the tests below this strain value (1% and bellow), the size of the crack growth is substantially greater than the others (figures 12e and 12f).
Figure 11 – Detail of the porosities found in the alloy (2000x magnification)
Figure 12a – Specimen that failed at 369 cycles for maximum strain of 5% (140x magnification)
Figure 12b – Detail of the specimen from figure 12a where can be seen the crack propagation zone (300x magnification)
Figure 12c – Specimen that failed at 746 cycles for maximum strain of 3% (140x magnification)
Figure 12d – Specimen that failed at 474 cycles for maximum strain of 2% (140x magnification)
For the specimens with 0,25mm of diameter, the analysis in the SEM showed that the crack propagation zone increases as the maximum strain decreases (and the life time increases). In figure 13 can be seen the fracture surface of a specimen from maximum strain of 2%, with the crack propagation zone on the bottom part.
4. Conclusions
5. References
[1] D. Montalvão, F. Alçada, F. Fernandes, S. Correia; “Structural Characterisation and Mechanical FE Analysis of Conventional and M-wire Ni–Ti Alloys Used in Endondontic Rotary Instruments”, The Scientific World Journal: Materials Science 2014 (2014)
[2] G. Plotino, N. M. Grange, M. Cordaro, L. Testarelli, G. Gambarini; “A Review of Cyclic Fatigue Testing of Nickel-Titanium Rotary Instruments”, Cyclic Fatigue or Rotary Instruments 35 (2009) 1469–1476. [3] A. Carvalho, M. Freitas, L. Reis, D. Montalvão, M. Fonte; “Rotary Fatigue Testing Machine to Determine the Fatigue Life of NiTi Alloy Wires and Endondontic Files” (2015)
[4] G.S.P. Cheung, B.W. Darvell; “Fatigue testing of a NiTi rotary instrument. part 1: strain-life relationship”; International Endondontic Journal 2007 (2007)
[5] Alfa Aesor by Thermo Fisher Scientific;
https://www.alfa.com/pt/nitinol-nickel-titanium-shape-memory-alloys/; Accessed 25/03/2018
[6] G. Plotino, N.M. Grange, M.C. Melo, M.G. Bahia, L. Testarelli, G. Gambarini; “Cyclic Fatigue of NiTi Rotary Instruments in a Simulated Apical Abrupt Curvature”. International Endondontic Journal (2010) Figure 12e – Specimen that failed at 13200 cycles for a maximum
strain of 1% (140x magnification)
Figure 12f – Detail of the specimen from figure 12e where can be seen the crack propagation zone (300x magnification)
Figure 13 - Specimen that failed at 15110 cycles for a maximum strain of 2% (300x magnification)
[7] H.P. Lopes, I.M.O. Britto, C.N. Elias, J.C.M. de Oliveira, M.A.S. Neves, E.J.L. Moreira, et al.; “Cyclic Fatigue resistance of ProTaper Universal Instruments When Subjected to Static and Dynamic Tests”, Oral Surg Oral Med Oral Pathol Oral Radiol Endod (2010)
[8] G. Gambarini, R. Gergi, A. Naaman, N. Osta, D. Al Sudani; “Cyclic Fatigue Analisys of Twisted File Rotary NiTi Instruments Used in Reciprocating Motion”, International Endondontic Journal 2012; [9] G. De-Deus, E.J.L. Moreira, H.P. Lopes, C.N. Elias; “Extended Cyclic Fatigue Life of F2 ProTaper Instruments Used in Reciprocating Movement”, International Endondontic Journal (2010)
![Figure 3 Fail detection circuit, where ”R” are resistances to stabilize the circuit ground and ”MCP” are the micro-processor ports [3]](https://thumb-eu.123doks.com/thumbv2/123dok_br/16022182.1104296/2.892.129.428.348.578/figure-detection-circuit-resistances-stabilize-circuit-ground-processor.webp)


