António Afonso, Jorge Silva
Current account balance cyclicality
WP20/2016/DE
_________________________________________________________
Department of Economics
WORKING PAPERS
ISSN 2183-18151
Current account balance cyclicality
*
António Afonso,
$Jorge Silva
+ #Abstract
We assess the cyclicality of current account balances for the period 2001Q1-2014Q4, focussing on Portugal and in Germany, as a benchmark. We find that the cyclical component of the current account was positively explained by 3-months Euribor, but negatively by the financial crisis, systemic stress in Europe, employment and compensation of employees. Moreover, the non-cyclical current account was positively affected by the period of the Economic and Financial Adjustment Program and the terms of trade, but negatively influenced by financial integration.
Keywords: current account cyclicality, financial markets, Portugal, Germany. JEL: C23, F32, G01.
* The opinions expressed are those of the authors and not necessarily those of the respective employers. $ ISEG/UL - University of Lisbon, Department of Economics; UECE – Research Unit on Complexity and
Economics. UECE is supported by Fundação para a Ciência e a Tecnologia (Portuguese Foundation for Science and Technology). email: [email protected].
+ ISEG/UL – University of Lisbon, email:[email protected].
2
1. Introduction
We study the decomposition of current account between cyclical and non-cyclical component, and assess their determinants, focussing on Portugal, and using Germany as a benchmark. As a main motivation, the fact that current account balances are paramount for the sustainability of the international investment position of a country.
For instance, Blanchard (2007) discussed the challenges of Portugal from the beginning of the euro area – low growth of GDP and productivity, high unemployment, large fiscal and current account deficits.
Chen et al. (2013) analysed notably international trade patterns and financial movements of euro area deficit countries. The international trade path of the past decade was favourable to core eurozone countries contrary to European deficit ridden countries. Investors from the rest of the world favoured purchasing financial instruments issued by countries such as Germany and France. Therefore, the external financing of euro area deficit countries, which reported persistent imbalances, came from core eurozone countries.
Lane and Milesi-Ferretti (2012) studied current account imbalances before the 2008 financial crisis in 65 advanced economies and emerging markets. Widening current account imbalances until 2008 were explained by rising oil prices, credit booms and asset price bubbles, and easy external financing conditions. In the case of countries with pre-crisis current account balances in “excess deficit” deviation (i.e. large negative gap between actual current account and model-fitted values), there was evidence of the largest contractions in their external accounts, while the real exchange rate was a destabilizing (stabilizing) factor across pegged (non-pegged) currencies. Moreover, the external assistance and ECB liquidity softened the outflow of private capital from the euro area deficit countries.
Hobza and Zeugner (2014) built a database of bilateral financial stocks and flows among euro area countries for the period 2001-2012. They report that current account deficits of the euro area periphery countries were almost exclusively financed from the rest of the euro area, mostly surplus countries but also France and the UK as intermediaries of flows; a large share of financing was based on debt instead of equity; France became the main financing country in 2009 of the deficit countries after the withdrawn of funding from surplus countries, mainly Germany.
Interestingly, bilateral net trade was not a good indicator of bilateral financial flows. The surplus countries of the euro area financed the periphery by more than their bilateral
3
trade balances, i.e. there were intermediated flows from the rest of the world. There was a sudden stop from 2010 onwards of private financial flows from the surplus countries to the deficit countries.
During the period 2004-2006 there were outflows from Germany and Benelux to the periphery. However, throughout the periods 2007-2009 and 2010-2012 there was a reversion of the bilateral gross flows, i.e. countries sold foreign assets to generate liquidity.
Kollmann et al. (2015) studied the German current account during the period 1995-2015. The German surplus reflected: a positive impact to the German saving rate due to changes in the retirement system that provided new incentives for private pension saving; demand for German exports by the rest of the world (ROW) due to positive shocks to the ROW; German labour market reforms via unemployment benefit cuts; and other aggregate supply shocks such as total factor productivity increase.
Our results for Portugal show that the cyclical component of the current account balance was negatively determined by the financial crisis, the variations of employment and compensation of employees, and the systemic stress in Europe, but positively by the 3-month Euribor. The non-cyclical component was explained positively by the period of the economic and financial adjustment programme (EFAP) and the variation of terms of trade, but negatively by the increase of financial integration in the euro area.
Furthermore, those determinants are less statistically significant for Germany, hinting to country specific factors as relevant drivers of the components of current account balance.
2. Methodology and data
We follow the decomposition of the current account-to-GDP ratio used by Salto and Turrini (2010) that identifies the impact of national and foreign output gaps as well as the effect of the real exchange rate on the non-cyclical current account balance, ݑܿܽ௧:1
ݑܿܽ௧ =ܲܥܣ௧ ௧ܻ௧+ ߠெ ܲ௧ெܯ௧ ܲ௧ܻ௧ ∗ ܻ௧− ܻ௧∗ ܻ௧∗ − ߠ௫ܲ௧ ெܺ ௧ ܲ௧ܻ௧ ∗ ܻ௧ி− ܻ௧ி∗ ܻ௧ி∗ + + ൬ ߟ௫− ಾெ ߟெ൰ ሺ0.4 ∗ ∆ݎ݁݁ݎ௧+ 0.15 ∗ ∆ݎ݁݁ݎ௧ିଵሻ. (1)
4
where ܥܣ௧ is the nominal current account, ܲ௧ܻ௧ denotes nominal GDP, and ܲ௧ெܯ௧ and ܲ௧ெܺ௧ are nominal imports and exports, respectively. Additionally, ߠெ and ߠ௫ are the income elasticity of imports and exports, ݎ݁݁ݎ௧ real effective exchange rate, ߟ௫ andߟெ denote the elasticities of exports and imports with respect to the REER. ܻ௧− ܻ௧∗andܻ௧ி− ܻ௧ி∗are national and foreign output gaps, respectively.
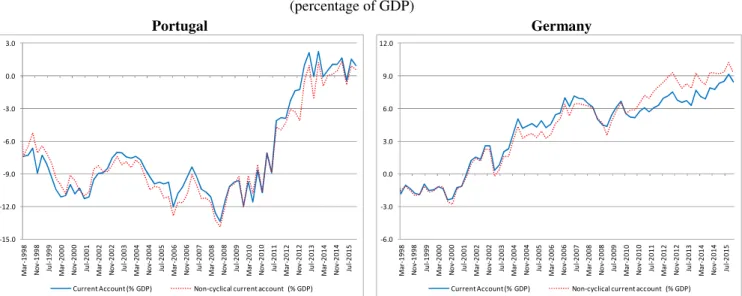
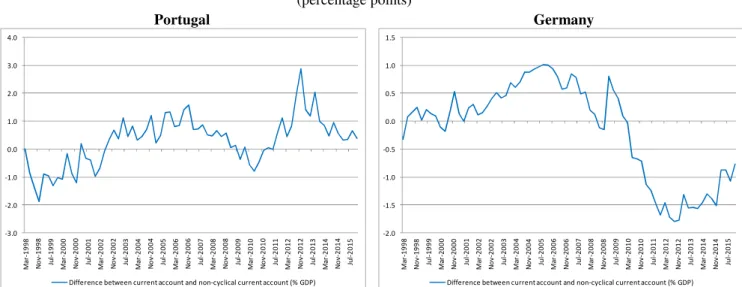
During the period 1996Q1-2015Q4, the average current account balance in Portugal was -7% of GDP, which improved since the EFAP. Figure 1 splits the cyclical and non-cyclical components of current account balances in Portugal and Germany. Figure 2 details the cyclical component of the current account, the difference between the current account and the non-cyclical current account, which was positive during the period 2002Q3-2009Q3 and 2011Q3-2015Q4.
[Figure 1] [Figure 2]
Figure 3 presents the contribution of the exchange rate, imports and exports for the cyclical component of the current account. The Portuguese imports effect presented more variance than the exports effect. For example, the imports effect explained a higher cyclical component during the period 2008Q4-2015Q4, while during 1998Q1-2002Q4 it determined a lower cyclical component.
[Figure 3]
According to economic theory, we have included external and domestic explanatory variables:
• Financial volatility: composite indicator of systemic stress (CISS), a measure of financial stress in Europe and VIX as a proxy for global financial volatility; • Financial fragmentation/integration: the share of Monetary and Financial
Institutions (MFI) cross-border holdings of the euro area sovereign debt securities; • Domestic factors: employment, income and compensation of employees.
Moreover, we use control variables related with the interest rates and financial markets, employment, compensation employees and available income.
5
3. Empirical analysis
We need to estimate our specifications in first differences to avoid non-stationaryof the dependent variable. The baseline model, where the cyclical and non-cyclical components are the dependent variables, is:
ܿݕ݈݈ܿ݅ܿܽ௧ =ܲܥܣ௧ ௧ܻ௧−ݑܿܽ௧−= ߚ0+ ߚ1ܺݐ ݀݉݁ݏݐ݅ܿ+ ߚ 2ܼݐ݁ݔݐ݁ݎ݈݊ܽ+ ݑݐ (2) ݑܿܽ௧ = ߙ0+ ߙ1ܹݐ݀݉݁ݏݐ݅ܿ+ ߙ2ܳݐ݁ݔݐ݁ݎ݈݊ܽ+ ݒݐ (3)
where ܺ௧ௗ௦௧ and ܹ௧ௗ௦௧ are domestic independent variables sets; and ܼ௧௫௧ and ܳ௧௫௧ are external independent variables sets. Table 1 and 2 identify the independent variables for Portugal and Germany.
The following determinants are statistically significant for the components of the Portuguese current account:
• Cyclical (Table 1): financial crisis since 2009, systemic stress in Europe, terms of trade, employment, compensation of employees, 3-month Euribor, S&P 500 and VIX;
• Non-cyclical (Table 2): EFAP period, terms of trade, financial integration/fragmentation of the euro area sovereign debt.
In the case of Germany, the econometric results are weaker.2
Concerning the cyclical component, regression (5) shows a negatively statistically impact from: the period since the 2009 financial crisis (-0.82p.p.), the y-o-y growth of compensation employees (-0.15p.p.), systemic stress (-2.02p.p.), and the y-o-y variation of employment (-0.11p.p.). On the positive side, a y-o-y variation of 3-months Euribor (100 basis points) increased the cyclical component of the current account (0.36p.p.). Variations of VIX, S&P 500 and terms of trade are statistically significant, but close to zero.
[Table 1]
Regarding the Portuguese non-cyclical component, regression (5) shows there was a positive impact during the period of the EFAP (2.34p.p.) and the y-o-y variation of terms
2 The estimations for Germany include a first-order autoregressive coefficient of the error term (ρ) to solve
6
of trade improved the non-cyclical component (0.47p.p.). On the other side, higher financial integration (1p.p.) reduced the non-cyclical current account (-0.29p.p.). Therefore, capital flows from abroad to Portugal allowed financing the current account deficit, but ended with the sudden stop. However, other variables proved not statistically significant: employment, compensation employees, financial crisis, systemic stress, disposable income and 3 months-Euribor. In the case of Germany, the financial integration determinant was not statistically significant.
[Table 2]
4. Conclusions
We studied the determinants of the cyclical and non-cyclical components of the current account balance ratio, focussing on external and domestic factors and financial variables during the period 2001Q1-2014Q4. We assessed Portugal’s case - a small euro area open economy, coupled with Germany – the largest economy of the euro area.
Our results show that the cyclical component of the current account balance in Portugal was negatively influenced by the 2009 financial crisis, the evolution of employment and compensation of employees, and systemic stress in Europe, but positively by the 3-months Euribor.
In addition, the non-cyclical component was positively explained by the period of the EFAP, improvement of terms of trade, but negatively by the financial integration of the euro area. During the period of improvement of the non-cyclical current account balance, the increase of the non-cyclical exports-to-GDP ratio was stronger than the increase of the non-cyclical imports-to-GDP ratio.
When compared with Germany, external factors had more impact for the Portuguese cyclical and non-cyclical components.
5. References
Blanchard, O. (2007). Adjustment within the euro. The difficult case of Portugal.
Portuguese Economic Journal 6(1), 1-21.
Chen, R., Milesi-Ferretti, G., Tressel, T. (2013). Eurozone external imbalances. Economic
Policy, 28(73), 101-142.
European Central Bank. (2014). Financial integration in Europe.
European Commission. (2014). The cyclical component of current-account balances.
7
Hobza, A., Zeugner, S. (2014). The ‘imbalanced balance’ and its unravelling: current accounts and bilateral financial flows in the euro area. European Commission:
Economic Papers 520.
Kollmann, R., Ratto, M., Roeger, W., Veld, J. i., Vogel, L. (2015). What drives the German current account? And how does it affect other EU Member States?
Economic Policy, 30(81), 47-93.
Lane, P. R., Milesi-Ferretti, G. M. (2012). External adjustment and the global crisis.
Journal of International Economics, 88, 252-265.
Reis, R. (2013). The Portuguese Slump and Crash and the Euro Crisis. Brookings Papers
on Economic Activity, 46, 143-193.
Salto, M., Turrini, A. (2010, September). Comparing alternative methodologies for real exchange rate assessment. DG ECFIN, European Commission, 427.
Figure 1 – Current account and non-cyclical current account balance
(percentage of GDP)
Portugal Germany
Sources: Banco de Portugal, Statistics Portugal, Deutsche Bundesbank, Destatis, Eurostat and own calculations.
-15.0 -12.0 -9.0 -6.0 -3.0 0.0 3.0 M a r-1 9 9 8 N o v -1 9 9 8 Ju l-1 9 9 9 M a r-2 0 0 0 N o v -2 0 0 0 Ju l-2 0 0 1 M a r-2 0 0 2 N o v -2 0 0 2 Ju l-2 0 0 3 M a r-2 0 0 4 N o v -2 0 0 4 Ju l-2 0 0 5 M a r-2 0 0 6 N o v -2 0 0 6 Ju l-2 0 0 7 M a r-2 0 0 8 N o v -2 0 0 8 Ju l-2 0 0 9 M a r-2 0 1 0 N o v -2 0 1 0 Ju l-2 0 1 1 M a r-2 0 1 2 N o v -2 0 1 2 Ju l-2 0 1 3 M a r-2 0 1 4 N o v -2 0 1 4 Ju l-2 0 1 5
Current Account (% GDP) Non-cyclical current account (% GDP)
-6.0 -3.0 0.0 3.0 6.0 9.0 12.0 M a r-1 9 9 8 N o v -1 9 9 8 Ju l-1 9 9 9 M a r-2 0 0 0 N o v -2 0 0 0 Ju l-2 0 0 1 M a r-2 0 0 2 N o v -2 0 0 2 Ju l-2 0 0 3 M a r-2 0 0 4 N o v -2 0 0 4 Ju l-2 0 0 5 M a r-2 0 0 6 N o v -2 0 0 6 Ju l-2 0 0 7 M a r-2 0 0 8 N o v -2 0 0 8 Ju l-2 0 0 9 M a r-2 0 1 0 N o v -2 0 1 0 Ju l-2 0 1 1 M a r-2 0 1 2 N o v -2 0 1 2 Ju l-2 0 1 3 M a r-2 0 1 4 N o v -2 0 1 4 Ju l-2 0 1 5
8
Figure 2 – Difference between current account and non-cyclical current account balance (i.e. cyclical component)
(percentage points)
Portugal Germany
Sources: Banco de Portugal, Statistics Portugal, Deutsche Bundesbank, Destatis, Eurostat and own calculations.
Figure 3 – Contribution to the cyclical component of current account balance
(percentage of GDP)
Portugal Germany
Source: Banco de Portugal, Statistics Portugal, Deutsche Bundesbank, Destatis, Eurostat and own calculations. Cyclical component = Exports effect – imports effect – REER effect.
-3.0 -2.0 -1.0 0.0 1.0 2.0 3.0 4.0 M a r-1 9 9 8 N o v -1 9 9 8 Ju l-1 9 9 9 M a r-2 0 0 0 N o v -2 0 0 0 Ju l-2 0 0 1 M a r-2 0 0 2 N o v -2 0 0 2 Ju l-2 0 0 3 M a r-2 0 0 4 N o v -2 0 0 4 Ju l-2 0 0 5 M a r-2 0 0 6 N o v -2 0 0 6 Ju l-2 0 0 7 M a r-2 0 0 8 N o v -2 0 0 8 Ju l-2 0 0 9 M a r-2 0 1 0 N o v -2 0 1 0 Ju l-2 0 1 1 M a r-2 0 1 2 N o v -2 0 1 2 Ju l-2 0 1 3 M a r-2 0 1 4 N o v -2 0 1 4 Ju l-2 0 1 5
Difference between current account and non-cyclical current account (% GDP)
-2.0 -1.5 -1.0 -0.5 0.0 0.5 1.0 1.5 M a r-1 9 9 8 N o v -1 9 9 8 Ju l-1 9 9 9 M a r-2 0 0 0 N o v -2 0 0 0 Ju l-2 0 0 1 M a r-2 0 0 2 N o v -2 0 0 2 Ju l-2 0 0 3 M a r-2 0 0 4 N o v -2 0 0 4 Ju l-2 0 0 5 M a r-2 0 0 6 N o v -2 0 0 6 Ju l-2 0 0 7 M a r-2 0 0 8 N o v -2 0 0 8 Ju l-2 0 0 9 M a r-2 0 1 0 N o v -2 0 1 0 Ju l-2 0 1 1 M a r-2 0 1 2 N o v -2 0 1 2 Ju l-2 0 1 3 M a r-2 0 1 4 N o v -2 0 1 4 Ju l-2 0 1 5
Difference between current account and non-cyclical current account (% GDP)
-4.5 -3.0 -1.5 0.0 1.5 3.0 M a r-1 9 9 8 O c t-1 9 9 8 M a y -1 9 9 9 D e c -1 9 9 9 Ju l-2 0 0 0 F e b -2 0 0 1 S e p -2 0 0 1 A p r-2 0 0 2 N o v -2 0 0 2 Ju n -2 0 0 3 Ja n -2 0 0 4 A ug -2 0 0 4 M a r-2 0 0 5 O c t-2 0 0 5 M a y -2 0 0 6 D e c -2 0 0 6 Ju l-2 0 0 7 F e b -2 0 0 8 S e p -2 0 0 8 A p r-2 0 0 9 N o v -2 0 0 9 Ju n -2 0 1 0 Ja n -2 0 1 1 A ug -2 0 1 1 M a r-2 0 1 2 O c t-2 0 1 2 M a y -2 0 1 3 D e c -2 0 1 3 Ju l-2 0 1 4 F e b -2 0 1 5 S e p -2 0 1 5
Imports effect Exports effect reer effect
-4.5 -3.0 -1.5 0.0 1.5 3.0 M a r-1 9 9 8 O c t-1 9 9 8 M a y -1 9 9 9 D e c -1 9 9 9 Ju l-2 0 0 0 F e b -2 0 0 1 S e p -2 0 0 1 A p r-2 0 0 2 N o v -2 0 0 2 Ju n -2 0 0 3 Ja n -2 0 0 4 A ug -2 0 0 4 M a r-2 0 0 5 O c t-2 0 0 5 M a y -2 0 0 6 D e c -2 0 0 6 Ju l-2 0 0 7 F e b -2 0 0 8 S e p -2 0 0 8 A p r-2 0 0 9 N o v -2 0 0 9 Ju n -2 0 1 0 Ja n -2 0 1 1 A ug -2 0 1 1 M a r-2 0 1 2 O c t-2 0 1 2 M a y -2 0 1 3 D e c -2 0 1 3 Ju l-2 0 1 4 F e b -2 0 1 5 S e p -2 0 1 5
9
Table 1 – Estimations of the y-o-y quarterly change of the cyclical component of the current account balance (percentage points of GDP)
Notes: t-statistics in brackets. *, **, *** denote significance at 10, 5 and 1% levels. Heteroskedasticity and Autocorrelation Consistent Covariance (HAC) or Newey-West estimator. Regressions were estimated by OLS.
Variable (1) (2) (3) (4) (5) (1) (2) (3) (4) (5)
constant 0.95*** 0.98*** 0.97*** 0.91*** 0.91*** 0.03 0.01 0.06 0.14 0.02
(8.6) (8.6) (8.2) (6.5) (6.5) (0.1) (0) (0.3) (0.9) (0.1)
Dummy financial crisis -1.05*** -0.98*** -0.99*** -0.8*** -0.82** 0.46* 0.52* 0.32 0.39 0.7***
(-5.5) (-5) (-4.9) (-4.3) (-4.5) (1.7) (2) (1.3) (1.5) (2.8)
yoy compensation employees -0.18*** -0.18*** -0.17*** -0.15*** -0.15*** -0.13** -0.13** -0.15*** -0.18*** -0.19**
(-8.3) (-8.3) (-7.3) (-5.7) (-5.8) (-2.5) (-2.3) (-2.9) (-3) (-2.4) Δ4 CISS -2.34*** -2.02*** -2.12*** -2.01*** -2.02*** -0.67** -0.77** -0.52** -0.96*** -0.72** (-4.7) (-4.2) (-4) (-5.7) (-5.6) (-2.4) (-2.6) (-2.1) (-2.9) (-2.4) yoy S&P 500 -0.02*** -0.03*** -0.03*** -0.04*** -0.04*** 0.00 -0.01** 0.00 -0.01** -0.01** (-4.4) (-6) (-6.1) (-8.5) (-8.6) (-1.5) (-2.2) (-1.2) (-2.6) (-2.3) yoy VIX -0.005** -0.006** -0.009*** -0.009*** 0.00 0.00 0.00 0.00 (-2.1) (-2.3) (-4) (-4.2) (-1.2) (-0.4) (-1.2) (-1.6)
yoy trade terms -0.07** -0.1*** -0.09** -0.03 0.07 0.06 0.07 0.09*
(-1.9) (-2.8) (-2.6) (-0.8) (1.4) (1.2) (1.6) (1.9)
Δ4 cross holdings of government bonds -0.03 0.01
(-1.1) (0.3) yoy employment -0.11*** -0.11*** 0.15 0.14 (-2.6) (-2.8) (1.1) (1) Δ4 euribor 3 months 0.33*** 0.36*** 0.09 -0.04 (5.2) (6.6) (1) (-0.4) ρ 0.83*** 0.85*** 0.75*** 0.79*** 0.89*** (12.4) (15.2) (7) (10) (15.2) R-square 0.59 0.62 0.63 0.72 0.72 0.73 0.74 0.77 0.76 0.74 Durbin-Watson 1.83 1.75 1.74 1.99 1.94 2.06 2.05 2.09 2.08 2.04 Observations 56 56 56 56 56 63 63 55 63 63 Period 2001:1-2014:4 2001:1-2014:4 2001:1-2014:4 2001:1-2014:4 2001:1-2014:4 2000:2-2015:4 2000:2-2015:4 2001:2-2014:4 2000:2-2015:4 2000:2-2015:4 Germany Portugal
10
Table 2 – Estimations of the y-o-y quarterly change of the non-cyclical current account balance (percentage points of GDP)
Notes: t-statistics in brackets. *, **, *** denote significance at 10, 5 and 1% levels. Heteroskedasticity and Autocorrelation Consistent Covariance (HAC) or Newey-West estimator. Regressions were estimated by OLS.
Variable (1) (2) (3) (4) (5) (1) (2) (3) (4) (5)
constant -0.35 -0.35 -0.35 -0.04 -0.23 0.97 0.83 1.18* 0.62 0.60
(-1) (-1) (-1) (-0.1) (-0.9) (1.4) (1.7) (1.8) (1) (1)
yoy employment -0.11 -0.08 0.52 0.38
(-0.8) (-0.5) (0.6) (0.5)
Dummy financial crisis 0.68 0.81 0.76 -1.00 -0.46 -1.06
(1.3) (1.6) (1.4) (-1.2) (-0.8) (-1.3)
Dummy EFAP 1.8*** 1.92*** 1.96*** 2.29*** 2.34***
(3) (3.4) (3.4) (4.1) (3.8)
yoy trade terms 0.5*** 0.51*** 0.52*** 0.55*** 0.47*** 0.16 0.2** 0.17 0.11 0.12
(4.8) (5.4) (5.4) (5.7) (-2.3) (1.1) (2.3) (1.6) (0.7) (0.7)
Δ4 cross holdings of government bonds -0.24*** -0.25*** -0.26*** -0.26*** -0.29** 0.02 0.06 -0.14 -0.06 0.01
(-2.8) (-2.8) (-3.3) (-2.8) (-2.3) (0.1) (0.4) (-1) (-0.3) (0)
Δ4 disposable income households-to-GDP -6.06 -74***
(-0.6) (-5)
Δ4 CISS -0.27 -1.38
(-0.2) (-0.9)
yoy compensation employees -0.04 0.06
(-0.5) (0.3) Δ4 euribor 3 months -0.22 0.04 (-0.7) (0.1) ρ 0.64*** 0.57*** 0.61*** 0.63*** 0.63*** (5.3) (5.6) (6.3) (6.1) (5.6) R-square 0.60 0.59 0.59 0.57 0.59 0.40 0.54 0.40 0.38 0.38 Durbin-Watson 1.80 1.81 1.79 1.78 1.80 1.81 1.93 1.77 1.75 1.80 Observations 56 56 56 56 56 55 55 55 55 55 Period 2001:1-2014:4 2001:1-2014:4 2001:1-2014:4 2001:1-2014:4 2001:1-2014:4 2001:2-2014:4 2001:2-2014:4 2001:2-2014:4 2001:2-2014:4 2001:2-2014:4 Portugal Germany