ISSN 0103-8478
1Extraído de parte da tese de doutorado do primeiro autor.
2Instituto Agronômico do Paraná, IAPAR, CP 481, 86001-970, Londrina, Paraná, Brasil. E-mail: [email protected]. Autor para
correspondência.
3Faculdade de Agronomia da Universidade Federal do Rio Grande do Sul. CP 776, 91501-970, Porto Alegre, Rio Grande do Sul,
Brasil.
Plant traits to complement selection based on yield components in wheat
1Lauro Akio Okuyama2 Luiz Carlos Federizzi3
José Fernandes Barbosa Neto3
Caracteres da planta para complementar a seleção baseada em componentes de rendimento em trigo
ABSTRACT
The aim of the present study was to investigate the relationship between plant traits and yield per spike in wheat genotypes. The measured plant traits were: length of flag leaf blade, peduncle extrusion, peduncle, spike and sheath, culm diameter and plant height. Data were analyzed with correlation and path coefficient analysis. Yield per spike correlated positively with spike length and culm diameter. Path coefficient analysis indicated that, under irrigated condition, yield per spike had a positive direct effect and a positive correlation with spike length and culm diameter and, under non-irrigated condition, yield per spike showed a positive direct effect and a positive correlation with culm diameter, spike length and plant height. Culm diameter and spike length, under irrigated condition, and also plant height, under late season water stress condition, were the plant traits most related to higher grain yield per spike in wheat.
Key words:correlation, path analysis, water stress, irrigation.
RESUMO
O objetivo do presente trabalho foi investigar as relações entre caracteres da planta e produção de grãos por espiga em genótipos de trigo. Foram avaliados os comprimentos da lâmina da folha bandeira, da parte do pedúnculo extrusado, do pedúnculo, da espiga e da bainha, o diâmetro do colmo e a estatura da planta. Os dados foram analisados por meio de correlações e análises de trilha. A produção de grãos por espiga correlacionou-se positivamente com o comprimento da espiga e o diâmetro do colmo. Análises de trilha indicaram que, sob condição irrigada, a produção de grãos por espiga teve um efeito direto positivo e correlação positiva com o comprimento da espiga e diâmetro do colmo e, sob condição não-irrigada, a produção de grãos por espiga apresentou efeito direto positivo e correlação
positiva com o diâmetro do colmo, comprimento da espiga e estatura da planta. O diâmetro do colmo e o comprimento da espiga, sob condição irrigada, e também a estatura da planta, sob condição de deficiência hídrica no final do ciclo, foram os caracteres de planta mais relacionados com a maior produção de grãos por espiga em trigo.
Palavras-chave: correlação, análise de trilha, estresse hídrico, irrigação.
INTRODUCTION
Concerning plant traits, the following considerations should be taken into account: there seems to be no single plant trait conferring stress resistance in the form of avoidance or tolerance but there are responses to a combination of traits; some traits which help improve the performance of a plant under stress conditions are constitutive (always present) while others are adaptive, i.e. they will be expressed only under a g i v e n s e t o f e n v i r o n m e n t a l s t i m u l i ; p l a n t performance is the result of a combination of constitutive and adaptive traits; the response depends on the stress history of the plant since acclimation (short-term responses) may also be present; if adaptive traits are important to plant response under stress, a target environment for the breeder’s selection is needed; there seems to be a tradeoff between yield and stress resistance (ACEVEDO, 1987).
Plant traits contributing to grain yield and plant adaptations under various drought patterns were evaluated by several researchers. In bread wheat under Mediterranean terminal drought stress condition, the traits considered as important for durum wheat grain yield increase were: the displacement from optimal heading date (absolute difference of days from the mean heading date of three control cultivars) and kernels per spike ( A N N I C C H I A R I C O & P E C E T T I , 1 9 9 8 ) ; increased leaf rolling, cooler leaf canopy, longer peduncle, increased plant height and early heading (ORTIZ-FERRARA et al., 1991). Under warm northwestern México condition, above ground biomass at maturity, days from emergence to anthesis and to maturity, number of grains m-2 and
ground cover estimated visually after heading showed associations with wheat grain yield (REYNOLDS et al., 1998). In India, the ear:stem ratio was not as efficient as harvest index in selecting for drought susceptible and tolerant wheat genotypes (RANE et al., 2001).
For each pattern of drought stress, a p a r t i c u l a r a n d o f t e n d i ff e r e n t p l a n t t r a i t contributed to specific adaptation to the distinct drought stress conditions (VAN GINKEL et al., 1998). Under continuing moisture stress, where grain yield might be only a fraction of yield potential, traits that improve water-use efficiency deserve priority. In contrast, when moisture supply is adequate and energy capture becomes more important as a yield-limiting factor, traits that alter canopy profile deserve higher priority (RASMUSSON, 1991).
Under water stress condition, most tillers abort or linger to form green, immature, nuisance heads at harvest. Thus, the plant traits of the main tiller may play important role in determining the grain yield. The objective of this study was to evaluate the association of plant traits of the main tiller with grain yield per spike in wheat genotypes grown under irrigated and non-irrigated field conditions.
MATERIAL AND METHODS
Field experiments were conducted at t h e E x p e r i m e n t a l St a t i o n o f t h e I n s t i t u t o Agronômico do Paraná (IAPAR), in Londrina (latitude 23o23’S, longitude 50o01’W, altitude
556 m). The field design for each sowing date w a s a s p l i t - p l o t a r r a n g e d i n a r a n d o m i z e d complete block with six replications. Water regimes, irrigated and non-irrigated (rainfed), were allocated to the main plots and genotypes to the subplots. Each subplot consisted of six rows with five meters, spaced 17cm apart and seed density of 350 grains m-2. The genotypes were 10
spring wheat (Triticum aestivum L.), one durum
wheat (Triticum durum L.) and one triticale (X Tritosecale Wittimack). The characteristics of
these genotypes are as follows: BR 37 has high vigor and spikes without awns, IA 9122 shows a higher capacity to roll leaves during drought periods, IAC 5–Maringá is an old cultivar with high vigor and low yield potential, IAPAR 6-Tapejara was largely sown in North and West of Paraná due to its high yield potential and good adaptation to soils with moderate aluminum, IAPAR 17-Caeté was largely grown in the North of Paraná, IAPAR 28- Igapó is originated from Veery’s that has shown good adaptability and drought tolerance (RAJARAM et al., 1996), IAPAR 29-Cacatú has medium drought tolerance, Nesser is considered drought tolerant under dry conditions of Syria (ORTIZ-FERRARA et al., 1991; RAJARAM et al., 1996), OCEPAR 7-Batuíra is an early cultivar that has apparent lower drought tolerance, OCEPAR-14 has performed well under early-season drought in the northern region of Paraná, DP-885 is a durum wheat that e x h i b i t e d g o o d y i e l d p o t e n t i a l a t C a m b a r á Experimental Station (north of Paraná State) and IAPAR.23-Arapoti is a triticale highly adapted and grown in Paraná.
OKUYAMA et al. (2004). In each subplot, a sample of one row with 1m in length was used to randomly selected 10 main tillers for the f o l l o w i n g d e t e r m i n a t i o n s : f l a g l e a f l e n g t h (distance from base to tip of the flag leaf blade), p e d u n c l e e x t r u s i o n l e n g t h ( d i s t a n c e f r o m insertion of flag leaf blade to basal node of spike), peduncle length (distance from upper node to the basal node of spike), spike length (distance from the base to the end of spike), sheath length (difference of peduncle length and peduncle extrusion length) and plant height (distance from the ground to the tip of the spike). Yield per spike was computed as the average g r a i n s w e i g h t o f 1 0 s p i k e s , w i t h m o i s t u r e corrected to 13%, and the culm diameter as the average distance of 10 stems aligned tightly together and measured at 10cm above ground level.
Data were submitted to variance and path analysis (CRUZ, 1997). Path analysis was c a r r i e d o u t w i t h g e n o t y p i c c o r r e l a t i o n c o n s i d e r i n g g r a i n y i e l d p e r s p i k e a s t h e dependent variable and length of flag leaf, peduncle extrusion, peduncle, spike and sheath, culm diameter and plant height as the causal variables. Tests of significance of water regimes by F test and phenotypic correlation coefficients of yield per spike and plant traits by t-test were obtained through the Statistical Analysis System (SAS, 1990).
RESULTS AND DISCUSSION
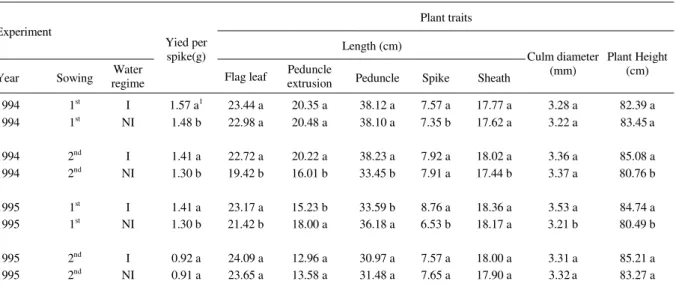
In the first sowing of 1994, there were significant differences among irrigated and non-irrigated water regimes only for yield per spike and spike length, while in the second sowing significant differences were found for yield per spike, length of flag leaf, peduncle extrusion, peduncle and sheath, and plant height. In the first sowing of 1995, yield per spike, length of flag leaf, peduncle extrusion, peduncle and spike, c u l m d i a m e t e r a n d p l a n t h e i g h t r e v e a l e d significant differences among irrigated and non-irrigated water regimes, while in the second sowing all the traits exhibited non-significant differences (Table 1).
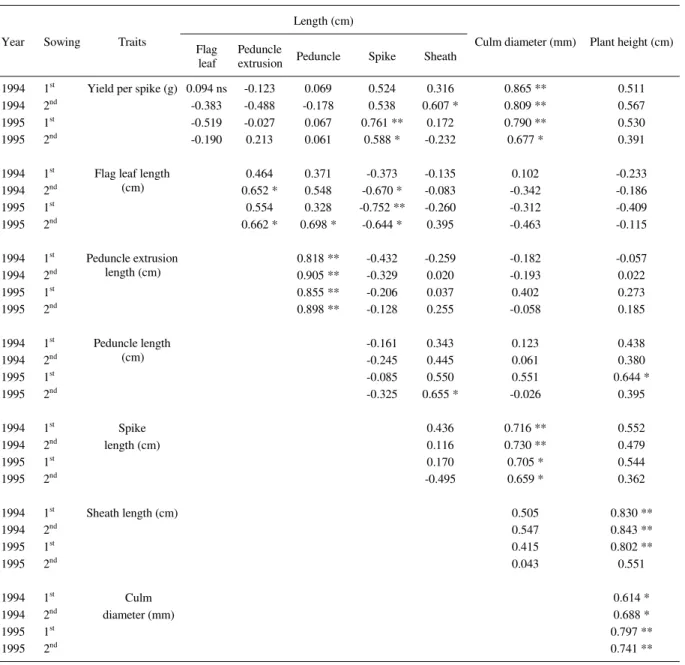
Regardless of sowing date, year and water regime, yield per spike had a positive phenotypic correlation with spike length and culm diameter (Tables 2 and 3). Other positive correlations were observed between flag leaf length and peduncle extrusion length, peduncle extrusion length and peduncle length, spike length and culm diameter, sheath length and plant height, and culm diameter and plant height. The only significant and negative correlation was between flag leaf length and spike length. Regarding the effect of flag leaf on grain yield, c o n t r a d i c t o r y r e s u l t s a r e r e p o r t e d i n t h e literature. No association was found between f l a g l e a f b l a d e l e n g t h a n d g r a i n y i e l d o r
Table 1 - Yield per spike and plant traits of wheat genotypes under irrigated (I) and non-irrigated (NI) conditions.
Plant traits Experiment
Length (cm)
Year Sowing regimeWater
Yied per spike(g)
Flag leaf Peduncle
extrusion Peduncle Spike Sheath
Culm diameter (mm)
Plant Height (cm)
1994 1st I 1.57 a1 23.44 a 20.35 a 38.12 a 7.57 a 17.77 a 3.28 a 82.39 a
1994 1st NI 1.48 b 22.98 a 20.48 a 38.10 a 7.35 b 17.62 a 3.22 a 83.45a
1994 2nd I 1.41 a 22.72 a 20.22 a 38.23 a 7.92 a 18.02 a 3.36 a 85.08 a
1994 2nd NI 1.30 b 19.42 b 16.01 b 33.45 b 7.91 a 17.44 b 3.37 a 80.76 b
1995 1st I 1.41 a 23.17 a 15.23 b 33.59 b 8.76 a 18.36 a 3.53 a 84.74 a
1995 1st NI 1.30 b 21.42 b 18.00 a 36.18 a 6.53 b 18.17 a 3.21 b 80.49 b
1995 2nd I 0.92 a 24.09 a 12.96 a 30.97 a 7.57 a 18.00 a 3.31 a 85.21 a
1995 2nd NI 0.91 a 23.65 a 13.58 a 31.48 a 7.65 a 17.90 a 3.32a 83.27 a
1For each year and sowing date, means within the same column followed by same letter are not significantly different at the 0.05 probability
components of yield in parental, F1 and F2 populations in field spaced plants (HSU & WALTON, 1971; CHOWDHRY et al., 1976; MCNEAL & BERG, 1977). On the other hand, positive correlation was found between flag leaf area and grain yield in wheat plants under g r e e n h o u s e c o n d i t i o n ( M O N Y O & WHITTINGTON, 1973). Flag leaf area by itself is not a very good index of plant performance. The spikes, including awns, leaf sheaths, and remaining leaf area also need to be considered
as supplier to grain yield (MCNEAL & BERG, 1977). Under Mediterranean terminal drought stress condition, longer peduncle was found to be an important trait for bread wheat (ORTIZ-FERRARA et al., 1991) and for two rowed barley genotypes (ACEVEDO et al., 1991). In this study, the drought intensity and period of water stress were probably not long enough to obtain large differences in plant growth and development. The correlation studies of the present paper showed that to increase grain yield per spike, the most
Table 2 - Phenotypic correlation coefficients of yield related traits in wheat genotypes grown under irrigated condition.
Length (cm)
Year Sowing Traits
Flag leaf Peduncle
extrusion Peduncle Spike Sheath
Culm diameter (mm) Plant height (cm)
1994 1st 0.242 ns 0.033 0.145 0.431 0.206 0.691 * 0.357
1994 2nd -0.424 0.086 0.136 0.375 0.100 0.492 0.354
1995 1st
Yield per
spike (g)
-0.335 0.067 -0.044 0.657 * -0.166 0.578 * 0.316
1995 2nd 0.016 0.202 0.263 0.452 0.149 0.608 * 0.444
1994 1st 0.455 0.290 -0.433 -0.345 -0.091 -0.313
1994 2nd 0.439 0.357 -0.655 * -0.130 -0.274 -0.205
1995 1st
Flag leaf length (cm)
0.620 * 0.510 -0.780 ** -0.339 -0.486 -0.379
1995 2nd 0.524 0.441 -0.645 * -0.063 -0.491 -0.328
1994 1st 0.862 ** -0.469 -0.341 -0.095 -0.028
1994 2nd 0.859 ** -0.408 -0.205 -0.208 -0.079
1995 1st
Peduncle extrusion
length (cm) 0.788 ** -0.151 -0.590 * -0.159 -0.163
1995 2nd 0.846 ** -0.238 -0.112 -0.147 -0.134
1994 1st -0.301 0.183 0.167 0.420
1994 2nd -0.375 0.325 -0.083 0.333
1995 1st
Peduncle length (cm)
-0.131 0.032 0.214 0.332
1995 2nd -0.316 0.435 0.098 0.330
1994 1st 0.352 0.760 ** 0.490
1994 2nd 0.037 0.765 ** 0.491
1995 1st
Spike length (cm)
0.074 0.646 * 0.486
1995 2nd -0.188 0.681 * 0.266
1994 1st 0.492 0.832 **
1994 2nd 0.225 0.781 **
1995 1st
Sheath length (cm)
0.538 0.700 *
1995 2nd 0.431 0.843 **
1994 1st 0.608 *
1994 2nd 0.671 *
1995 1st
Culm diameter (mm)
0.895 **
1995 2nd 0.793 **
ns = not significant (P>0.05).
important traits are culm diameter and spike length. As spike length correlated positively with culm diameter, selection for greater spike length will also increase culm diameter. Larger culm diameter may be selected from taller plants, due to positive correlation among these two traits. However, taller plants under non-limiting water conditions normally have lower grain yield potential caused by higher lodging, lower number of spikes m-2 and inferior harvest index (ARNAU
& MONNEVEUX, 1995).
Table 3 - Phenotypic correlation coefficients of yield related traits in wheat genotypes grown under non-irrigated condition.
Length (cm)
Year Sowing Traits
Flag leaf
Peduncle
extrusion Peduncle Spike Sheath
Culm diameter (mm) Plant height (cm)
1994 1st 0.094 ns -0.123 0.069 0.524 0.316 0.865 ** 0.511
1994 2nd -0.383 -0.488 -0.178 0.538 0.607 * 0.809 ** 0.567
1995 1st
Yield per spike (g)
-0.519 -0.027 0.067 0.761 ** 0.172 0.790 ** 0.530
1995 2nd -0.190 0.213 0.061 0.588 * -0.232 0.677 * 0.391
1994 1st 0.464 0.371 -0.373 -0.135 0.102 -0.233
1994 2nd 0.652 * 0.548 -0.670 * -0.083 -0.342 -0.186
1995 1st
Flag leaf length (cm)
0.554 0.328 -0.752 ** -0.260 -0.312 -0.409
1995 2nd 0.662 * 0.698 * -0.644 * 0.395 -0.463 -0.115
1994 1st 0.818 ** -0.432 -0.259 -0.182 -0.057
1994 2nd 0.905 ** -0.329 0.020 -0.193 0.022
1995 1st
Peduncle extrusion length (cm)
0.855 ** -0.206 0.037 0.402 0.273
1995 2nd 0.898 ** -0.128 0.255 -0.058 0.185
1994 1st -0.161 0.343 0.123 0.438
1994 2nd -0.245 0.445 0.061 0.380
1995 1st
Peduncle length (cm)
-0.085 0.550 0.551 0.644 *
1995 2nd -0.325 0.655 * -0.026 0.395
1994 1st 0.436 0.716 ** 0.552
1994 2nd 0.116 0.730 ** 0.479
1995 1st
Spike length (cm)
0.170 0.705 * 0.544
1995 2nd -0.495 0.659 * 0.362
1994 1st 0.505 0.830 **
1994 2nd 0.547 0.843 **
1995 1st
Sheath length (cm)
0.415 0.802 **
1995 2nd 0.043 0.551
1994 1st 0.614 *
1994 2nd 0.688 *
1995 1st
Culm diameter (mm)
0.797 **
1995 2nd 0.741 **
ns = not significant (P>0.05).
* and ** significant at 0.05 and 0.01 probability levels by t test, respectively.
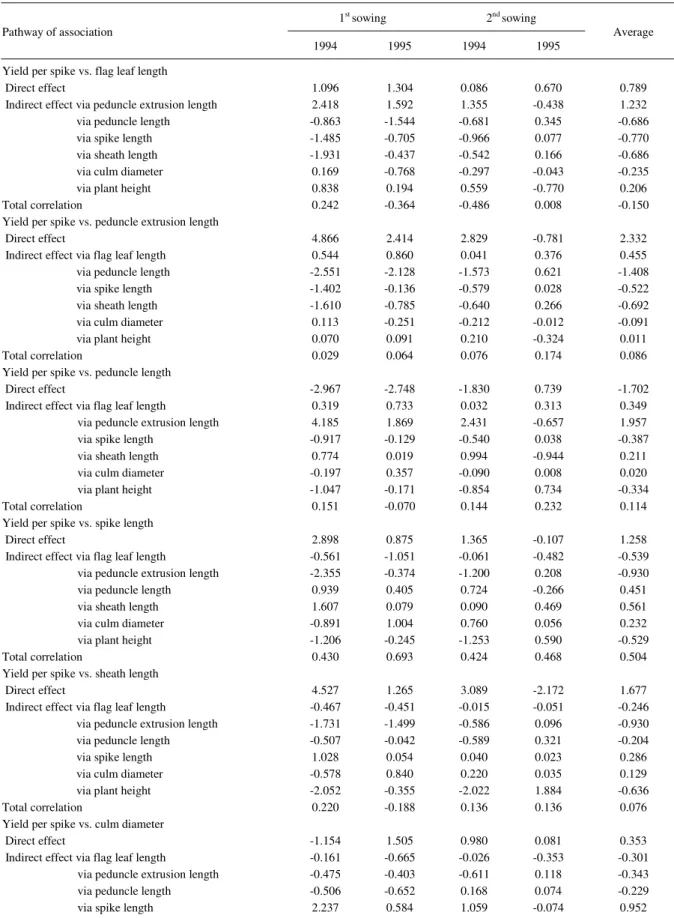
Table 4 - Direct and indirect effects of factors influencing wheat yield per spike under irrigated condition.
1st sowing 2nd sowing
Pathway of association
1994 1995 1994 1995
Average
Yield per spike vs. flag leaf length
Direct effect 1.096 1.304 0.086 0.670 0.789
Indirect effect via peduncle extrusion length 2.418 1.592 1.355 -0.438 1.232
via peduncle length -0.863 -1.544 -0.681 0.345 -0.686
via spike length -1.485 -0.705 -0.966 0.077 -0.770
via sheath length -1.931 -0.437 -0.542 0.166 -0.686
via culm diameter 0.169 -0.768 -0.297 -0.043 -0.235
via plant height 0.838 0.194 0.559 -0.770 0.206
Total correlation 0.242 -0.364 -0.486 0.008 -0.150
Yield per spike vs. peduncle extrusion length
Direct effect 4.866 2.414 2.829 -0.781 2.332
Indirect effect via flag leaf length 0.544 0.860 0.041 0.376 0.455
via peduncle length -2.551 -2.128 -1.573 0.621 -1.408
via spike length -1.402 -0.136 -0.579 0.028 -0.522
via sheath length -1.610 -0.785 -0.640 0.266 -0.692
via culm diameter 0.113 -0.251 -0.212 -0.012 -0.091
via plant height 0.070 0.091 0.210 -0.324 0.011
Total correlation 0.029 0.064 0.076 0.174 0.086
Yield per spike vs. peduncle length
Direct effect -2.967 -2.748 -1.830 0.739 -1.702
Indirect effect via flag leaf length 0.319 0.733 0.032 0.313 0.349
via peduncle extrusion length 4.185 1.869 2.431 -0.657 1.957
via spike length -0.917 -0.129 -0.540 0.038 -0.387
via sheath length 0.774 0.019 0.994 -0.944 0.211
via culm diameter -0.197 0.357 -0.090 0.008 0.020
via plant height -1.047 -0.171 -0.854 0.734 -0.334
Total correlation 0.151 -0.070 0.144 0.232 0.114
Yield per spike vs. spike length
Direct effect 2.898 0.875 1.365 -0.107 1.258
Indirect effect via flag leaf length -0.561 -1.051 -0.061 -0.482 -0.539
via peduncle extrusion length -2.355 -0.374 -1.200 0.208 -0.930
via peduncle length 0.939 0.405 0.724 -0.266 0.451
via sheath length 1.607 0.079 0.090 0.469 0.561
via culm diameter -0.891 1.004 0.760 0.056 0.232
via plant height -1.206 -0.245 -1.253 0.590 -0.529
Total correlation 0.430 0.693 0.424 0.468 0.504
Yield per spike vs. sheath length
Direct effect 4.527 1.265 3.089 -2.172 1.677
Indirect effect via flag leaf length -0.467 -0.451 -0.015 -0.051 -0.246
via peduncle extrusion length -1.731 -1.499 -0.586 0.096 -0.930
via peduncle length -0.507 -0.042 -0.589 0.321 -0.204
via spike length 1.028 0.054 0.040 0.023 0.286
via culm diameter -0.578 0.840 0.220 0.035 0.129
via plant height -2.052 -0.355 -2.022 1.884 -0.636
Total correlation 0.220 -0.188 0.136 0.136 0.076
Yield per spike vs. culm diameter
Direct effect -1.154 1.505 0.980 0.081 0.353
Indirect effect via flag leaf length -0.161 -0.665 -0.026 -0.353 -0.301
via peduncle extrusion length -0.475 -0.403 -0.611 0.118 -0.343
via peduncle length -0.506 -0.652 0.168 0.074 -0.229
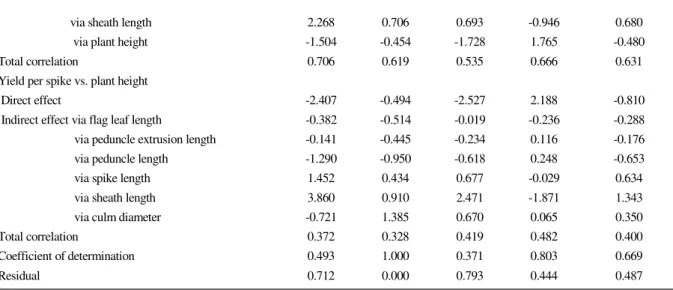
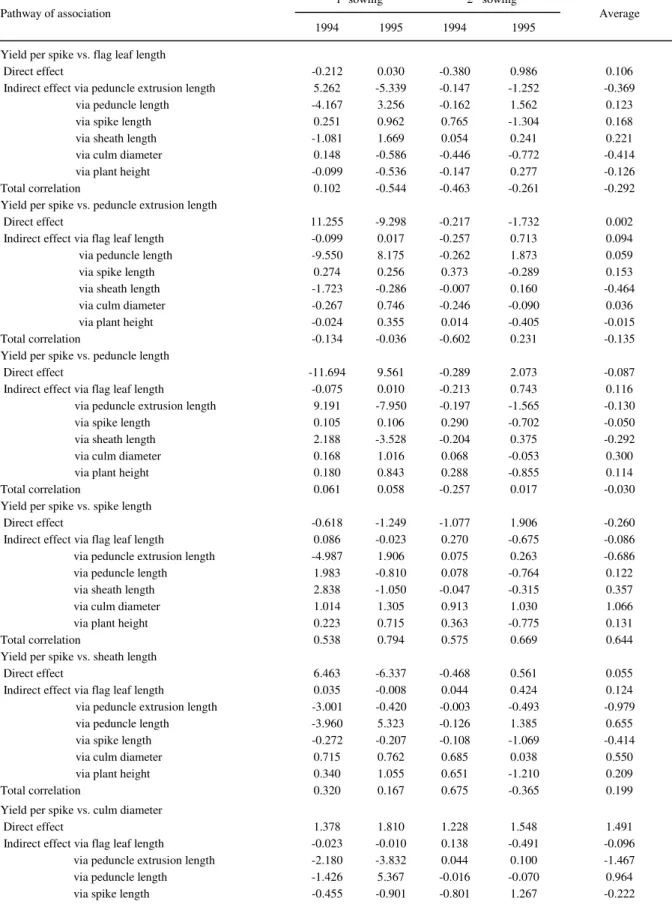
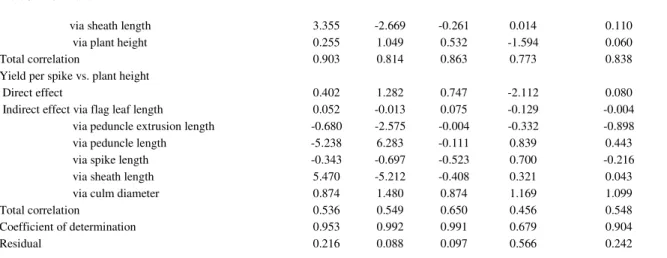
Plant height had a high negative direct effect and moderate positive total correlation with yield per spike. Path coefficient analysis under non-irrigated condition showed that yield per spike had a positive direct effect in one out of four experiments and a moderate positive total c o r r e l a t i o n w i t h s p i k e l e n g t h , a n d a h i g h positive direct effect and a high positive total correlation with culm diameter, and a medium positive direct effect and moderate positive total correlation with plant height. Furthermore, yield per spike had an inconsistent direct effect and low total correlation with length of flag leaf, peduncle extrusion, peduncle and sheath (Table 5).
U n d e r b o t h w a t e r r e g i m e s , c u l m d i a m e t e r a n d s p i k e l e n g t h w e r e a s s o c i a t e d w i t h y i e l d p e r s p i k e . C u l m d i a m e t e r h a d h i g h e r p o s i t i v e d i r e c t e f f e c t a n d h i g h e r p o s i t i v e c o r r e l a t i o n w i t h y i e l d p e r s p i k e . T h i s r e s u l t i n d i c a t e d t h a t d i r e c t s e l e c t i o n o f p l a n t s w i t h a t h i c k e r c u l m m i g h t c o n t r i b u t e t o i n c r e a s e g r a i n y i e l d p e r s p i k e . M o r e o v e r, a t h i c k e r c u l m m i g h t r e d u c e l o d g i n g , a l l o w g r e a t e r w a t e r f l o w i n t h e p l a n t a n d a c c u m u l a t e a l a rg e r a m o u n t o f a s s i m i l a t e s . W h e a t g r a i n f i l l i n g u n d e r w a t e r s t r e s s m a y b e i m p r o v e d b y s t e m r e s e r v e m o b i l i z a t i o n ( E H D A I E & W A I N E S , 1 9 9 6 ; B L U M , 1 9 9 8 ; F O U L K E S e t a l . , 2 0 0 2 ) . T h i s m a y r e p r e s e n t a n i m p o r t a n t a d a p t a t i o n f o r g r a i n y i e l d , m a i n l y i n t h o s e a r e a s w h e r e d r y p e r i o d s a r e likely to occur during the grain filling stage. T h e s p i k e l e n g t h c o n t r i b u t i o n s f o r h i g h e r
g r a i n y i e l d p e r s p i k e w e r e n o t c o n s i s t e n t i n a l l e n v i r o n m e n t s , s o t h e i n d i r e c t e f f e c t s s h o u l d b e t a k e n i n t o a c c o u n t , m a i n l y c u l m d i a m e t e r u n d e r n o n - i r r i g a t e d c o n d i t i o n . P o s i t i v e a s s o c i a t i o n b e t w e e n g r a i n y i e l d p e r s p i k e a n d s p i k e l e n g t h w a s a l s o f o u n d (H S U & WALTON, 1971). Plant height was related t o h i g h e r y i e l d p e r s p i k e o n l y u n d e r n o n -i r r -i g a t e d c o n d -i t -i o n . T h u s , p a t h a n a l y s -i s p r o v i d e d a d d i t i o n a l i n f o r m a t i o n o n c o m p o n e n t i n t e r r e l a t i o n s h i p s t h a t h a d n o t b e e n o b t a i n e d i n a n a l y s i s o f c o r r e l a t i o n c o e f f i c i e n t s . Ta l l e r p l a n t s h a v e b e s t p e r f o r m a n c e u n d e r w a t e r s t r e s s c o n d i t i o n s ( O RT I Z - F E R R A R A e t a l . , 1 9 9 1 ) . I n t h e present paper, the correlation studies showed a p o s i t i v e r e l a t i o n s h i p b e t w e e n p l a n t h e i g h t a n d c u l m d i a m e t e r, h e n c e t a l l e r p l a n t s m a y be used to indirectly select for thicker culms, m a i n l y u n d e r w a t e r s t r e s s c o n d i t i o n s .
In a previous paper (OKUYAMA et al., 2004) was reported that the number of spikes m-2 and the number of grains per spike,
f o l l o w e d b y t h e a b o v e - g r o u n d b i o m a s s . m- 2
should be taken into account to enhance wheat grain yield. This paper provides evidence that some plant traits may be used to complement selection based on yield components in wheat. Yi e l d p e r s p i k e m a y b e i n c r e a s e d , u n d e r irrigated condition, by selecting plants with thicker culm and longer spike and, under non-irrigated late season water stress conditions, by choosing taller plants with thicker culm and longer spikes.
Table 4 – continued
via sheath length 2.268 0.706 0.693 -0.946 0.680
via plant height -1.504 -0.454 -1.728 1.765 -0.480
Total correlation 0.706 0.619 0.535 0.666 0.631
Yield per spike vs. plant height
Direct effect -2.407 -0.494 -2.527 2.188 -0.810
Indirect effect via flag leaf length -0.382 -0.514 -0.019 -0.236 -0.288
via peduncle extrusion length -0.141 -0.445 -0.234 0.116 -0.176
via peduncle length -1.290 -0.950 -0.618 0.248 -0.653
via spike length 1.452 0.434 0.677 -0.029 0.634
via sheath length 3.860 0.910 2.471 -1.871 1.343
via culm diameter -0.721 1.385 0.670 0.065 0.350
Total correlation 0.372 0.328 0.419 0.482 0.400
Coefficient of determination 0.493 1.000 0.371 0.803 0.669
Table 5 - Direct and indirect effects of factors influencing wheat yield per spike under non-irrigated condition.
1st sowing 2nd sowing
Pathway of association
1994 1995 1994 1995
Average
Yield per spike vs. flag leaf length
Direct effect -0.212 0.030 -0.380 0.986 0.106
Indirect effect via peduncle extrusion length 5.262 -5.339 -0.147 -1.252 -0.369
via peduncle length -4.167 3.256 -0.162 1.562 0.123
via spike length 0.251 0.962 0.765 -1.304 0.168
via sheath length -1.081 1.669 0.054 0.241 0.221
via culm diameter 0.148 -0.586 -0.446 -0.772 -0.414
via plant height -0.099 -0.536 -0.147 0.277 -0.126
Total correlation 0.102 -0.544 -0.463 -0.261 -0.292
Yield per spike vs. peduncle extrusion length
Direct effect 11.255 -9.298 -0.217 -1.732 0.002
Indirect effect via flag leaf length -0.099 0.017 -0.257 0.713 0.094
via peduncle length -9.550 8.175 -0.262 1.873 0.059
via spike length 0.274 0.256 0.373 -0.289 0.153
via sheath length -1.723 -0.286 -0.007 0.160 -0.464
via culm diameter -0.267 0.746 -0.246 -0.090 0.036
via plant height -0.024 0.355 0.014 -0.405 -0.015
Total correlation -0.134 -0.036 -0.602 0.231 -0.135
Yield per spike vs. peduncle length
Direct effect -11.694 9.561 -0.289 2.073 -0.087
Indirect effect via flag leaf length -0.075 0.010 -0.213 0.743 0.116
via peduncle extrusion length 9.191 -7.950 -0.197 -1.565 -0.130
via spike length 0.105 0.106 0.290 -0.702 -0.050
via sheath length 2.188 -3.528 -0.204 0.375 -0.292
via culm diameter 0.168 1.016 0.068 -0.053 0.300
via plant height 0.180 0.843 0.288 -0.855 0.114
Total correlation 0.061 0.058 -0.257 0.017 -0.030
Yield per spike vs. spike length
Direct effect -0.618 -1.249 -1.077 1.906 -0.260
Indirect effect via flag leaf length 0.086 -0.023 0.270 -0.675 -0.086
via peduncle extrusion length -4.987 1.906 0.075 0.263 -0.686
via peduncle length 1.983 -0.810 0.078 -0.764 0.122
via sheath length 2.838 -1.050 -0.047 -0.315 0.357
via culm diameter 1.014 1.305 0.913 1.030 1.066
via plant height 0.223 0.715 0.363 -0.775 0.131
Total correlation 0.538 0.794 0.575 0.669 0.644
Yield per spike vs. sheath length
Direct effect 6.463 -6.337 -0.468 0.561 0.055
Indirect effect via flag leaf length 0.035 -0.008 0.044 0.424 0.124
via peduncle extrusion length -3.001 -0.420 -0.003 -0.493 -0.979
via peduncle length -3.960 5.323 -0.126 1.385 0.655
via spike length -0.272 -0.207 -0.108 -1.069 -0.414
via culm diameter 0.715 0.762 0.685 0.038 0.550
via plant height 0.340 1.055 0.651 -1.210 0.209
Total correlation 0.320 0.167 0.675 -0.365 0.199
Yield per spike vs. culm diameter
Direct effect 1.378 1.810 1.228 1.548 1.491
Indirect effect via flag leaf length -0.023 -0.010 0.138 -0.491 -0.096
via peduncle extrusion length -2.180 -3.832 0.044 0.100 -1.467
via peduncle length -1.426 5.367 -0.016 -0.070 0.964
REFERENCES
ACEVEDO, E. Assessing crop and plant attributes for cereal improvement in water-limited Mediterranean environments. In: SRIVASTAVA, J.P. et al. (Ed). Drought tolerance in winter cereals. Chichester: J. Wiley, 1987. p.303-320.
ACEVEDO, E. et al. Traits associated with high yield in barley in low-rainfall environments. J Agric Sci,v.116, n.1, p.23-36, 1991.
ANNICCHIARICO, P.; PECETTI, L. Yield vs. morphophysiological trait-based criteria for selection of durum wheat in a semi-arid Mediterranean region (northern Syria).
Field Crop Res, v.59, n.3, p.163-173, 1998.
ARNAU, G.; MONNEVEUX, P. Physiology and genetics of terminal water stress tolerance in barley. J Genet & Breed, v.49, n.4, p.327-331, 1995.
BLUM, A. Improving wheat grain filling under stress by stem reserve mobilization. Euphytica,v.100, n.1-3, p.77-83, 1998.
CHOWDHRY, A.R. et al. Relations between flag leaf, yield of grain and yield components in wheat. Exp Agric,v.12, n.4, p.411-415, 1976.
CLARKE, J.M. Use of physiological and morphological traits in breeding programmes to improve drought resistance of cereals. In: SRIVASTAVA, J.P. et al. (Ed). Drought tolerance in winter cereals. Chichester : J. Wiley, 1987. p.171-189.
CRUZ, C.D. Programa genes: aplicativo computacional em genética e estatística. Viçosa : Universidade Federal de Viçosa, 1997. 442p.
EHDAIE, B.; WAINES, J.G. Genetic variation for contribution of preanthesis assimilates to grain yield in spring wheat. J Genet & Breed, v.50, n.1, p.47-55, 1996.
FOULKES, M.J. et al. The ability of wheat cultivars to withstand drought in UK conditions: formation of grain yield.
J Agric Sci, v.38, p.153-169, 2002.
HSU, P.; WA LTON, P.D. Relationships between yield and its components and structures above the flag leaf
node in spring wheat. Crop Sci, v.11, n.2, p.190-193, 1 9 7 1 .
MCNEAL, F.H.; BERG, M.A. Flag leaf area in five spring wheat crosses and the relationship to grain yield. Euphytica, v.26, n.3, p.739-744, 1977.
MONYO, J.H.; WHITTINGTON, W.J. Genotypic differences in flag leaf area and their contribution to grain yield in wheat.
Euphytica, v.22, n.3, p.600-606, 1973.
MOUSTAFA, M.A. et al. Response of four spring wheat cultivars to drought stress. Crop Sci, v.36,n.4, p.982-986, 1996.
OKUYAMA, L.A. et al. Correlation and path analysis of yield and its components and plant traits in wheat. Ciência Rural, v.34, n.6, p.1701-1708, 2004.
ORTIZ-FERRARA, G. et al. Identification of agronomic traits associated with yield under stress conditions. In: ACEVEDO, E. et al. (Ed). Physiology breeding of winter
cereals for stressed Mediterranean environments.
Paris: INRA, 1991. p.67-88.
RAJARAM, S. et al. CIMMYT’S approach to breed for drought tolerance. Euphytica, v.92, n.1-2, p.147-153, 1996.
RANE, J. et al. Evaluation of ear: stem weight ratio as a criterion for selection of drought-tolerant wheat (Triticum aestivum) genotypes. Indian Journal of Agricultural Sciences, v.71, n.8, p.505-509, 2001.
RASMUSSON, D.C. A plant breeder ’s experience with ideotype breeding. Field Crop Res, v.26, n.2, p.191-200, 1991.
REYNOLDS, M.P. et al. Evaluating physiological traits to complement empirical selection for wheat in warm environments. Euphytica,v.100, n.1-3, p.85-94, 1998.
SAS INSTITUTE INC. SAS - Procedures guide,Version 6. 3.ed. Cary : SAS Institute, 1990. 705p.
VAN GINKEL, M. et al. Plant traits related to yield of wheat in early, late, or continuous drought conditions. Euphytica, v.100, n.1-3, p.109-121, 1998.
Table 5 – continued.
via sheath length 3.355 -2.669 -0.261 0.014 0.110
via plant height 0.255 1.049 0.532 -1.594 0.060
Total correlation 0.903 0.814 0.863 0.773 0.838
Yield per spike vs. plant height
Direct effect 0.402 1.282 0.747 -2.112 0.080
Indirect effect via flag leaf length 0.052 -0.013 0.075 -0.129 -0.004
via peduncle extrusion length -0.680 -2.575 -0.004 -0.332 -0.898
via peduncle length -5.238 6.283 -0.111 0.839 0.443
via spike length -0.343 -0.697 -0.523 0.700 -0.216
via sheath length 5.470 -5.212 -0.408 0.321 0.043
via culm diameter 0.874 1.480 0.874 1.169 1.099
Total correlation 0.536 0.549 0.650 0.456 0.548
Coefficient of determination 0.953 0.992 0.991 0.679 0.904