www.atmos-chem-phys.net/16/2803/2016/ doi:10.5194/acp-16-2803-2016
© Author(s) 2016. CC Attribution 3.0 License.
Estimates of free-tropospheric NO
2
and HCHO mixing ratios
derived from high-altitude mountain MAX-DOAS observations at
midlatitudes and in the tropics
Stefan F. Schreier, Andreas Richter, Folkard Wittrock, and John P. Burrows
Institute of Environmental Physics, University of Bremen, Bremen, Germany Correspondence to:Stefan F. Schreier ([email protected])
Received: 9 October 2015 – Published in Atmos. Chem. Phys. Discuss.: 12 November 2015 Revised: 11 February 2016 – Accepted: 24 February 2016 – Published: 4 March 2016
Abstract. In this study, mixing ratios of NO2 (XNO2)and HCHO (XHCHO)in the free troposphere are derived from
two multi-axis differential optical absorption spectroscopy (MAX-DOAS) data sets collected at Zugspitze (2650 m a.s.l., Germany) and Pico Espejo (4765 m a.s.l., Venezuela). The estimation of NO2 and HCHO mixing ratios is based on
the modified geometrical approach, which assumes a single-scattering geometry and a single-scattering point altitude close to the instrument altitude. Firstly, the horizontal optical path length (hOPL) is obtained from O4 differential slant
col-umn densities (DSCDs) in the horizontal (0◦) and vertical (90◦) viewing directions. Secondly, X
NO2 and XHCHOare es-timated from the NO2and HCHO DSCDs at the 0◦and 90◦
viewing directions and averaged along the obtained hOPLs. As the MAX-DOAS instrument was performing measure-ments in the ultraviolet region, wavelength ranges of 346– 372 and 338–357 nm are selected for the DOAS analysis to retrieve NO2 and HCHO DSCDs, respectively. In order to
compare the measured O4DSCDs and moreover to perform
some sensitivity tests, the radiative transfer model SCIA-TRAN with adapted altitude settings for mountainous terrain is operated to simulate synthetic spectra, on which the DOAS analysis is also applied. The overall agreement between mea-sured and synthetic O4DSCDs is better for the higher Pico
Espejo station than for Zugspitze. Further sensitivity analysis shows that a change in surface albedo (from 0.05 to 0.7) can influence the O4 DSCDs, with a larger absolute difference
observed for the horizontal viewing direction. Consequently, the hOPL can vary by about 5 % throughout the season, for example when winter snow cover fully disappears in sum-mer. Typical values of hOPLs during clear-sky conditions are 19 km (14 km) at Zugspitze and 34 km (26.5 km) at Pico
Espejo when using the 346–372 (338–357 nm) fitting win-dow. The estimated monthly values of XNO2 (XHCHO), av-eraged over these hOPLs during clear-sky conditions, are in the range of 60–100 ppt (500–950 ppt) at Zugspitze and 8.5– 15.5 ppt (255–385 ppt) at Pico Espejo. Interestingly, multi-year-averaged monthly means of XNO2 and XHCHOincrease towards the end of the dry season at the Pico Espejo site, suggesting that both trace gases are frequently lifted above the boundary layer as a result of South American biomass burning.
1 Introduction
Tropospheric nitrogen oxides (NOx=NO+NO2) are re-leased from various human activities (e.g., the burning of oil, coal, gas, and wood). Natural sources of NOx include lightning, wildfires, and microbial activity in soils (Lee et al., 1997). Nitric oxide (NO) is the predominant part of NOx released from these sources, but it is quickly converted to nitrogen dioxide (NO2) by reaction with ozone (O3). The
major part of NOx emissions remains in the boundary layer (BL). However, in addition to NOx from lightning, signif-icant amounts of NOx from surface sources occasionally reach the free troposphere (FT) due to meteorology, oro-graphic uplift of BL air masses, or pyro-convection.
As NO2 and HCHO are good indicators of tropospheric
pollution, extensive ground-based measurement networks have been exploited in order to monitor their amounts and distributions (WMO, 2010). While ground-based in situ mea-surements represent rather surface and/or local amounts of NO2 and HCHO, remote-sensing techniques such as
the multi-axis differential optical absorption spectroscopy (MAX-DOAS) have the potential to derive both horizontal and vertical distributions of these trace gases in the immedi-ate vicinity of the station (Hönninger et al., 2004; Wittrock et al., 2004). There exist some records of NO2in the free
tropo-sphere from aircraft in situ measurements (Singh et al., 2009) and balloon-borne soundings (Kritten et al., 2010). How-ever, these observations are sparse and have mainly been per-formed during short field campaigns. Recently, global free-tropospheric NO2 mixing ratios have been obtained from
satellite data using the cloud-slicing technique (Choi et al., 2014). While the overall order of magnitude of satellite-derived values is similar to those taken from aircraft in situ measurements, the agreement of individual comparisons is not always good. Data records of HCHO in the free tropo-sphere are also rare and deduced at different seasons, regions, and altitudes (Schuster et al., 1990; Arlander et al., 1995; Singh et al., 2001).
Although the number of ground-based in situ and remote-sensing instruments with which to observe tropospheric pol-lution has increased in recent years, the level of knowl-edge concerning representative NO2 and HCHO amounts
in the FT is still rather low. There are two reasons for this: firstly, ground-based in situ measurements performed at high-altitude sites are influenced by air masses that are lifted along the mountain slope to the station (Reidmiller et al., 2010) and, thus, often represent rather (polluted) BL air. Secondly, MAX-DOAS measurements have been mainly fo-cused on the BL, where the vast majority of tropospheric pol-lution is found.
Only very recently has a novel approach to estimate NO2
mixing ratios in the FT from MAX-DOAS measurements been proposed (Gomez et al., 2014). In that study, the re-trieval of O4 and NO2 differential slant column densities
(DSCDs) was performed in the visible part of the electro-magnetic spectrum on the basis of data from nine summer days in Izaña having low aerosol levels. The MAX-DOAS observations of that study were performed at a high-altitude site in the subtropics. The great advantage of the method by Gomez et al. (2014) is the averaging of trace gas concentra-tions over a long horizontal path (on the order of a few tens of
ies and provide estimates of NO2 and HCHO mixing ratios
in the FT. For this purpose, two long-term MAX-DOAS data sets from two high-altitude sites located at midlatitudes and in the tropics are analyzed. In contrast to Gomez et al. (2014) and Gil-Ojeda et al. (2015), the retrieval of O4, NO2, and
HCHO DSCDs in our study is performed in the ultraviolet (UV) range of the electromagnetic spectrum. Here, we ob-tain monthly means of NO2and HCHO mixing ratios during
clear-sky conditions at the two measurement sites, focus on the seasonal variability, and compare our values with values reported in the literature. To the best of the authors’ knowl-edge, this is the first study presenting HCHO mixing ratios in the FT based on long-term MAX-DOAS measurements.
In Sect. 2, the MAX-DOAS system and the two measure-ment locations are described. The modified geometrical ap-proach as proposed by Gomez et al. (2014) to estimate hor-izontal optical path lengths (hOPLs) and mixing ratios of NO2 from MAX-DOAS DSCDs is briefly summarized in
Sect. 3. The simulation of synthetic spectra using the radia-tive transfer model SCIATRAN is described in Sect. 4. De-tails about the analysis of measured and synthetic spectra us-ing the DOAS method are given in Sect. 5. The results of this study – including a comparison of measured and synthetic O4
DSCDs and the analysis of hOPLs, NO2, and HCHO mixing
ratios for both locations – are presented in Sect. 6. A short summary and conclusions are given in Sect. 7.
2 Instrumentation and location
horizon-tal path might be slightly affected by the contribution of trace gas absorption at lower altitudes (up to 500 m below the mea-surement stations at the end of the hOPL). Nevertheless, the mixing ratios as presented in Sects. 6.3 and 6.4 for NO2and
HCHO, respectively, are still considered to be representative of the free troposphere. As a result of the wavelength range of the spectrometer covering 321–410 nm, HCHO retrieval is possible, and the retrieval of O4and NO2DSCDs is restricted
to the UV spectral region in this study (see Sect. 5).
In February 2003, the MAX-DOAS instrument was tem-porarily set up at the midlatitude site Zugspitze, Germany, where it performed measurements until the end of July 2003. The underlying intention behind choosing Zugspitze as a measurement location was the fact that MAX-DOAS mea-surements of NO2could be used to validate satellite-derived
stratospheric NO2columns as most of the NO2above this
al-titude is assumed to belong to the stratosphere. The telescope was orientated at 120◦ azimuth (east-southeast) throughout the measurement period, and elevation angles (α)of 0, 4, 7,
16, 30, and 90◦(zenith) were selected for the scanning se-quence. As there were unfortunately no measurements per-formed in the horizontal direction (α=0◦) during Febru-ary and March, which are needed for the estimation of NO2
and HCHO mixing ratios based on the modified geometrical approach (MGA) (see Sect. 3), the analysis is restricted to April, May, June, and July at this location.
After successful measurements at Zugspitze, the MAX-DOAS instrument was transferred to Pico Espejo, Venezuela, and put into operation in March 2004. Measurements were then made until February 2009. Pico Espejo is located in a tropical region that is generally unperturbed by tropospheric pollution. However, Hamburger et al. (2013) observed in-creased aerosol amounts during the dry season by analyzing in situ measurements from the same station. They suggested that these aerosols are dominated by Venezuelan savanna fires and lifted from lower altitudes to the mountain peak. Therefore, these elevated aerosol loads can be attributed to BL air masses. At the Pico Espejo station, consecutive view-ing directions of 0, 4, 7, 16, and 90◦were scanned at a con-stant azimuth angle of 180◦(south). In the year 2006, addi-tional viewing directions were included, and thus fewer data for bothα=0◦andα=90◦are available from that date on (see Sect. 6.2). The meteorological conditions at Pico Es-pejo with permanent cloud cover during the wet season (from April to November) limit the data analysis to the dry-season months December, January, February, and March.
3 Modified geometrical approach
In a recent study by Gomez et al. (2014), a MGA to estimate long-path-averaged mixing ratios of trace gases (e.g., NO2)
from mountain MAX-DOAS measurements was proposed. Briefly, MGA assumes a single-scattering geometry and a scattering point altitude close to that of the instrument. In
or-der to validate the former assumption, Gomez et al. (2014) performed radiative transfer model (RTM) simulations and found that the calculated hOPL for single and multiple scat-tering agrees within 5 % for solar zenith angle (SZA) < 70◦. As the slant paths of the zenith (α=90◦) and horizontal (α=0◦) measurements in single-scattering approximation are identical up to the scattering point, they cancel in the DSCD when using a zenith sky background spectrum close in time. The column of the trace gas in the horizontal part of the optical path can thus be determined. The MGA is a useful concept to derive free-tropospheric trace gas mixing ratios at high altitudes, where horizontal MAX-DOAS measurements are possible and aerosol loads are usually low.
The hOPL is obtained in a first step by subtracting the zenith O4DSCD from the horizon O4DSCD, divided by the
number density of O4(nO4)at the level of the station:
hOPL=DSCD(O4,0
◦)−DSCD(O
4,90◦) nO4
, (1)
wherenO4 is easily calculated by
nO4=(nO2)2=(nair×0.20942)2. (2) In our study, the zenith measurements are interpolated be-tween the SZAs of the horizontal measurements. Thus, no further correction with respect to the differences in DSCDs due to a difference in SZA between the sequentially scans is required. The number density of air (nair) at the
alti-tude of Zugspitze and Pico Espejo is extracted from the re-spective midlatitude summer and tropical reference atmo-spheric model profiles of the Air Force Geophysics Labo-ratory (AFGL) standard atmosphere (Anderson et al., 1986). In the second step, the mean mixing ratio of the trace gas (XNO2 and XHCHO)is estimated for the level of the station by dividing the NO2 and HCHO DSCD differences by the
hOPL andnair:
XNO2,HCHO=
DSCD
(NO2,HCHO,0◦
)−DSCD(NO2,HCHO,90◦ )
hOPL
nair .
(3) Recently, Spinei et al. (2015) have shown that too large O4
slant column densities are obtained when using laboratory-measured O4 cross sections (e.g., Hermans et al., 1999) in
low effective-temperature conditions. They report a temper-ature dependence in the O4 absorption cross section from
231 to 275 K at about 9±2.5 % per 44 K rate in the 335– 390 nm spectral window and suggest a small correction fac-tor of 0.94±0.02 at 231 K when using O4 cross sections measured at room temperature. Following the recommenda-tions made by Spinei et al. (2015), an overestimation of up to 6 % in hOPL and, thus, an underestimation in NO2 and
Figure 1.Schematic illustration of the MAX-DOAS observation geometry in a typical urban and/or rural setting (left) and in mountainous terrain (right). While the altitude of the instrument’s horizontal path (hpath)corresponds to the ground level (hground)of the surrounding area in the left sketch,hpathis larger thanhgroundin the right graph.
Gomez et al. (2014) provide a detailed discussion about possible errors that may occur in the MGA. They report an error in the range of 20 % for SZAs < 70◦, which steeply increases to about 50 % towards SZA=80◦. We follow the recommendations made by Gomez et al. (2014) and estimate hOPL as well as XNO2 and XHCHOonly for SZAs < 70◦.
4 Simulation of synthetic spectra
In order to determine the effect of altitude settings and sur-face albedo on the O4DSCDs and moreover to compare the
measured with simulated O4DSCDs at the two high-altitude
stations, synthetic spectra (intensities) are computed for sin-gle clear-sky days using the radiative transfer model SCI-ATRAN, which is applied in the 1-D case (Rozanov et al., 2005).
Briefly, the software package SCIATRAN was developed for modeling radiative transfer processes in the atmosphere and ocean. The simulations can be performed for obser-vations made by ground-based, satellite-based, ship-based, and balloon-borne instruments in the spectral range from UV to thermal infrared. The latest release of SCIATRAN includes multiple-scattering processes, polarization, thermal emission, and ocean–atmosphere coupling (Rozanov et al., 2014).
The major advantage of 1-D RTMs is their low compu-tation time and their ability to reproduce radiative transfer for clear-sky conditions and over flat terrains quite well. For mountainous terrains, however, factors such as altitude and surface albedo are more difficult to treat. The computation of intensities/radiances for ground-based MAX-DOAS instru-ments using SCIATRAN requires, amongst other things, in-formation on the height above sea level. For a typical mea-surement station in an urban area, for example, the altitude of the instrument’s horizontal path (hpath) does not differ
much from the ground level (hground)of the surrounding area
(Fig. 1, left). Therefore,hpathwould be configured by the
in-put forhgroundaccordingly, and the position of the instrument
in SCIATRAN would be set to “bottom of the atmosphere”.
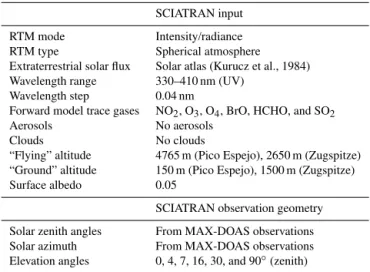
Table 1.Parameter settings used for the computation of synthetic spectra with the radiative transfer model SCIATRAN.
SCIATRAN input RTM mode Intensity/radiance RTM type Spherical atmosphere Extraterrestrial solar flux Solar atlas (Kurucz et al., 1984) Wavelength range 330–410 nm (UV)
Wavelength step 0.04 nm
Forward model trace gases NO2, O3, O4, BrO, HCHO, and SO2
Aerosols No aerosols Clouds No clouds
“Flying” altitude 4765 m (Pico Espejo), 2650 m (Zugspitze) “Ground” altitude 150 m (Pico Espejo), 1500 m (Zugspitze) Surface albedo 0.05
SCIATRAN observation geometry Solar zenith angles From MAX-DOAS observations Solar azimuth From MAX-DOAS observations Elevation angles 0, 4, 7, 16, 30, and 90◦(zenith)
However, for high-altitude stations such as Zugspitze and Pico Espejo these settings are no longer valid as they are both located on mountain peaks and information about the atmosphere below would be lost (Fig. 1, right). Therefore, the altitude settings in SCIATRAN are adjusted by assuming that the MAX-DOAS instrument is “flying” at the respec-tive altitude of the two measurement stations and setting the ground level to 1500 and 150 m for Zugspitze and Pico Es-pejo, respectively. The latter values are chosen and optimized in approximate accordance to a representative altitude of the respective terrain in the immediate vicinity, or more specif-ically below the expected respective light path. The lower value selected for Pico Espejo is a result of the wide Orinoco plains in central Venezuela. For the simulations performed in this study, a surface albedo of 0.05 is used for both locations, which seems reasonable for the analyzed spring and summer season at Zugspitze and the dry season at Pico Espejo.
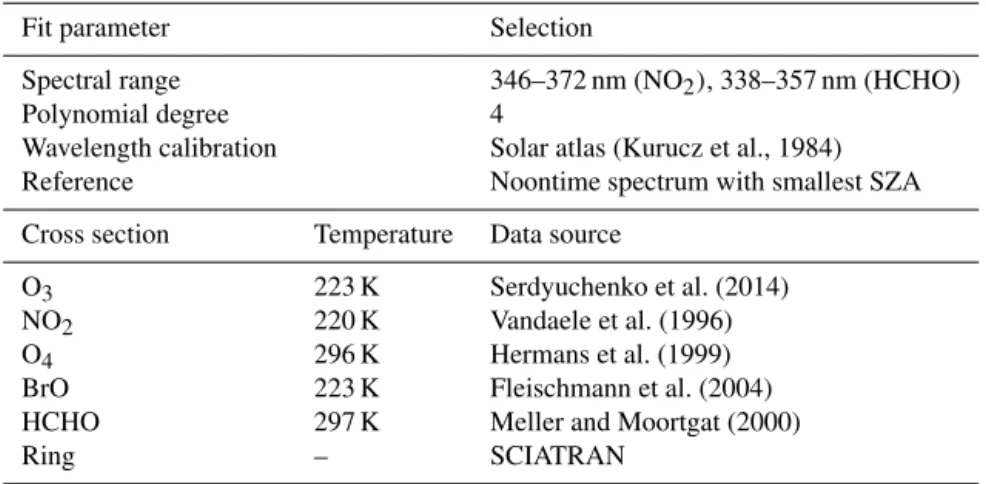
Table 2.Fit parameters and cross sections included in the spectral fitting procedure.
Fit parameter Selection
Spectral range 346–372 nm (NO2), 338–357 nm (HCHO)
Polynomial degree 4
Wavelength calibration Solar atlas (Kurucz et al., 1984) Reference Noontime spectrum with smallest SZA
Cross section Temperature Data source
O3 223 K Serdyuchenko et al. (2014)
NO2 220 K Vandaele et al. (1996)
O4 296 K Hermans et al. (1999)
BrO 223 K Fleischmann et al. (2004)
HCHO 297 K Meller and Moortgat (2000)
Ring – SCIATRAN
selected for the simulations. The forward model trace gases NO2, O3, O4, BrO, HCHO, and SO2, but no aerosols and
clouds, are implemented in the model runs. Atmospheric pro-files are taken from the U.S. Standard Atmosphere 1976. The input for SZAs and solar azimuth angles (SAZs) for the se-lected days is taken from the MAX-DOAS measurements of the respective days. A summary of the input parameters used in SCIATRAN is given in Table 1.
5 DOAS retrieval of O4, NO2, and HCHO differential slant column densities
The differential optical absorption spectroscopy (DOAS) method is performed on the measured and synthetic spectra to obtain O4, NO2, and HCHO DSCDs, which are the
param-eters used for the MGA-based estimation of hOPLs as well as XNO2 and XHCHOat the two high-altitude sites.
Briefly, DOAS is based on absorption spectroscopy fol-lowing Beer–Lambert’s law of absorption and developed for the determination of atmospheric trace gas concentrations from remote-sensing measurements of light in the UV, vis-ible, and near-infrared (NIR) spectral range (Platt and Stutz, 2008, and references therein). After removing the smoothly varying contributions of Mie and Rayleigh scattering from the signal, DOAS becomes sensitive to variations in absorp-tion with wavelength. Due to the fact that individual trace gases have characteristic spectral signatures, they can be sep-arated from the signal and quantified in terms of trace gas concentration, integrated along the atmospheric light path.
The trace gases of interest in our study – O4, NO2, and
HCHO – have spectral fingerprints in the UV and visible spectral range. As mentioned above, the spectrometer of the MAX-DOAS system at Zugspitze and Pico Espejo collected scattered sunlight between 321 and 410 nm. Therefore, the DOAS fits performed in our study are restricted to the UV.
The DOAS method is performed on the measured and syn-thetic spectra in the spectral range of 346–372 nm, where O4
and NO2 spectral fingerprints are obvious and interference
with other trace gases is rather low (Platt and Stutz, 2008, and references therein). For the retrieval of HCHO, the spec-tral window of the DOAS analysis is shifted to 338–357 nm. Absorption cross sections of O3at 223 K, NO2at 220 K, O4
at 296 K, BrO at 223 K, and HCHO at 297 K, as well as a ring spectrum and a polynomial of order 4, are included in the nonlinear least-squares fitting procedure. For the removal of Fraunhofer lines in the solar spectrum, the measured and synthetic spectra are divided by a reference spectrum (here, a noontime spectrum atα=90◦ with the smallest SZA is used). The resulting output of the DOAS fit is the difference in slant column amounts of O4, NO2, and HCHO between
the measured/synthetic and reference spectrum, and thus re-ferred to as DSCD. A summary of fit parameters and cross sections used for the DOAS analysis is summarized in Ta-ble 2.
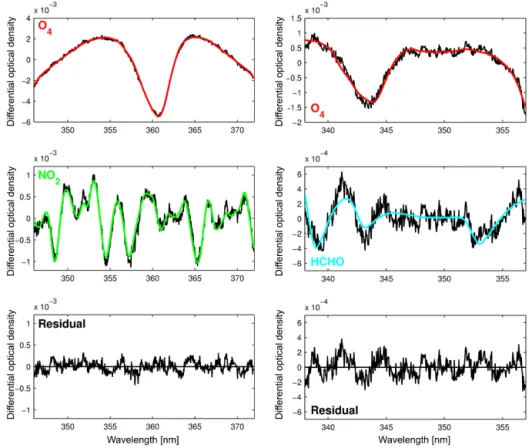
An example of the spectral DOAS analysis in the 346– 372 nm fitting window is shown in Fig. 2 (left) for a single spectrum, which was measured under elevated NO2pollution
on 16 April 2003 (SZA=37.86◦,α=0◦) at Zugspitze. For the retrieval of O4and NO2DSCDs on that day, a spectrum
in zenith direction (α=90◦) taken at noon (SZA=37.36◦) is used as a reference. Fit results of the DOAS analysis for the same measurement, but in the 338–357 nm fitting window, yield similar values for the residuals and root mean square (rms) and indicate that HCHO amounts were also higher than usual on that day (Fig. 2, right).
6 Results
6.1 Measured and synthetic O4differential slant column densities
Figure 2.Exemplary fit results of the DOAS analysis in the 346–372 nm (left) and 338–357 nm (right) fitting window for a horizontal noontime MAX-DOAS spectrum (α=0◦, SZA=37.86◦) as measured on 16 April 2003 at Zugspitze under elevated NO2(DSCD=1.228×
1016molec cm−2)and HCHO (DSCD=1.737×10¹⁶molec cm−2)pollution. The red (upper panel), green (middle panel), and cyan (middle panel) lines show the O4, NO2, and HCHO cross sections, respectively, as scaled to the O4, NO2, and HCHO absorptions detected in the
measured spectrum (black lines). The residuals with calculated root mean square (rms) errors of 1.2×10⁻⁴(346–372 nm) and 1.3×10⁻⁴
(338–357 nm) are also shown (lower panel).
α=90◦and, thus, on the estimation of hOPL. The settings used for the simulation of synthetic spectra are summarized in Table 1.
Two different altitude settings as represented schemati-cally in Fig. 1 are used as input for SCIATRAN to simulate O4DSCDs at the Pico Espejo site. The resultant O4DSCDs
as retrieved in the 346–372 nm fitting window are shown in Fig. 3 forα=0◦(red) andα=90◦(black). While the solid line represents the scenario that assumeshpath=hground, the
dashed line denotes the modified settings (hpath≫hground).
Clearly, the O4 DSCDs are underestimated when the
set-tings for common rural and/or urban measurement environ-ments (hpath=hground)are assumed for the operation of
SCI-ATRAN. This is the result of light path enhancements due to multiple scattering. For the horizontal viewing direction (α=0◦), the absolute difference of the two scenarios is on the order of 400×1040molec2cm−5 for SZAs between 20 and 70◦. The absolute differences are comparatively low for the vertical viewing direction (α=90◦) but increase to-wards SZA=70◦to about 100×1040molec2cm−5. There-fore, hOPL is underestimated by about 15 % when the atmo-sphere below is cut off in the RTM.
As the Zugspitze site is located in the northern Alps at an altitude of almost 3000 m a.s.l., snow cover at the moun-tain peak and at lower altitudes in the immediate vicinity is common during winter and, as a consequence, the sur-face albedo can change significantly throughout the season. Therefore, another sensitivity test with SCIATRAN is per-formed to evaluate the effect of a changing surface albedo on the O4DSCDs and the corresponding hOPL for this
mea-surement site. The results are shown in Fig. 4 for O4DSCDs
Figure 3.Simulated O4DSCDs (346–372 nm fitting window) at the Pico Espejo site (left) forα=0◦(red) andα=90◦(black), where the
solid (hpath=hground)and dashed (hpath≫hground)lines denote the two different scenarios as described in the text and shown in Fig. 1. The absolute differences between the two scenarios are shown in the right panel for the horizontal and vertical viewing direction.
Figure 4.Simulated O4DSCDs (346–372 nm fitting window) at the Zugspitze site forα=0◦(red) andα=90◦(black) assuming a surface
albedo of 0.05 (solid line) and 0.7 (dashed line). The absolute differences between the two scenarios are shown in the right panel for the horizontal and vertical viewing direction.
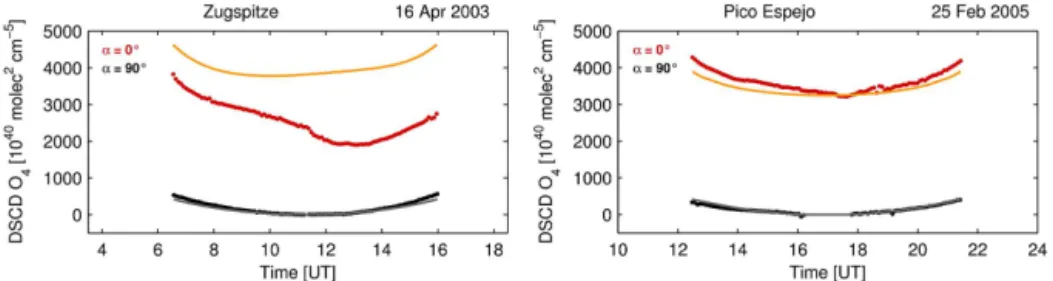
Figure 5.Diurnal evolution of O4DSCDs forα=0◦andα=90◦for single days with clear-sky conditions at Zugspitze (left) and Pico
Espejo (right). Here, O4 DSCDs are retrieved from measured (red and black lines forα=0◦and α=90◦, respectively) and synthetic
(orange and gray lines forα=0◦andα=90◦, respectively) spectra in the 346–372 nm fitting window and only shown for SZAs < 70◦(see
Sect. 3).
penetrate into lower levels of the atmosphere, and thus a sig-nal of the BL could contribute to such a measurement. Con-sequently, measurements over brighter surfaces are less rep-resentative with respect to the analysis of trace gas amounts in the free troposphere when the mountain DOAS approach is applied. This has implications for the interpretation of hOPLs as estimated in mountainous terrains with changing surface albedo throughout the season.
For the comparison of O4DSCDs, the synthetic spectra are
simulated with the modified altitude settings, which assume that the MAX-DOAS instrument is flying at the respective al-titude of the two measurement sites and additionally include an altitude for the ground level to account for the atmosphere below the horizontal path (see Sect. 4).
The diurnal evolution of O4 DSCDs as retrieved in the
346–372 nm fitting window is shown for single clear-sky
days at Zugspitze (left) and Pico Espejo (right) in Fig. 5. In general, the pattern of the measured O4DSCDs (red and
black lines denoteα=0◦andα=90◦, respectively) can be reproduced by SCIATRAN (orange and gray lines denote
α=0◦andα=90◦, respectively) to a large extent (within 20 % for SZA < 70◦) for the zenith geometry at both loca-tions. While the results show good agreement between mea-sured and simulated horizontal O4DSCDs at Pico Espejo, the
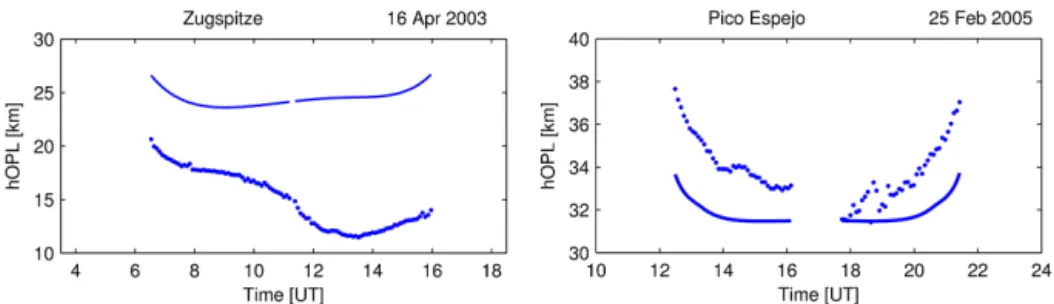
Figure 6.Horizontal optical path length (hOPL) for two single days at Zugspitze (left) and Pico Espejo (right). Here, hOPL is obtained from measured (dotted line) and synthetic (solid line) O4DSCDs in the 346–372 nm fitting window and only shown for SZA < 70◦(see Sect. 3).
6.2 Horizontal optical path length
The estimation of hOPL is based on the O4 DSCDs in the
horizontal (α=0◦) and vertical (α=90◦) viewing directions as obtained from the MAX-DOAS observations at Zugspitze (April–July 2003) and Pico Espejo (March 2004–February 2009). As mentioned in Sect. 2, only the dry-season months (December–March) are considered for the analysis of hOPL and mixing ratios of NO2at the Pico Espejo site to avoid the
cloud problem.
In Fig. 6, the estimated hOPL as derived in the 346– 372 nm fitting window is shown for 16 April 2003 at the Zugspitze site and for 25 February 2005 at the Pico Espejo site. While Zugspitze was influenced by elevated NO2
pol-lution in the afternoon of that day, no significant enhance-ments in NO2DSCDs are observed for Pico Espejo
through-out the selected day (not shown). Clearly, the U-shaped curve of the hOPL as obtained from the measured O4DSCDs
(dot-ted line) is reproduced by the simulations (solid line), and the agreement of both curves is within 10 % for the Pico Espejo case. In general, one would expect smaller hOPLs from the measurements than from the simulations as performed with SCIATRAN without the inclusion of aerosols (see Table 1). One possible explanation for the higher measured values at Pico Espejo could be an aerosol layer below the measure-ment site. The differences are much larger for the case at Zugspitze. While the differences are about 25 % in the morn-ing, they rise to 70 % in the afternoon, when NO2pollution
increased as well (see Sect. 6.1). Again, the better agreement at Pico Espejo might be related to the higher altitude and cleaner atmosphere with negligible Mie scattering.
Gomez et al. (2014) have simulated the hOPL for a single wavelength in the visible spectral range (440 nm) and also found a U-shaped curve with higher values of hOPL towards larger SZAs. However, the distances estimated in their study are larger by a factor of about 2, although the Izaña station is located at a lower altitude (2373 m a.s.l.) than the Zugspitze and Pico Espejo sites. This means that trace gas concentra-tions are averaged over a shorter distance in the UV than in the visible, even at higher altitudes. Consequently, MAX-DOAS measurements in the UV are representative of free-tropospheric trace gas concentrations to a lesser extent than
in the visible as the influence of BL air masses that are lifted to the station is larger for the shorter horizontal path. Nev-ertheless, the hOPL in the UV during clear-sky conditions is still sufficiently long that NO2close to the station is
consid-ered to have a negligible influence.
The hOPLs as derived in the 346–372 nm range are illus-trated in Fig. 7 for the entire period at Zugspitze (April–July 2003) and for one dry season at Pico Espejo (January–March 2005) in the upper and lower panels, respectively. Clearly, higher hOPL values are obtained from the measurements at Pico Espejo (> 40 km) than for those at Zugspitze (> 20 km), which is simply explained by the higher elevation of the for-mer station. While the highest values are observed during clear-sky conditions, low hOPLs are generally connected to clouds. Negative values arise when the retrieved O4DSCD at
α=0◦is negative or lower than O4DSCD atα=90◦, which can happen due to thick stratus clouds with cloud top heights that overtop the altitude of the station and, thus, particularly affect the horizontal MAX-DOAS measurements.
Since the estimation of NO2 and HCHO mixing ratios
only makes sense when the sky in the horizontal and verti-cal viewing directions is neither influenced by clouds nor by high aerosol amounts, the data are filtered for clear-sky cases. For further analyses, only those hOPL values are considered where the rms error of the DOAS fit forα=0◦ is smaller than 5×10⁻⁴, O4 and NO2/HCHO DSCDs in the vertical
Figure 7.Time series of hOPL before (blue) and after (cyan) applying the filter criteria as defined in Sect. 6.2. Here, hOPL is obtained in the 346–372 nm fitting window and shown for the period April–July 2003 at Zugspitze (upper panel) and for an exemplary dry season (January–March 2005) at Pico Espejo (lower panel).
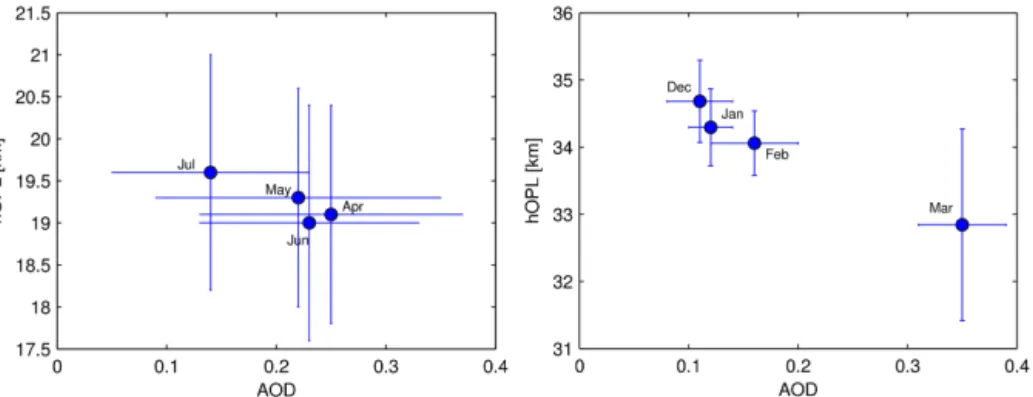
Figure 8.Monthly averaged hOPLs at Zugspitze and multi-year-averaged (2004–2009) monthly means of hOPLs at Pico Espejo as a function of spatially averaged aerosol optical depth (AOD) over selected regions (see Table 3). The standard deviation of daily and monthly means is given for Zugspitze and Pico Espejo (see Table 3). Here, hOPL is obtained from O4DSCDs as retrieved for the 346–372 nm fitting window,
and AOD measurements at 550 nm from MODIS are used.
in the 346–372 nm (338–357 nm) fitting window. Neverthe-less, the remaining data are of good quality and provide im-portant insights into the free troposphere at this station with respect to hOPL, XNO2, and XHCHO. The loss of data is con-siderably less for the Pico Espejo site, where the absolute number of data points decreases from 8364 to 1700 (1682), 10 258 to 944 (354), 2432 to 371 (142), 3019 to 563 (273), and 2081 to 315 (140) in the 346–372 nm (338–357 nm) fitting window after applying the filter criteria for the dry seasons (December–March) of the years 2004–2005, 2005– 2006, 2006–2007, 2007–2008, and 2008–2009, respectively. The monthly means (April–July 2003) and multi-year-averaged (2004–2009) monthly means (December–March) of hOPL as derived in the 346–372 nm fitting window for clear-sky conditions as defined in the paragraph above are shown in Fig. 8 as a function of aerosol optical depth (AOD) for Zugspitze (left) and Pico Espejo (right). AOD is defined
as the integrated extinction coefficient over a vertical column and, thus, does not say anything about the vertical profile of the aerosol load. As for NO2, most of the aerosol load
al-hOPL [km] (338–357 nm) 15.1±1.7 14.4±1.4 13.7±1 14.6±2.1 26.2±1.2 26.8±1.5 26.3±1.9 26.7±1.4 hOPL [km] (346–372 nm) 19.1±1.3 19.3±1.3 19±1.4 19.6±1.4 34.7±0.6 34.3±0.6 34.1±0.5 32.8±1.4 AOD 0.25±0.12 0.22±0.13 0.23±0.1 0.14±0.09 0.11±0.03 0.12±0.02 0.16±0.04 0.35±0.04 XNO2[ppt] (346–372 nm) 93.5±49.8 102±60.5 59.6±55.6 61.8±28.9 8.4±4.2 8.6±3.5 10.5±5.4 15.4±3.9 XHCHO [ppt] (338–357 nm) 497±123 640±277 947±395 634±441 262±23.5 254±36.8 280±51.8 385±38.6
FRP [mW m−2] – – – – 6.8±1.74 12.3±2.54 17.9±3.97 21.9±3.65
titude of the station, monthly gridded means of AOD from the MODIS instrument on board Terra and Aqua satellites have been downloaded from ftp://ladsweb.nascom.nasa.gov/ allData/51/ (Remer et al., 2008) and averaged over both prod-ucts and selected regions (see Table 3). The MODIS instru-ments have 36 channels covering the spectral range from 410 to 14 400 nm and representing three different spatial resolu-tions of 250 m, 500 m, and 1 km. The AOD product used in our study is retrieved at 550 nm and has a spatial resolution of 250 m. Again, the MODIS product provides an extinction coefficient integrated over a vertical column with probably most of the aerosol load being located below the measure-ment stations. Nevertheless, the effect of aerosols on hOPL can still be quantified for the Pico Espejo site as about 20 % of the aerosol load is expected to be found in the free tro-posphere, following the recommendations made by Gonzi et al. (2015). While the estimated hOPLs increase throughout the season at Zugspitze, the results show a decrease of hO-PLs towards the end of the dry season at Pico Espejo (Fig. 8). Clearly, AOD seems to be the main driver affecting hOPL in both cases. The decrease in AOD at Zugspitze might be due to an overall decrease in residential wood burning towards summertime in that region (Szidat et al., 2007). On the other hand, the increase in AOD at Pico Espejo is connected to in-creased biomass burning towards the end of the dry season in that region (Hamburger et al., 2013). Interestingly, there is no relationship between hOPL and AOD observed for the 338–357 nm fitting window (see Table 3). One reason could be the larger uncertainties in O4DSCDs, which are used to
obtain hOPL.
6.3 Long-path-averaged NO2mixing ratios
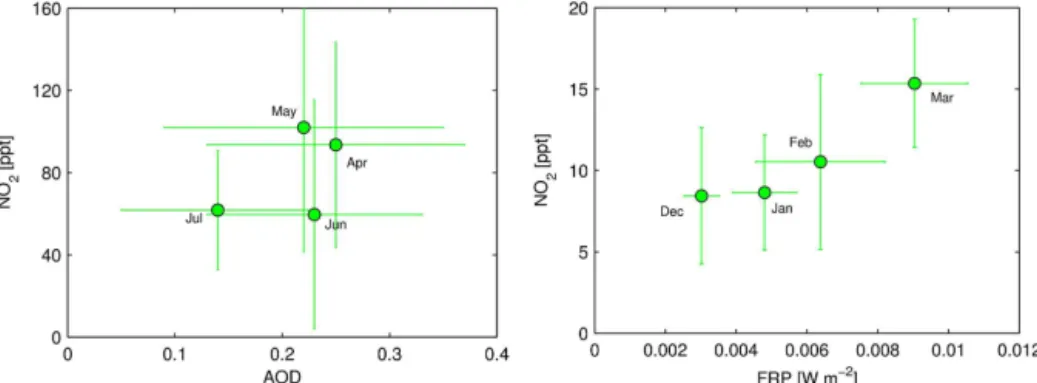
The monthly averaged XNO2 as a function of AOD and the multi-year-averaged monthly means of XNO2as a function of fire radiative power (FRP) are shown in Fig. 9 for Zugspitze (left) and Pico Espejo (right). FRP is defined as the radiant component of energy release from a fire (Kaufmann et al., 1998).
Monthly averaged values of XNO2 at Zugspitze are 93.5±49.8 and 102±60.5 ppt in the spring months April and May, respectively, whereas lower values of 59.6±55.6 and 61.8±28.9 ppt are derived for the summer months June and July. As pollution at the Zugspitze site is mainly an-thropogenically induced, the general co-occurrence of higher AOD and higher XNO2 is not surprising. Clearly, higher val-ues of XNO2 are observed during the spring months April and May, which could be explained by both higher combus-tion due to residential burning and longer lifetime of NO2.
While the values of the months April, May, and July are lin-early related to a large extent, either AOD is higher or XNO2 is lower than expected from the linear relation in June. This slight deviation could be related to the fact that air masses with less NO2 and/or more aerosols crossed the light path
of the instrument in June. However, no significant differ-ences in the origin of air masses between the different months could be found by exploring backward trajectories for the days of measurements that remain after applying the filter criteria to the data (not shown). Theyintercept of the linear
least-squares fit (excluding June) on the order of 20 ppt (not shown) provides some information on the background lev-els of XNO2 in this region and at this altitude. In comparison, Gomez et al. (2014) and Gil-Ojeda et al. (2015) have reported NO2mixing ratios between 20 and 45 ppt for the clean
sub-tropical FT at a similar altitude, which is in good agreement with the background value obtained for Zugspitze, which is located more than 2000 km north of the Izaña station.
The multi-year-averaged values of XNO2 for the higher-elevated station Pico Espejo are somewhat smaller when compared to XNO2 values at Zugspitze (Table 3). As ob-served for Zugspitze, there is a positive linear relationship with AOD (not shown), suggesting a background value of 5.5 ppt. The multi-year-averaged values of XNO2 as a func-tion of multi-year averaged FRP is illustrated in Fig. 9. Clearly, XNO2increases with increasing fire activity towards the end of the dry season. The calculation of a linear least-squares fit reveals ay intercept of 4 ppt, which is in
Figure 9.Monthly averaged XNO2at Zugspitze as a function of AOD and multi-year-averaged (2004–2009) monthly means of XNO2at Pico Espejo as a function of spatially averaged fire radiative power (FRP) over selected regions (see Table 3). The standard deviation of daily and monthly means is given for Zugspitze and Pico Espejo (see Table 3).
Figure 10.Diurnal evolution of XNO2 (for SZA < 70◦but without applying the other filter criteria as described in Sect. 6.2) on 16 April 2003 at Zugspitze as derived using the 338–357 nm (red) and 346–372 nm (blue) fitting windows.
Although the long-path-averaged NO2 mixing ratios
at Pico Espejo are estimated at an altitude of almost 5000 m a.s.l. and are thus clearly above the boundary layer, it seems that the FT is regularly affected by biomass burning emissions in this region.
XNO2as retrieved in the 346–372 nm fitting window (blue) is compared with XNO2 as derived in the 338–357 nm fitting window (red) for a polluted day at Zugspitze (see Fig. 10). In general, the shape of both curves is similar to a large ex-tent, with lowest (highest) values observed in the morning (late afternoon). Although the spectral signatures of NO2and
O4are less pronounced and interference with other gases is
stronger in the 338–357 nm fitting window, mixing ratios of NO2are still in good agreement with XNO2 obtained in the 346–372 nm fitting window.
6.4 Long-path-averaged HCHO mixing ratios
The same analysis that was applied to derive NO2 mixing
ratios in the free troposphere was also applied to HCHO. Due to its characteristic spectral signatures at lower wavelengths, the retrieval of HCHO is shifted to the spectral range from 338 to 357 nm (see Sect. 5 and Table 2).
Figure 11.Diurnal evolution of HCHO DSCDs forα=0◦ (red)
andα=90◦(black) on 16 April 2003 at Zugspitze as retrieved from
measured spectra using the 338–357 nm fitting window.
Figure 12. Diurnal evolution of XHCHO on 16 April 2003 at
Zugspitze without (green) and with (black) applying the filter crite-ria as described in Sect. 6.2. The two blue lines indicate SZA=70◦
on that day.
In Fig. 11, the diurnal evolution of HCHO DSCDs as re-trieved in the 338–357 nm fitting window forα=0◦ (red) andα=90◦(black) is shown for the same day at Zugspitze. As observed for NO2, HCHO levels increase in the
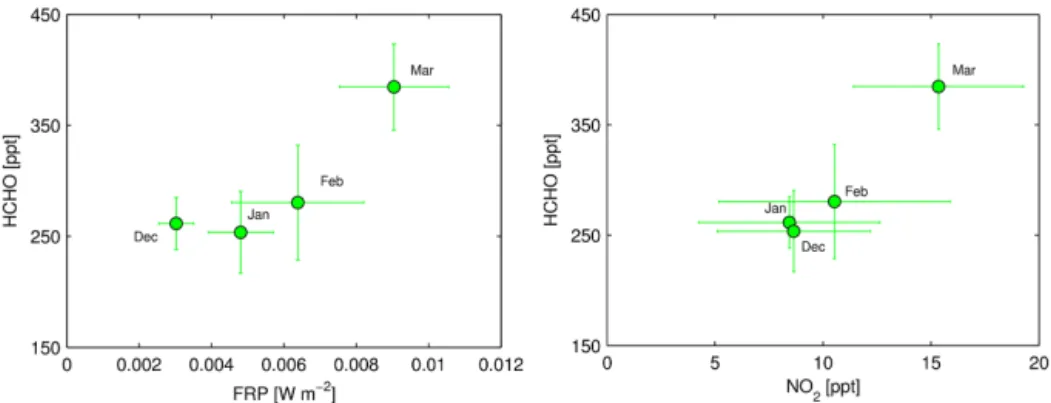
Figure 13.Multi-year-averaged (2004–2009) monthly means of XHCHOas a function of spatially averaged FRP over a selected region (see Table 3) (left) and multi-year-averaged (2004–2009) monthly means of XHCHOas a function of XNO2 (right) at Pico Espejo. The standard deviation of monthly means is given (see Table 3).
project (Kalnay et al., 1996) indicate that air masses from a more densely populated region at lower elevation in the northeast moved along the slope of the Bavarian Alps before crossing the light path of the MAX-DOAS instrument (not shown). While the increase of HCHO DSCD is obvious for
α=0◦(red), HCHO DSCD at 90◦(black) is relatively stable throughout the day, with slightly negative columns obtained in the morning hours.
The filter criteria, as defined in Sect. 6.2, are applied to obtain XHCHOduring clear-sky conditions. An exemplary
di-urnal evolution of XHCHO before (green) and after (black)
applying the filter criteria is shown for the polluted day at Zugspitze in Fig. 12. According to the filter criteria, the re-maining black dots are observed during clear-sky conditions and are in the range of 400–800 ppt.
Monthly means of XHCHObetween April and July are in
the range of 500–950 ppt at the Zugspitze site (Table 3). Air sampling of HCHO deduced from a flight track of the TRO-Pospheric OZone Experiment (TROPOZ-2) above northern Spain/western France reveals HCHO mixing ratios of ∼ 400 ppt at a similar altitude, albeit in the winter season (Ar-lander et al., 1995). According to the seasonal variability of HCHO at midlatitudes as obtained from satellite measure-ments, lowest values of HCHO are observed during winter months (De Smedt et al., 2015). Therefore, the higher val-ues observed in our study during spring and summer months are reasonable. Considerably lower HCHO mixing ratios at Zugspitze are found in April when compared with values in May, June, and July. This is in good agreement with HCHO concentrations as obtained from MAX-DOAS measurements at the high Alpine station Jungfraujoch (Franco et al., 2015). In both cases, the April values are about 35 % lower than the average of May, June, and July values.
Multi-year-averaged monthly means of XHCHO as
ob-tained during the dry season at Pico Espejo are in the range of 255–385 ppt (see Fig. 13 and Table 3) and, thus, well be-low the values deduced at Zugspitze. The comparison with HCHO deduced from air sampling in this region during
TROPOZ-2 is quite revealing, with our values being slightly higher at this altitude. Singh et al. (2001) reported values of HCHO mixing ratios in the range of 100–200 ppt for this alti-tude. However, they used data from a larger region (0–30◦S, 165◦E–100◦W) and focused on the tropospheric composi-tion over the tropical Pacific Ocean.
7 Summary and conclusions
In this study, multi-axis differential optical absorption spec-troscopy data sets from two high-altitude stations at midlat-itudes and in the tropics are analyzed for horizontal optical path lengths and free-tropospheric NO2and HCHO mixing
ratios. The method is based on the modified geometrical ap-proach, which assumes a single-scattering geometry and a scattering point altitude close to the instrument altitude.
For the estimation of hOPL, XNO2, and XHCHO, DSCDs of O4, NO2, and HCHO in the horizontal (0◦) and vertical (90◦)
viewing directions are obtained with a conventional differ-ential optical absorption spectroscopy retrieval between 346 and 372 nm for the NO2 and between 338 and 357 nm for
the HCHO retrieval. In order to compare the O4DSCDs with
synthetic data and moreover to evaluate the effect of a vary-ing surface albedo on the O4DSCDs, the radiative transfer
model SCIATRAN is used. As for the retrieval of O4DSCDs
from MAX-DOAS measurements, the synthetic spectra are also analyzed with the DOAS method.
In general, the measured and synthetic vertical O4DSCDs
are in good agreement (differences < 20%) during clear-sky conditions and for solar zenith angles smaller than 70◦. While the differences between measured and synthetic hor-izontal O4 DSCDs are small at the higher and “cleaner”
Monthly means of hOPL as obtained from the long-term measurements are 19 km (14 km) at Zugspitze, whereas multi-year-averaged monthly means are 34 km (26.5 km) at Pico Espejo for the 346–372 nm (338–357 nm) fitting win-dow. At both high-altitude sites, hOPL as derived in the 346-372 nm fitting window decreases as a function of increasing aerosol amounts. In contrast, no relationship is found for the 338–357 nm fitting window, which could be explained by the larger uncertainties in O4DSCDs.
Long-path-averaged mixing ratios of NO2are obtained
us-ing the estimated hOPL. The monthly means and multi-year-averaged monthly means of XNO2are in the range of 60–100 and 8.5–15.5 ppt at Zugspitze and Pico Espejo, respectively. A statistically significant linear relationship between aerosol optical depth and XNO2 is obtained for the measurements from both measurement sites, suggesting that both NO2and
aerosols are closely connected to air pollution in these re-gions and at the respective altitude level. The results of a linear least-squares fit performed on the averaged data show that upper limits for the background free-troposphere NO2
mixing ratios are about 20 and 4.5 ppt for Zugspitze and Pico Espejo, respectively, where the former value is in good agree-ment with background NO2mixing ratios reported by Gomez
et al. (2014) and Gil-Ojeda et al. (2015) for a similar altitude at the Izaña station (28.3◦N, 16.48◦W, 2373 m a.s.l.). The latter site on Tenerife is relatively remote, whereas Zugspitze is farther north, but both are probably probing on average similar free-tropospheric air masses transported from Tener-ife towards Europe. However, the higher values at midlati-tudes in the Northern Hemisphere as opposed to those close to the Intertropical Covergence Zone (ITCZ) are probably indicating an anthropogenic influence at midlatitudes in the free troposphere.
The same procedure as for XNO2 is applied to obtain XHCHO, albeit for an optimized fitting window covering the
strong spectral signatures of HCHO. The monthly means of XHCHO at the Zugspitze site are 500–950 ppt, which is
rea-sonable when comparing these values with values obtained from air sampling in winter at similar altitudes and latitudes as well as considering a seasonal variability in this region. At midlatitudes, the values of HCHO and NO2are relatively
high for clean conditions. This implies that there is suffi-cient NOx for oxidizing hydrocarbons through photooxida-tive catalytic cycles. As a consequence, production of some tropospheric ozone (O3)is occurring at midlatitudes in the
free troposphere. The values of XHCHO are in the range of
255–385 ppt at Pico Espejo and increase towards the end of the dry season. Moreover, multi-year-averaged monthly means of XHCHOare linearly correlated with the
multi-year-averaged monthly means of XNO2, further supporting the no-tion that emissions from South American biomass burning clearly reach the free troposphere in this region. This prob-ably also implies some photooxidation of hydrocarbons and production of O3 is occurring some of the time in the air
masses observed in the free troposphere above Pico Espejo.
Acknowledgements. This study was funded by the University of Bremen. The setup and operation of the MAX-DOAS instrument on Zugspitze and Pico Espejo were funded by DLR Bonn in the framework of SCIAMACHY validation. We would like to thank Thomas Medeke, Sixten Fietkau, and Astrid Loewe for their work on the DOAS instruments and data and NASA for the provision of MODIS data.
The article processing charges for this open-access publication were covered by the University of Bremen.
Edited by: M. Van Roozendael
References
Anderson, G., Clough, S., Kneizys, F., Chetwynd, J., and Shet-tle, E.: AFGL atmospheric constituent profiles (0–120 km), Tech. Rep. AFGL-TR-86-0110, Air Force Geophys. Lab., Hanscom Air Force Base, Bedford, Mass., 1986.
Anderson, L. G., Lanning, J. A., Barrell, R., Miyagishima, J., Jones, R. H., and Wolfe, P.: Sources and sinks of formaldehyde and acetaldehyde: an analysis of Denver’s ambient concentration data, Atmos. Environ., 30, 2113–2123, 1996.
Andreae, M. O. and Merlet, P.: Emission of trace gases and aerosols from biomass burning, Global Biogeochem. Cy., 15, 955–966, 2001.
Arlander, D. W., Brüning, D., Schmidt, U., and Ehhalt, D. H.: The tropospheric distribution of formaldehyde during TROPOZ II, J. Atmos. Chem., 22, 251–268, 1995.
Choi, S., Joiner, J., Choi, Y., Duncan, B. N., Vasilkov, A., Krotkov, N., and Bucsela, E.: First estimates of global free-tropospheric NO2abundances derived using a cloud-slicing tech-nique applied to satellite observations from the Aura Ozone Monitoring Instrument (OMI), Atmos. Chem. Phys., 14, 10565– 10588, doi:10.5194/acp-14-10565-2014, 2014.
De Smedt, I., Stavrakou, T., Hendrick, F., Danckaert, T., Vlem-mix, T., Pinardi, G., Theys, N., Lerot, C., Gielen, C., Vigouroux, C., Hermans, C., Fayt, C., Veefkind, P., Müller, J.-F., and Van Roozendael, M.: Diurnal, seasonal and long-term variations of global formaldehyde columns inferred from combined OMI and GOME-2 observations, Atmos. Chem. Phys., 15, 12519–12545, doi:10.5194/acp-15-12519-2015, 2015.
Draxler, R. R. and Rolph, G. D.: HYSPLIT (HYbrid Single-Particle Lagrangian Integrated Trajectory) Model access via NOAA ARL READY Website, NOAA Air Resources Laboratory, College Park, MD, available at: http://www.arl.noaa.gov/HYSPLIT.php (last access: May 2014), 2013.
Fleischmann, O. C., Hartmann, M., Burrows, J. P., and Orphal, J.: New ultraviolet absorption cross-sections of BrO at atmospheric temperatures measured by time-windowing Fourier transform spectroscopy, J. Photochem. Photobiol. A: Chemistry, 168, 117– 132, doi:10.1016/j.jphotochem.2004.03.026, 2004.
At-Geophys. Res.-Atmos., 108, 8798, doi:10.1029/2003JD003451, 2003.
Gil-Ojeda, M., Navarro-Comas, M., Gómez-Martín, L., Adame, J. A., Saiz-Lopez, A., Cuevas, C. A., González, Y., Puentedura, O., Cuevas, E., Lamarque, J.-F., Kinninson, D., and Tilmes, S.: NO2seasonal evolution in the north subtropical
free troposphere, Atmos. Chem. Phys., 15, 10567–10579, doi:10.5194/acp-15-10567-2015, 2015.
Gomez, L., Navarro-Comas, M., Puentedura, O., Gonzalez, Y., Cuevas, E., and Gil-Ojeda, M.: Long-path averaged mixing ratios of O3and NO2 in the free troposphere from mountain
MAX-DOAS, Atmos. Meas. Tech., 7, 3373–3386, doi:10.5194/amt-7-3373-2014, 2014.
Gonzi, S., Palmer, P. I., Paugam, R., Wooster, M., and Deeter, M. N.: Quantifying pyroconvective injection heights using ob-servations of fire energy: sensitivity of spaceborne observa-tions of carbon monoxide, Atmos. Chem. Phys., 15, 4339–4355, doi:10.5194/acp-15-4339-2015, 2015.
Guenther, A., Karl, T., Harley, P., Wiedinmyer, C., Palmer, P. I., and Geron, C.: Estimates of global terrestrial isoprene emissions using MEGAN (Model of Emissions of Gases and Aerosols from Nature), Atmos. Chem. Phys., 6, 3181–3210, doi:10.5194/acp-6-3181-2006, 2006.
Hamburger, T., Matis¯ans, M., Tunved, P., Ström, J., Calderon, S., Hoffmann, P., Hochschild, G., Gross, J., Schmeissner, T., Wiedensohler, A., and Krejci, R.: Long-term in situ observations of biomass burning aerosol at a high altitude station in Venezuela – sources, impacts and interannual variability, Atmos. Chem. Phys., 13, 9837–9853, doi:10.5194/acp-13-9837-2013, 2013. Hermans, C., Vandaele, A., Carleer, M., Fally, S., Colin, R.,
Jenou-vrier, A., Coquart, B., and Mérienne, M.-F.: Absorption cross-sections of atmospheric constituents: NO2, O2, and H2O, En-viron. Sci. Pollut. Res., 6, 151–158, doi:10.1007/BF02987620, 1999.
Hönninger, G., von Friedeburg, C., and Platt, U.: Multi axis dif-ferential optical absorption spectroscopy (MAX-DOAS), Atmos. Chem. Phys., 4, 231–254, doi:10.5194/acp-4-231-2004, 2004. Kalnay, E., Kanamitsu, M., Kistler, R., Collins, W., Deaven, D.,
Gandin, L., Iredell, M., Saha, S., White, G., Woollen, J., Zhu, Y., Leetmaa, A., Reynolds, R., Chelliah, M., Ebisuzaki, W., Hig-gins, W., Janowiak, J., Mo, K. C., Ropelewski, C., and Wang, J.: The NCEP/NCAR 40-year reanalysis project, B. Am. Meteorol. Soc., 77, 437–470, 1996.
Kaufmann, Y. J., Justice, C. O., Flynn, L. P., Kendall, J. D., Prins, E. M., Giglio, L., Ward, D. E., Menzel, W. P., and Set-zer, A. W.: Potential global fire monitoring from EOS-MODIS, J. Geophys. Res.-Atmos., 103, 32215–32238, 1998.
Kritten, L., Butz, A., Dorf, M., Deutschmann, T., Kühl, S., Prados-Roman, C., Puk¸¯ıte, J., Rozanov, A., Schofield, R., and Pfeil-sticker, K.: Time dependent profile retrieval of UV/vis absorbing
mos. Environ., 31, 1735–1749, 1997.
Lowe, D. C. and Schmidt, U.: Formaldehyde (HCHO) measure-ments in the nonurban atmosphere, J. Geophys. Res., 88, 844– 858, 1983.
Meller, R. and Moortgat, G. K.: Temperature dependence of the ab-sorption cross sections of formaldehyde between 223 and 323 K in the wavelength range 225–375 nm, J. Geophys. Res., 105, 7089–7101, doi:10.1029/1999JD901074, 2000.
Oetjen, H.: Measurement of halogen oxides by scattered sun-light differential optical absorption spectroscopy, PhD thesis, University of Bremen, Germany, available at: http://www.iup. uni-bremen.de/doas/paper/diss_oetjen_2009.pdf (last access: 2 December 2015), 2009.
Peters, E.: Improved MAX-DOAS measurements and retrievals focused on the marine boundary layer, PhD thesis, University of Bremen, Germany, available at: http://www.iup.uni-bremen. de/doas/paper/diss_peters_2013.pdf (last access: 2 December 2015), 2013.
Platt, U. and Stutz, J.: Differential Optical Absorption Spec-troscopy, Physics of Earth and Space Environments, Springer, Berlin, 2008.
Reidmiller, D. R., Jaffe, D. A., Fischer, E. V., and Finley, B.: Ni-trogen oxides in the boundary layer and free troposphere at the Mt. Bachelor Observatory, Atmos. Chem. Phys., 10, 6043–6062, doi:10.5194/acp-10-6043-2010, 2010.
Remer, L. A., Kleidman, R. G., Levy, R. C., Kaufmann, Y. J., Tanré, D., Mattoo, S., Martins, J. V., Ichoku, C., Koren, I., Yu, H., and Holben, B. N.: Global aerosol climatology from the MODIS satellite sensors, J. Geophys. Res.-Atmos., 113, D14S07, doi:10.1029/2007JD009661, 2008.
Rozanov, A., Rozanov, V. V., Buchwitz, M., Kokhanovsky, A. A., and Burrows, J. P.: SCIATRAN 2.0 – a new radiative transfer model for geophysical applications in the 175– 2400 nm spectral region, Adv. Space Res., 36, 1015–1019, doi:10.1016/j.asr.2005.03.012, 2005.
Rozanov, V., Rozanov, A., Kokhanovsky, A., and Burrows, J.: Ra-diative transfer through terrestrial atmosphere and ocean: soft-ware package SCIATRAN, J. Quant. Spectrosc. Ra., 133, 13–71, doi:10.1016/j.jqsrt.2013.07.004, 2014.
Schuster, G., Wilson, S., and Helas, G.: Formaldehyde measure-ments in the free troposphere, in: Physico-Chemical Behaviour of Atmospheric Pollutants, edited by: Restelli, G. and An-geletti, G., Kluwer Academic Publishers, Dordrecht/Boston-London 1990, 553–557, 1990.
Seco, R., Penuelas, J., and Filella, I.: Short-chain oxygenated VOCs: emission and uptake by plants and atmospheric sources, sinks, and concentrations, Atmos. Environ., 41, 2477–2499, 2007.
cross-sections – Part 2: Temperature dependence, Atmos. Meas. Tech., 7, 625–636, doi:10.5194/amt-7-625-2014, 2014.
Singh, H., Chen, Y., Staudt, A., Jacob, D., Blake, D., Heikes, B., and Snow, J.: Evidence from the Pacific troposphere for large global sources of oxygenated organic compounds, Nature, 410, 1078–1081, 2001.
Singh, H. B., Brune, W. H., Crawford, J. H., Flocke, F., and Ja-cob, D. J.: Chemistry and transport of pollution over the Gulf of Mexico and the Pacific: spring 2006 INTEX-B campaign overview and first results, Atmos. Chem. Phys., 9, 2301–2318, doi:10.5194/acp-9-2301-2009, 2009.
Spinei, E., Cede, A., Herman, J., Mount, G. H., Eloranta, E., Mor-ley, B., Baidar, S., Dix, B., Ortega, I., Koenig, T., and Volkamer, R.: Ground-based direct-sun DOAS and airborne MAX-DOAS measurements of the collision-induced oxygen complex, O2O2,
absorption with significant pressure and temperature differences, Atmos. Meas. Tech., 8, 793–809, doi:10.5194/amt-8-793-2015, 2015.
Szidat, S., Prevot, A. S. H., Sandradewi, J., Alfarra, M. R., Synal, H.-A., Wacker, L., and Baltensperger, U.: Dominant impact of residential wood burning on particulate matter in Alpine valleys during winter, Geophys. Res. Lett., 34, L05820, doi:10.1029/2006GL028325, 2007.
Vandaele, A. C., Hermans, C., Simon, P. C., Roozendael, M. V., Guilmot, J. M., Carleer, M., and Colin, R.: Fourier transform measurement of NO2 absorption cross-section in the visible range at room temperature, J. Atmos. Chem., 25, 289–305, 1996. Weller, R., Schrems, O., Boddenberg, A., Gäb, S., and Gautrois, M.: Meridional distribution of hydroperoxides and formaldehyde in the marine boundary layer of the Atlantic (48◦N–35◦S) mea-sured during the Albatross campaign, J. Geophys. Res., 105, 14401–14412, 2000.
Wittrock, F., Oetjen, H., Richter, A., Fietkau, S., Medeke, T., Rozanov, A., and Burrows, J. P.: MAX-DOAS measurements of atmospheric trace gases in Ny-Ålesund – Radiative transfer studies and their application, Atmos. Chem. Phys., 4, 955–966, doi:10.5194/acp-4-955-2004, 2004.