ACPD
12, 3983–4029, 2012MAX-DOAS trace gases measurements
in China
X. Li et al.
Title Page
Abstract Introduction
Conclusions References
Tables Figures
◭ ◮
◭ ◮
Back Close
Full Screen / Esc
Printer-friendly Version Interactive Discussion
Discussion
P
a
per
|
Dis
cussion
P
a
per
|
Discussion
P
a
per
|
Discussio
n
P
a
per
|
Atmos. Chem. Phys. Discuss., 12, 3983–4029, 2012 www.atmos-chem-phys-discuss.net/12/3983/2012/ doi:10.5194/acpd-12-3983-2012
© Author(s) 2012. CC Attribution 3.0 License.
Atmospheric Chemistry and Physics Discussions
This discussion paper is/has been under review for the journal Atmospheric Chemistry and Physics (ACP). Please refer to the corresponding final paper in ACP if available.
MAX-DOAS measurements of NO
2
, HCHO
and CHOCHO at a rural site in Southern
China
X. Li1,2, T. Brauers2, A. Hofzumahaus2, K. Lu1,2, Y. P. Li1,2, M. Shao1, T. Wagner3, and A. Wahner2
1
College of Environmental Sciences and Engineering, Peking University, Beijing, China
2
Institut f ¨ur Energie- und Klimaforschung Troposph ¨are (IEK-8), Forschungszentrum J ¨ulich, J ¨ulich, Germany
3
Max-Planck-Institut f ¨ur Chemie, Mainz, Germany
Received: 12 January 2012 – Accepted: 23 January 2012 – Published: 3 February 2012
Correspondence to: T. Brauers ([email protected])
Published by Copernicus Publications on behalf of the European Geosciences Union.
ACPD
12, 3983–4029, 2012MAX-DOAS trace gases measurements
in China
X. Li et al.
Title Page
Abstract Introduction
Conclusions References
Tables Figures
◭ ◮
◭ ◮
Back Close
Full Screen / Esc
Printer-friendly Version Interactive Discussion
Discussion
P
a
per
|
Dis
cussion
P
a
per
|
Discussion
P
a
per
|
Discussio
n
P
a
per
|
Abstract
We performed MAX-DOAS measurements during the PRIDE-PRD2006 campaign in the Pearl River Delta region (PRD), China, for 4 weeks in July 2006 at a site located 60 km north of Guangzhou. The vertical distributions of NO2, HCHO, and CHOCHO were independently retrieved by an automated iteration method. The MAX-DOAS
mea-5
sured NO2mixing ratios showed reasonable agreement with the simultaneous, ground based in-situ data. While the tropospheric NO2 vertical column densities (VCDs) ob-served by OMI on board EOS-Aura satellite agreed with those by MAX-DOAS, the 3-D chemical transport model CMAQ overestimated the NO2VCDs as well as the surface concentrations by about 40 %. From this observation, a reduction of NOX emission
10
strength in CMAQ seems to be necessary in order to well reproduce the NO2 observa-tions. The average mixing ratios of HCHO and CHOCHO were 12 ppb and 1.6 ppb, re-spectively, substantially higher than in other rural or semirural environments. The high ratio of 0.135 between CHOCHO and HCHO corresponds to the high VOCs reactivity and high HOX turnover rate consistent with other observations during the campaign.
15
1 Introduction
Multi-axis differential optical absorption spectroscopy (MAX-DOAS) is a novel and ef-fective remote sensing method for measuring tropospheric trace gases such as SO2, HCHO, NO2, CHOCHO (Irie et al., 2011; Wagner et al., 2011, and references therein). MAX-DOAS uses scattered sunlight at different elevation angles α (i.e. the angle
be-20
tween horizon and the pointing direction of the telescope). The slant column density (SCD), which is the concentration of a species integrated along the paths where the registered photons traveled, can be derived from a DOAS fit. Despite the simplicity of the experimental setup, the conversion from measured SCDs to trace gas concentra-tions or profiles is a demanding task. As illustrated in Table 1, along with the numerous
25
ACPD
12, 3983–4029, 2012MAX-DOAS trace gases measurements
in China
X. Li et al.
Title Page
Abstract Introduction
Conclusions References
Tables Figures
◭ ◮
◭ ◮
Back Close
Full Screen / Esc
Printer-friendly Version Interactive Discussion
Discussion
P
a
per
|
Dis
cussion
P
a
per
|
Discussion
P
a
per
|
Discussio
n
P
a
per
|
trace gas concentrations have been developed. The geometric approach, which is based on the assumption that a photon was scattered only once before it reaches the telescope, was used for estimating the trace gas concentrations in remote areas (Leser et al., 2003). However, for MAX-DOAS observations in the UV or at high aerosol loads the single scattering assumption is not valid. Under these conditions, radiative transfer
5
models (RTMs) are required to derive trace gas profiles from measured SCDs. The different RTMs (see Table 1) calculate SCDs for trace gases on the basis of trace gas profiles as input to the model. In order to optimize the model input an inversion method is needed. This can either be optimal estimation (Rodgers, 2000) or an iteration pro-cedure as presented by Pikelnaya et al. (2007). Both algorithms consist of two steps,
10
i.e. first the aerosol extinction profile is retrieved from the measured oxygen dimer (O4) absorptions, then the trace gas profile is retrieved from the measured trace gas absorp-tions taking the aerosol extinction profile into account. Given the routinely MAX-DOAS measurements often generate large data sets, an automated inversion method (e.g., Irie et al., 2011) is highly preferable. Inherently, only 2–3 independent pieces of profile
15
information can be retrieved from the MAX-DOAS measurements. Therefore, during the inversion process, either a-priori information on the profile needs to be provided or a profile parameterization needs to be applied based on assumptions of the profile shape. Recent studies have compared the MAX-DOAS measured trace gas (e.g. NO2, HCHO) concentrations in the boundary layer to those obtained by in-situ techniques. In
20
general, the differences were within 30 % (Pikelnaya et al., 2007; Inomata et al., 2008; Irie et al., 2011; Wagner et al., 2011). In addition, MAX-DOAS can serve as a tool to validate satellite-borne trace gas observations. The differences between MAX-DOAS and satellite measured NO2 tropospheric vertical column densities were found to be 10–50 % for selected regions (Irie et al., 2008; Brinksma et al., 2008; Boersma et al.,
25
2009).
With the fast economic growth, the air quality has been of increasing concern in the Pearl River Delta (PRD) region in Southern China. In the last years, PRD was identified by satellite measurements as one of the “hot-spots” of NO2, HCHO, and
ACPD
12, 3983–4029, 2012MAX-DOAS trace gases measurements
in China
X. Li et al.
Title Page
Abstract Introduction
Conclusions References
Tables Figures
◭ ◮
◭ ◮
Back Close
Full Screen / Esc
Printer-friendly Version Interactive Discussion
Discussion
P
a
per
|
Dis
cussion
P
a
per
|
Discussion
P
a
per
|
Discussio
n
P
a
per
|
CHOCHO (Richter et al., 2005; Wittrock et al., 2006; Vrekoussis et al., 2009). The observed high NO2 levels reflect the prevailing anthropogenic emission sources, e.g. vehicles and industrial sources. Since HCHO and CHOCHO are mainly produced through the oxidation of volatile organic compounds (VOCs), their high concentration levels indicate the large photochemical turnover in the PRD atmosphere. However,
5
only a few ground-based HCHO and CHOCHO measurements were reported for this region. During the PRIDE-PRD2006 field campaign, we performed one month of con-tinuous MAX-DOAS observations for O4, NO2, HCHO, and CHOCHO. An automated aerosol retrieval method using O4absorption was developed, and the retrieved aerosol extinction agreed well with the total aerosol scattering measured by a nephelometer
10
(Li et al., 2010). Here, we present the retrieval method and results for NO2, HCHO, and CHOCHO concentrations. These results are discussed with respect to simulta-neously measured in-situ data, satellite observations, and chemical transport model simulations.
2 Experimental
15
2.1 Field campaign and measurement site
The PRIDE-PRD2006 field campaign took place in July 2006 in the Pearl River Delta (PRD) region in Southern China within the framework of the “Program of Regional Integrated Experiments of Air Quality over the Pearl River Delta” (PRIDE-PRD2006). The campaign focused on photochemistry and the formation of secondary pollutants
20
like ozone and particles (Zhang et al., 2012). The MAX-DOAS measurements were conducted at one of the campaign supersites Back Garden (BG) located 23.50◦N and 113.03◦E. The BG site is approximately 60 km NW of downtown Guangzhou. It is located next to a water reservoir and is surrounded by farmland and small forests. During the campaign, the local traffic was quite limited. However, road works,
build-25
ACPD
12, 3983–4029, 2012MAX-DOAS trace gases measurements
in China
X. Li et al.
Title Page
Abstract Introduction
Conclusions References
Tables Figures
◭ ◮
◭ ◮
Back Close
Full Screen / Esc
Printer-friendly Version Interactive Discussion
Discussion
P
a
per
|
Dis
cussion
P
a
per
|
Discussion
P
a
per
|
Discussio
n
P
a
per
|
surrounding areas. The biomass and cable burning events were intense and prevailing in the period between 23 July and 25 July leading to high concentrations of aerosols and trace gases (Garland et al., 2008; Lou et al., 2010). The entire campaign was char-acterized by tropical weather conditions with high temperatures (28–36◦C) and high humidities (60–95 % RH). Extended rainfall occurred in periods influenced by typhoons
5
Bilis (15–18 July) and Kaemi (26–29 July). The wind speed at BG site was usually low (less than 2 m s−1) in most of the time, which is a typical situation for inland areas in PRD during summer time (Fan et al., 2011). Such meteorological conditions favors the formation and accumulation of air pollution. High OH radical concentrations with noontime peak values of (1.5–2.6)×107cm−3as well as high OH reactivitieskOHwith
10
values between 20 s−1and 120 s−1were observed at the BG site during the campaign (Lou et al., 2010; Lu et al., 2011). These observations indicate a strong photochemical processing compared to those in other places in the world.
A comprehensive suit of instruments was simultaneously operated at the BG super-site for the characterization of trace gases (Hua et al., 2008; Hofzumahaus et al., 2009;
15
Lou et al., 2010; Lu et al., 2011; Li et al., 2011) and aerosols (Garland et al., 2008; Li et al., 2010; Yue et al., 2010; Xiao et al., 2011) in the local atmosphere. Measure-ments of NOX, O3, SO2, H2O2, CO, CH4, C3-C12 VOCs, CH3OOH, HCHO, CHOCHO, aerosol physical and chemical properties, and photolysis frequencies were performed on top of a hotel building (10 m a.g.l.) which was exclusively used by the measurement
20
team. OH, HO2, HONO, and OH reactivities were measured on top of a two stacked sea containers located about 200 m away from the hotel building. Detailed information with respect to the instrumentations, the accuracy and precision of the measurements can be found in Hofzumahaus et al. (2009), Yue et al. (2010), and Li et al. (2011).
2.2 MAX-DOAS
25
Our MAX-DOAS measurements were conducted by a commercial Mini-MAX-DOAS instrument (Fa. Hoffmann, Rauenberg, Germany). Since the instrument setup was de-scribed in detail by Li et al. (2010), only a brief outline follows. The Mini-MAX-DOAS
ACPD
12, 3983–4029, 2012MAX-DOAS trace gases measurements
in China
X. Li et al.
Title Page
Abstract Introduction
Conclusions References
Tables Figures
◭ ◮
◭ ◮
Back Close
Full Screen / Esc
Printer-friendly Version Interactive Discussion
Discussion
P
a
per
|
Dis
cussion
P
a
per
|
Discussion
P
a
per
|
Discussio
n
P
a
per
|
instrument was installed on top of the hotel building, pointing East. It uses a miniature crossed Czerny-Turner spectrometer unit USB2000 (Ocean Optics Inc.) for spectrum sampling. The spectrometer covers the spectral range of 292 nm to 443 nm with a spec-tral resolution of≈0.7 nm full width at half maximum (FWHM). The scattered sunlight was collected and focused by a quartz lens and was led into the spectrometer unit by
5
a quartz fiber bundle. A step motor was used for adjusting the viewing direction to a desired elevation angleα, i.e. 90◦, 30◦, 20◦, 15◦, 10◦, 5◦, and 3◦. During daytime, one measurement cycle consisted of the sequential record of the scattered sunlight spec-trum at the seven elevation angles and took 10–15 min. For each specspec-trum, a constant signal level (i.e. 80 % of the saturation of the detector) was achieved by adjusting the
10
integration time. During night, the instrument was set to record dark current and offset spectra. A fully automated program (MiniMax, Udo Friess, University of Heidelberg) was employed for the MAX-DOAS measurements.
The differential slant column density (DSCD) is defined as the difference of the slant column density (SCD) betweenα6=90◦ andα=90◦(c.f. Wagner et al., 2011). DSCDs
15
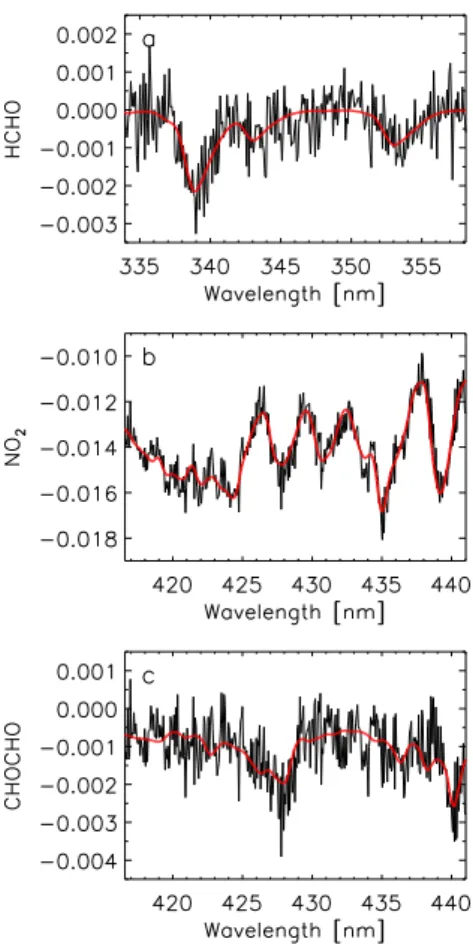
of NO2, HCHO, and CHOCHO were determined by DOAS fit in the wavelength range where they have prominent absorptions. Figure 1 illustrates an example of the DOAS fit for the spectrum recorded on 19 July 2006 at 10:59, at a solar zenith angle of 23◦ and an elevation angle of 3◦. For each measurement cycle, the corresponding zenith spectrum (α=90◦) was taken as Fraunhofer reference spectrum (FRS) for the off-axis
20
elevation angles (i.e.α6=90◦). This largely eliminates the stratospheric contributions to the DSCDs. The Ring spectrum was calculated from each measured spectrum (Busse-mer, 1993). For the fit of the absorbing trace gases, we used high resolution absorp-tion cross secabsorp-tions which were convolved with the instrument slit funcabsorp-tion to match the resolution of the instrument (except for O4 spectrum which was interpolated). These
25
ACPD
12, 3983–4029, 2012MAX-DOAS trace gases measurements
in China
X. Li et al.
Title Page
Abstract Introduction
Conclusions References
Tables Figures
◭ ◮
◭ ◮
Back Close
Full Screen / Esc
Printer-friendly Version Interactive Discussion
Discussion
P
a
per
|
Dis
cussion
P
a
per
|
Discussion
P
a
per
|
Discussio
n
P
a
per
|
solar I0-effect (Platt et al., 1997) was corrected for NO2 and O3 reference spectra with slant column density of 1.5×1017cm−2 and 1.5×1020cm−2, respectively. The wave-length calibration was performed by fitting the Fraunhofer reference spectra to a high resolution Fraunhofer spectrum (Kurucz et al., 1984), convoluted with the instrument’s slit function.
5
The conversion from measured DSCDs to tropospheric vertical column density (VCD) is usually done by the differential air mass factor (DAMF). The air mass fac-tor (AMF) can be regarded as the path enhancement of SCD compared to VCD. DAMF is defined as the the difference of air mass factor (AMF) betweenα6=90◦ andα=90◦. If the last scattering event of photons been registered by the MAX-DOAS telescope
10
happens above the trace gas layer, the AMF for the zenith and the off-axis view can be estimated as 1 and 1/sinα, respectively. Thus, the trace gas tropospheric VCD can be written as
VCDgeo=DSCDα DAMFα=
DSCDα
(1/sinα)−1 (1)
where α is the elevation angle of the telescope. This method is called “geometric
15
approach”. For photons received by the telescope at higher elevation angles, the prob-ability of their last scattering event occurring above the trace gas layer is increased. Thus we calculated VCDgeo for NO2, HCHO, and CHOCHO from the corresponding DSCDs at the highest off-zenith elevation angle, i.e.α=30◦.
Compared to the simple geometric approach, the radiative transfer transfer
mod-20
eling of DSCDs is a demanding task. In this study, the DSCDs calculations were performed by McArtim, which is a backward Monte-Carlo RTM with the treatment of multiple scattering in a fully spherical geometry (Deutschmann et al., 2011). For each trace gas (NO2, HCHO, and CHOCHO), its vertical distribution was retrieved by itera-tively adjusting the profile until the measured DSCDs best fit with the modeled DSCDs.
25
The parameter settings of McArtim are listed in Table 2. Following Li et al. (2010), we used a two-layer setup for the trace gas distribution in the troposphere (0–15 km height). The trace gas concentrations (unit: cm−3) were assumed to be homogeneous
ACPD
12, 3983–4029, 2012MAX-DOAS trace gases measurements
in China
X. Li et al.
Title Page
Abstract Introduction
Conclusions References
Tables Figures
◭ ◮
◭ ◮
Back Close
Full Screen / Esc
Printer-friendly Version Interactive Discussion
Discussion
P
a
per
|
Dis
cussion
P
a
per
|
Discussion
P
a
per
|
Discussio
n
P
a
per
|
in a layer near the ground surface (called mixed layer, ML), while the concentrations in the layer aloft (i.e. the free troposphere) decrease exponentially with height. This type of trace gas distribution was frequently observed in polluted regions (e.g., Fried et al., 2003; Junkermann, 2009; Klippel et al., 2011). The concentration profilec(z) can be described with a limited set of parameters
5
c(z)=
VCD·F/H z≤H
β·exp(−z/ξ) z > H (2)
wherez is the height above ground, VCD denotes the trace gas tropospheric vertical column density of the respective trace gas,F is the fraction of the VCDrtm residing in the ML, and H is the height of ML. β is the norm for exponential factor and ξ is the scaling height for the trace gas in the free troposphere. We performed test runs of the
10
retrieval and we found that the results were not sensitive toξ under these conditions encountered here since most of the trace gases were present in the mixed layer. Thus
ξ was set to a constant value of 5 km. The norm β is calculated from the integral of
c(z) over the entire troposphere VCD=R15 km
0 km c(z)d zleading to
β= (1−F)·VCD
ξ(exp(−H/ξ)−exp(−15 km/ξ)) (3)
15
With the input given above, the McArtim program calculates the set of trace gas DSCDs (Rα) at the six elevation angles of the measurements. In order to achieve the best estimates forF,H, VCDrtm (subscript rtm refers to the use of the RTM, in contrast to the geometric approach) we minimized
χ2(VCDrtm,F,H)=
30◦
X
α=3◦
M
α−Rα(VCDrtm,F,H)
σ(Mα)
2
(4)
20
ACPD
12, 3983–4029, 2012MAX-DOAS trace gases measurements
in China
X. Li et al.
Title Page
Abstract Introduction
Conclusions References
Tables Figures
◭ ◮
◭ ◮
Back Close
Full Screen / Esc
Printer-friendly Version Interactive Discussion
Discussion
P
a
per
|
Dis
cussion
P
a
per
|
Discussion
P
a
per
|
Discussio
n
P
a
per
|
retrieval was applied for measured DSCDs averaged over one hour. The minimization procedure was conducted automatically using an implementation of the Levenberg-Marquardt algorithm (mpfit1, realized in IDL).
Since the PRD region is characterized by wide spread emission sources, most of the trace gases reside in the ML and the trace gas concentrations in the ML are much
5
higher than those in the layer aloft. Therefore, the modeled DSCDs are not sensitive to change ofξ(see above), and values ofF are close to 1. The three parameter (VCDrtm,
F, and H) retrieval yielded F >0.95 for almost all cloud-free periods. In addition, the statistical error of the retrievedF was large associated with a cross-correlation between
F andH. IncreasingH or decreasingF have the same effect on the modeled DSCDs.
10
In order to overcome this issue, we finally fixed the values of F to 1; only VCD and
H were retrieved. This approach resulted in a “box shape” profile. The trace gas concentrations c0 are universal in the box and equal to VCDrtm/H. c0 can then be compared to ground-based measurements which were done at the BG site.
Figure 2 depicts the flow diagram of the trace gas vertical distribution retrieval
pro-15
cedure. In order to well simulate the aerosol scattering effects by RTM, aerosol vertical distributions were retrieved beforehand from O4 DSCDs in the way as described by Li et al. (2010). The derived aerosol extinction profiles were used as input to the trace gas vertical distribution retrieval. The retrieval of NO2 vertical distribution was performed as the second step. Using the results from the first two steps, HCHO and CHOCHO
20
vertical distributions were retrieved independently.
The errors of the retrieved trace gas vertical distribution consist of statistical errors which arise mainly from the uncertainty of the DSCDs, and systematic errors which originate from the uncertainty of the RTM input parameters and of the DSCD simu-lation. The statistical errors were derived from the mpfit procedure. Within RTM
in-25
tercomparison activities (Hendrick et al., 2006; Wagner et al., 2007) the uncertainty of DSCD calculations by McArtim were found to be less than 10 %. The sensitivities
1
C. B. Markwardt, mpfit – Robust non-linear least squares curve fitting, http://cow.physics. wisc.edu/∼craigm/idl/fitting.html.
ACPD
12, 3983–4029, 2012MAX-DOAS trace gases measurements
in China
X. Li et al.
Title Page
Abstract Introduction
Conclusions References
Tables Figures
◭ ◮
◭ ◮
Back Close
Full Screen / Esc
Printer-friendly Version Interactive Discussion
Discussion
P
a
per
|
Dis
cussion
P
a
per
|
Discussion
P
a
per
|
Discussio
n
P
a
per
|
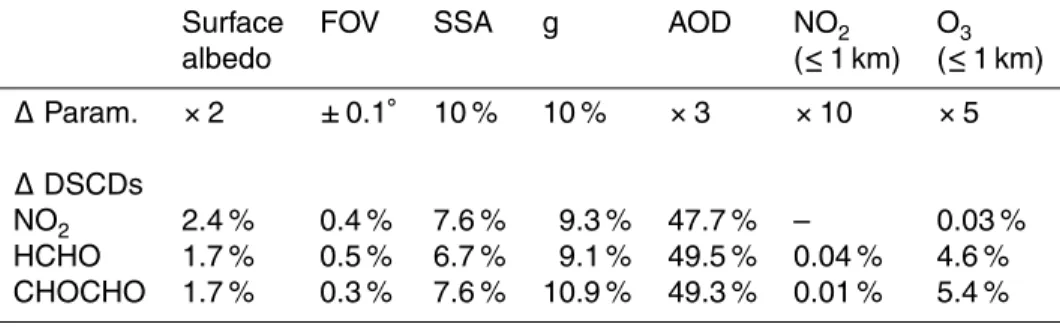
of the modeled DCSDs with respect to RTM input parameters are listed in Table 3. The surface albedo, the field of view of the telescope (FOV), and the surface O3 and NO2have minor influences on the modeled DSCDs. The major uncertainty sources to the modeled DSCDs are the aerosol properties, namely the single scattering albedo (SSA), the asymmetry factor (g, under the Henyey-Greenstein approximation), and the
5
aerosol optical depth (AOD). While the increase of SSA andg lead to a simultaneous increase of modeled DSCDs at all elevation angles, the increase of AOD results in a decrease of modeled DSCDs. It was found that 30 % change of modeled DSCDs results in ≈25 % change of the retrieved VCDrtm and c0. During the campaign, the systematic errors of the measured SSA and AOD were 10 % and 30 %, respectively,
10
and the uncertainty ofg was 10 % (Garland et al., 2008; Li et al., 2010). Therefore, we conclude that the total systematic error of the retrieved VCDrtmand c0 are around 35 %.
2.3 In-situ NO2measurement
In-situ NO2 concentrations were measured by a commercial instrument (Takegawa
15
et al., 2006). The inlet of the sampling line was located on top of the hotel building. NO2 in the sampled air was converted to NO in a photolytical reactor (Droplet Measurement Technologies, Model BLC) with an conversion efficiency of 30 %. The NO was then detected by NO-O3 chemiluminescence (Thermo Electron, Model 42CTL). The 1 min detection limit for NO2was 170 ppt, and the corresponding accuracy was 13 %.
20
2.4 Numerical simulation of NO2
Model3-CMAQ version 4.5.1 was employed to simulate the NO2concentrations during the period of the campaign. Details of the model configuration are described by Wang et al. (2010). The CMAQ model uses SAPRC99 as chemical mechanism, and is driven by MM5 for meteorology field and SMOKE for source emissions. The time step of
25
ACPD
12, 3983–4029, 2012MAX-DOAS trace gases measurements
in China
X. Li et al.
Title Page
Abstract Introduction
Conclusions References
Tables Figures
◭ ◮
◭ ◮
Back Close
Full Screen / Esc
Printer-friendly Version Interactive Discussion
Discussion
P
a
per
|
Dis
cussion
P
a
per
|
Discussion
P
a
per
|
Discussio
n
P
a
per
|
grid spacing of 36 km, 12 km, and 4 km. All grids have 13 layers vertically extending from the surface to an altitude of 17 km above the ground, with seven layers below 1 km and the first layer thickness of 18 m. While the TRACE-P anthropogenic emission inventory was used for the 36 km domain, the emission inventories used for the 12 km domain and the 4 km domain were updated according to recent studies in PRD region
5
(Zheng et al., 2009). Mobile sources and power generation point sources contribute about 47 % and 39 %, respectively, to the total NOX emissions in PRD while mobile sources, evaporation losses of solvents and petroleum, and biogenic sources are the three largest contributors to VOC emissions, accounting for 38 %, 24 %, and 23 %, respectively. Spatially, both NOX and VOC emissions are concentrated over the inland
10
urban areas of Guangzhou, Foshan, and Dongguan; the coastal areas of Dongguan and Shenzhen; and the urban core of Hong Kong.
3 Results
The MAX-DOAS instrument was operated for the campaign period from 3 July to 25 July 2006. However, as already discussed by Li et al. (2010), only 9 virtually
cloud-15
free days were suitable for aerosol and trace gas vertical distribution retrieval. Mea-sured DSCDs of NO2, HCHO, and CHOCHO in these 9 days are displayed in Fig. S1 in the Supplement.
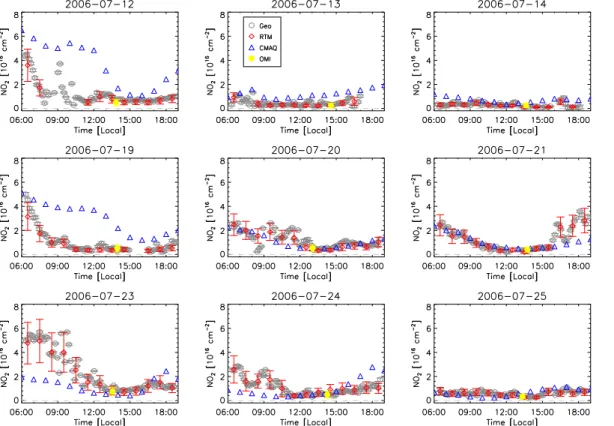
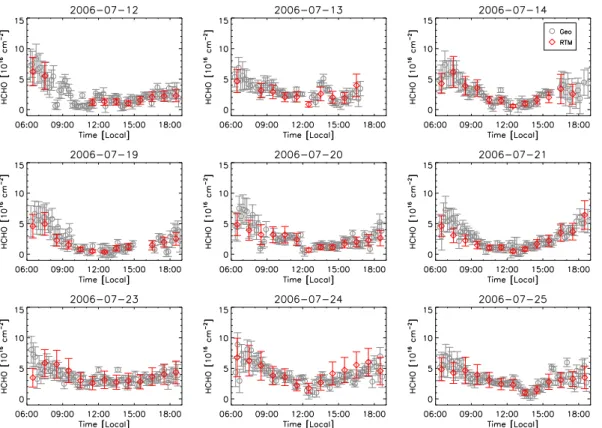
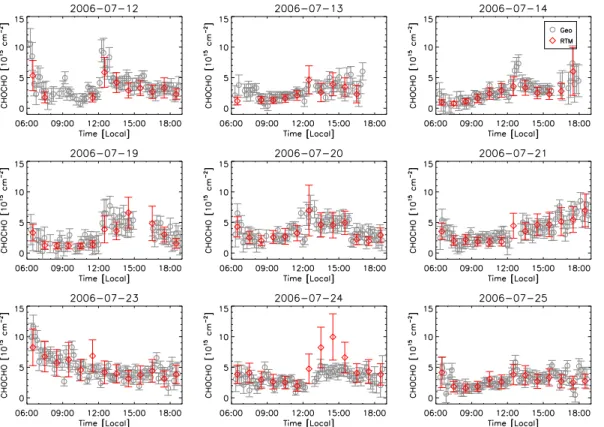
The vertical column densities using the RTM retrieval (VCDrtm) of NO2, HCHO, and CHOCHO are shown in Figs. 3–5. The mean values of VCDrtmwere 1.0×1016cm−2,
20
2.9×1016cm−2, and 3.5×1015cm−2 for NO2, HCHO, and CHOCHO, respectively. VCDrtm of NO2 and HCHO showed the same diurnal variation pattern; higher values were usually observed around early morning before 09:00 LT (local time, LT=UTC+8 h) and late afternoon (after 17:00 LT). Besides 23 July, peak values of CHOCHO VCDrtm occurred in the afternoon (12:00–15:00 LT). Considering the
mea-25
surement and retrieval errors, VCDs calculated by the geometric approach (VCDgeo) are nearly identical with the VCDrtm. For the whole data set (N=109), the slopes B0
ACPD
12, 3983–4029, 2012MAX-DOAS trace gases measurements
in China
X. Li et al.
Title Page
Abstract Introduction
Conclusions References
Tables Figures
◭ ◮
◭ ◮
Back Close
Full Screen / Esc
Printer-friendly Version Interactive Discussion
Discussion
P
a
per
|
Dis
cussion
P
a
per
|
Discussion
P
a
per
|
Discussio
n
P
a
per
|
of a linear regression forced trough the origin (VCDgeo versus VCDrtm) are 1.06±0.14 (R2=0.97) for NO2, 1.05±0.07 (R2=0.80) for HCHO, and 1.00±0.07 (R2=0.60) for CHOCHO, respectively (Figs. S2–S4).
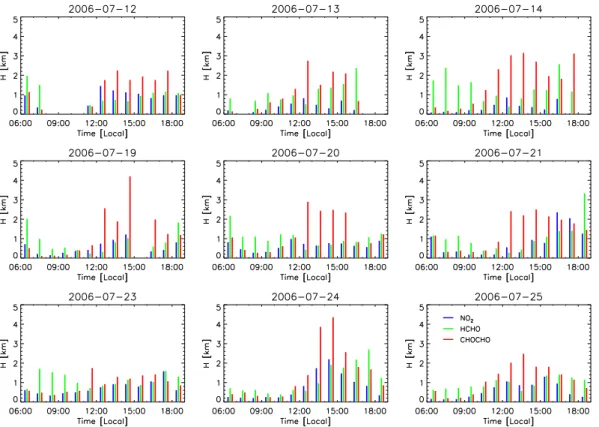
The retrieved mixed layer heights H of the three trace gases are shown in Fig. 6.
HNO2, HHCHO, and HCHOCHO are not always the same. In early morning hours, when
5
HNO2 and HCHOCHO were below 200 m, HHCHO was in the range of 300 m to 1 km.
HCHOCHO increased dramatically during the day and reached peak values of 2–4 km in the afternoon. The maxima ofHNO2 coincided with that ofHCHOCHO, however, the maximum values ofHNO2 were only 1–2 km. Compared toHNO2 andHCHOCHO, the
di-urnal variation ofHHCHO was less prominent. In some days (e.g. 24 July), peak values
10
ofHHCHOaround 2 km can be clearly identified in the afternoon. In the other days (e.g. 20 July),HHCHO kept stable at 1 km with variation of±200 m.
The trace gas mixing ratios (in ppb) at ground level can be calculated as m0= VCD/H×M0withM0being the conversion factor from cm−3to ppb. Figure 7 shows the time series of the derived NO2, HCHO, and CHOCHO mixing ratios. The average
day-15
time mixing ratios of NO2, HCHO, and CHOCHO were 9.5 ppb, 11.8 ppb, and 1.6 ppb, respectively. During the days 23 July–25 July when intense biomass and electric cable burning events occurred in the previous night in the surrounding areas, high levels of HCHO (≈40 ppb) and CHOCHO (≈6 ppb) were found in the early morning hours. In the same time periods, NO2 mixing ratios up to 45 ppb were observed by both
MAX-20
DOAS and in-situ techniques and the mixing ratios of NO2, HCHO, and CHOCHO show similar diurnal pattern having their maxima in the early morning hours. With the increase of solar radiation, mixed layer height, and OH concentration, all mixing ra-tios started to decrease after 09:00 LT and became stable in the afternoon. A slight increase ofm0 can be found before sunset. While the mixing ratio of NO2and HCHO
25
ACPD
12, 3983–4029, 2012MAX-DOAS trace gases measurements
in China
X. Li et al.
Title Page
Abstract Introduction
Conclusions References
Tables Figures
◭ ◮
◭ ◮
Back Close
Full Screen / Esc
Printer-friendly Version Interactive Discussion
Discussion
P
a
per
|
Dis
cussion
P
a
per
|
Discussion
P
a
per
|
Discussio
n
P
a
per
|
4 Discussion
4.1 NO2
The good agreement between NO2VCDrtmand NO2VCDgeo(Figs. 3 and S1) indicates that the geometric approach is well suited for estimating the tropospheric NO2 VCDs at the BG site, even given the high aerosol loads during the campaign (Garland et al.,
5
2008; Li et al., 2010). Similar results were found by Wagner et al. (2011) in the Po Valley area, i.e. differences between NO2 VCDgeo and VCDrtm were within 12 %. However, different to Wagner et al. (2011), we did not observe a dependence of the relative difference between VCDrtm and VCDgeo (∆VCD=(VCDrtm−VCDgeo)/VCDrtm) on the mixed layer height (HNO
2) at the BG site;∆VCD andHNO2 are uncorrelated (R
2
=0.02).
10
Since the differences between VCDgeoand VCDrtmare rather small and in the order of the measurement and data retrieval uncertainties, no correlation between∆VCD and other measured parameters can be expected.
Simultaneous in-situ NO2 measurements can be used to validate the NO2 mixing ratios derived from the MAX-DOAS observations. The scatter plot of NO2mixing ratios
15
derived from MAX-DOAS vs. in-situ chemiluminescence data (Fig. 10) provides a high degree of correlation,R2=0.81 for a data set ofN=107 simultaneous measurements. However, at this high degree of correlation, the slopeB0, forced through the origin, is 1.35±0.21. Considering the errors in both coordinates, the goodness-of-fit parameter
Q(cf. Press et al., 2007) equals 0.9 indicating that the scatter of the data points around
20
the regression line can be explained by the measurement errors of both techniques. Here we included the fit error (usually small) and the errors of the SSA,g, and AOD, since these can vary with the different conditions during the campaign.
However, the 35 % difference between MAX-DOAS and the in-situ technique is slightly larger than the obtained by Pikelnaya et al. (2007); Irie et al. (2008); Wagner
25
et al. (2011) where differences of 30 % or less were observed. Firstly, we investigated if the 35 % difference can be attributed to the inhomogeneous distribution of NO2along
ACPD
12, 3983–4029, 2012MAX-DOAS trace gases measurements
in China
X. Li et al.
Title Page
Abstract Introduction
Conclusions References
Tables Figures
◭ ◮
◭ ◮
Back Close
Full Screen / Esc
Printer-friendly Version Interactive Discussion
Discussion
P
a
per
|
Dis
cussion
P
a
per
|
Discussion
P
a
per
|
Discussio
n
P
a
per
|
the lines of the previous studies. During the campaign, the NOX emission usually oc-curred in the second half of the night or in the early morning. However, the relative difference of NO2mixing ratios between the two techniques (i.e.∆VCD) correlates nei-ther with the time of the day (R2=0.01), nor with the NO2 layer height (R2=0), nor the wind speed (R2=0.03), suggesting the emission or transport effects, which can
5
result in the imhomogenity of NO2distribution, have minor influence on the intercom-parison results in this study. Secondly, we investigated if the higher NO2mixing ratios observed by MAX-DOAS can be attributed to the uncertainty of parameters used in the RTM calculation. As discussed in Sect. 2.2, the aerosol properties, namely SSA,
g, and AOD, are the major contributors to the systematic error of the MAX-DOAS NO2
10
retrieval. In the RTM calculation, SSA was fixed to the measured average value 0.85 and we assumed g to be constant at 0.68. However, due to the change of aerosol compositions and size distributions, the values of SSA andgchange. Using the RTM we performed a number of sensitivity studies showing that an increase of SSA andg
lead to higher values of modeled NO2DSCDs and higher retrieved NO2mixing ratios.
15
Although the AOD and the aerosol vertical distribution used in the RTM calculation were derived from the MAX-DOAS observations, they are sensititve to the values of SSA andg(Li et al., 2010). During the campaign, the uncertainty of SSA,g, and AOD were 10 %, 10 %, and 30 %, respectively, which can lead to an uncertainty of ≈25 % for the retrieved NO2 mixing ratios. In addition, the uncertainty of the RTM DSCDs
20
simulation contributes another 10 % systematic error and the accuracy of the in-situ NO2 measurements was 13 %. Therefore, the 35 % difference between the NO2 mix-ing ratios observed by MAX-DOAS and by the in-situ technique are within the range provided by the systematic errors and the error of the slope. The difference observed here is substantially lower than in the studies by Celarier et al. (2008) and Chen et al.
25
(2009) who did not use the locally measured aerosol and NO2profiles.
ACPD
12, 3983–4029, 2012MAX-DOAS trace gases measurements
in China
X. Li et al.
Title Page
Abstract Introduction
Conclusions References
Tables Figures
◭ ◮
◭ ◮
Back Close
Full Screen / Esc
Printer-friendly Version Interactive Discussion
Discussion
P
a
per
|
Dis
cussion
P
a
per
|
Discussion
P
a
per
|
Discussio
n
P
a
per
|
one looking up to the sky, the other looking down to the earth). Here, we compared the tropospheric NO2VCDs measured by MAX-DOAS and by OMI (Ozone Monitoring Instrument on board NASA’s EOS-Aura satellite) for the BG site during the PRIDE-PRD2006 campaign. The OMI tropospheric vertical column densities of NO2(VCDomi) were downloaded from http://www.temis.nl (DOMINO Version 2.0). The DOMINO
prod-5
ucts also include information on cloud fraction (CF). Details on the NO2VCDomiand CF retrieval are described by Boersma et al. (2007) with recent updates in the DOMINO Product Specification Document (http://www.temis.nl/docs/OMI NO2 HE5 1.0.2.pdf). The uncertainties of NO2 VCDomi and CF are≈30 % and<5 %, respectively, accord-ing to Boersma et al. (2007). Figure S5 shows the time series of NO2VCDgeo, VCDrtm,
10
and VCDomi during the entire campaign period. Given the ground pixel size of the OMI observation (≥340 km2) and the satellite overpass time (≈14:00 LT) the cloud-free days discriminated from our sky-webcam images are only a subset of those by the OMI cloud fraction (i.e. CF≤0.5). The relationship between MAX-DOAS and OMI measured tropospheric NO2 VCDs is shown in Fig. 9. The NO2VCDomi were
signifi-15
cantly lower than NO2VCDgeowhen CF>0.5, which can be expected since OMI only detects the NO2absorption above the cloud. When taking all measurement days into account, we found poor correlation (R2=0.20) of VCDomi against VCDgeo (Fig. 9a). This is mainly caused by the large discrepancy between VCDomiand VCDgeoin cloudy days. When we restrict to observations during the virtually cloud-free days, VCDomi
20
were found to agree better with VCDgeo (R2=0.63; B0=0.91±0.20). Though similar regression slope (B0=0.97±0.24) is obtained when compare VCDomi to VCDrtm, R2
of 0.49 suggests a weaker relationship between VCDomi and VCDrtm (Fig. 9b). The majority of previous studies demonstrated that the tropospheric NO2VCDs measured by OMI were between 10 % and 50% lower than those measured by ground-based
25
instruments, like MAX-DOAS and direct sun measurements (Brinksma et al., 2008; Celarier et al., 2008; Irie et al., 2008; Boersma et al., 2009). In contrast, Halla et al. (2011) observed at a rural site in Southwestern Ontario, that the NO2 VCDs mea-sured by OMI can be 50 % higher than those derived from MAX-DOAS measurements.
ACPD
12, 3983–4029, 2012MAX-DOAS trace gases measurements
in China
X. Li et al.
Title Page
Abstract Introduction
Conclusions References
Tables Figures
◭ ◮
◭ ◮
Back Close
Full Screen / Esc
Printer-friendly Version Interactive Discussion
Discussion
P
a
per
|
Dis
cussion
P
a
per
|
Discussion
P
a
per
|
Discussio
n
P
a
per
|
Both, the overestimation and the underestimation were mainly attributed to the inho-mogeneous distribution of NO2especially for measurements in or near source regions, since OMI observations effectively average the NO2concentrations over its field of view (≥340 km2) while the ground-based instruments at a single spot. Therefore, we con-clude that the tropospheric NO2VCDs measured by OMI are in good agreement with
5
those by MAX-DOAS at the BG site during the cloud-free days of the PRIDE-PRD2006 campaign.
The NO2 simulations of the CMAQ model were also compared to MAX-DOAS and in-situ measurement at the BG site during the cloud-free days. As shown in Figs. 3 and 8, the modeled NO2 concentrations follow the observations, but on average they
10
are about 40 % higher than the observed values. The linear regression of VCDcmaq vs. VCDrtmyielded a slopeB0=1.39±0.17 while the surface layer NO2concentrations of the CMAQ model and the insitu instrument gaveB0=1.38±0.18. However, in the morning of 23 July and 24 July, the CMAQ modeled NO2 VCDs and surface layer concentrations are only 20–40 % of the measured values. This was caused by local
15
emission events (i.e. biomass and electric cable burning) which are not included in the source inventory of the CMAQ model. The occurrence of the local emission events were identified by measurements of aerosol optical properties and OH reactivities at the BG site, as described by Garland et al. (2008) and Lou et al. (2010), respectively. After excluding the data in these periods, the modeled NO2concentrations exceed the
20
measured values by 75 % on average. In the CMAQ model, the simulated NO2levels are mainly determined by the dilution effects and the NOX emissions. The dilution effects are related with the wind speed and the vertical mixing. In the morning of 12 July and 19 July, when the modeled wind speeds were quite small and much lower than the local observations (Fig. S6), the accumulation of trace gases in the model
25
ACPD
12, 3983–4029, 2012MAX-DOAS trace gases measurements
in China
X. Li et al.
Title Page
Abstract Introduction
Conclusions References
Tables Figures
◭ ◮
◭ ◮
Back Close
Full Screen / Esc
Printer-friendly Version Interactive Discussion
Discussion
P
a
per
|
Dis
cussion
P
a
per
|
Discussion
P
a
per
|
Discussio
n
P
a
per
|
still≈55 % higher than the measurement results.
When strong vertical mixing occurs, NO2 emitted or produced near the ground can be effectively transported to higher altitudes. The strength of the vertical mixing is reflected by the mixed layer height of NO2 (HNO2). Figure 8 shows the time series of the NO2 concentrations modeled by CMAQ in different height ranges. In the early
5
morning (before 07:00 LT) and late afternoon (after 17:00 LT), the modeled NO2 con-centrations in the surface layer (cNO2
0→18m) were usually 5 times higher than those in the layer of 0–1 km (cNO2
0→1 km), indicating that most of the NO2was concentrated in a shallow
layer above the ground andHNO2 being less than 1 km. After 08:00 LT, the differences
between cNO2
0→18 m, c NO2
0→1 km, and c NO2
0→3 km became smaller, and c NO2
0→1 km nearly equals
10
cNO2
0→18 m. suggesting an increase of HNO2 to more than 1 km. The HNO2 estimated from the modeled NO2 distributions were almost the same as those derived from the MAX-DOAS observations (cf.HNO2 in Fig. 6). Since the CMAQ model can reproduce the observedHNO2, it is unlikely that the vertical mixing of NO2 in the model was un-derestimated. Given the discussion above, we conclude that the dilution effects can
15
not explain the higher modeled NO2concentrations than the measurements. In order to obtain better agreement between the modeled and measured NO2 concentrations reduced NOX emissions in the source inventory of the CMAQ model seem to be nec-essary.
4.2 HCHO and CHOCHO
20
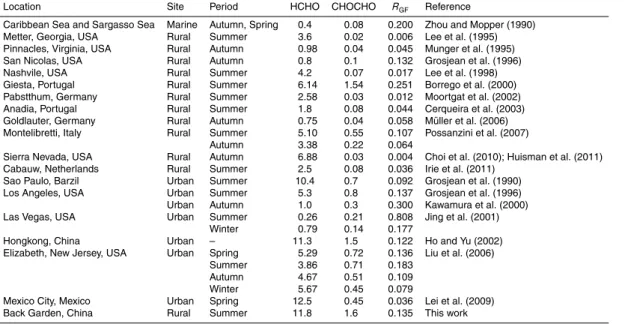
The HCHO and CHOCHO concentrations observed in this work are among the high-est ever reported (Table 4), which is consistent with PRD was identified by satellite measurements as one of the hot spot regions of HCHO and CHOCHO (De Smedt et al., 2008; Myriokefalitakis et al., 2008; Vrekoussis et al., 2009). Given HCHO and CHOCHO are mostly produced through the oxidation of different VOCs, their observed
25
high concentrations indicate high levels of the precursor VOCs and the enormous HOX turnover in the atmosphere of PRD region, which have also been demonstrated by Lou
ACPD
12, 3983–4029, 2012MAX-DOAS trace gases measurements
in China
X. Li et al.
Title Page
Abstract Introduction
Conclusions References
Tables Figures
◭ ◮
◭ ◮
Back Close
Full Screen / Esc
Printer-friendly Version Interactive Discussion
Discussion
P
a
per
|
Dis
cussion
P
a
per
|
Discussion
P
a
per
|
Discussio
n
P
a
per
|
et al. (2010) and Lu et al. (2011). HCHO and CHOCHO at the BG site showed diff er-ent diurnal variation than the observations in other places in the world (e.g., Munger et al., 1995; Lei et al., 2009), i.e. the maximum mixing ratios always occurred in early morning hours (Fig. 7) instead of around noon. The early occurrence of HCHO and CHOCHO peaks can be attributed to the oxidation of VOCs by OH radicals in the
pre-5
vious night. During the campaign, nighttime OH concentrations were constantly higher than zero and had an average of ≈1×106cm−3 (Lu et al., 2011), while the average OH reactivities were 30–50 s−1at night. Therefore, nighttime production of HCHO and CHOCHO are possible under these conditions and in the absence of photolysis, HCHO and CHOCHO can easily accumulate. After sunrise, due to the increase of photolysis
10
frequencies and the mixed layer height, HCHO and CHOCHO mixing ratios started to decrease and became stable in the afternoon.
The mixed layer heights of CHOCHO (HCHOCHO) are higher than those of NO2 and HCHO especially in the afternoon (Fig. 6). During the campaign, the lifetimes of NO2, HCHO, and CHOCHO around noon due to reaction with OH and photolysis were
calcu-15
lated to be≈2 min,≈1.4 h, and≈1.2 h, respectively, based on the observed OH con-centration of≈1.4×107cm−3and the measured photolysis frequency of≈7×10⁻³s−1 for NO2,≈6×10⁻⁵s−1 for HCHO and≈9×10⁻⁵s−1 for CHOCHO. Due to the short lifetime of NO2, lowerHNO2 thanHCHOCHO can be expected. Even though the lifetime of CHOCHO and HCHO were comparable, they are produced in different generations
20
of the VOCs oxidation which can result in different vertical distribution of CHOCHO and HCHO. Imagine an airmass containing primary VOCs being transported from the emission sources to the receptor site. As a first or second generation product, HCHO is produced before CHOCHO which is usually produced from the second or third gen-eration daughter products of primary VOCs. Thus, with the aging of the airmass the
25
ACPD
12, 3983–4029, 2012MAX-DOAS trace gases measurements
in China
X. Li et al.
Title Page
Abstract Introduction
Conclusions References
Tables Figures
◭ ◮
◭ ◮
Back Close
Full Screen / Esc
Printer-friendly Version Interactive Discussion
Discussion
P
a
per
|
Dis
cussion
P
a
per
|
Discussion
P
a
per
|
Discussio
n
P
a
per
|
Both species, CHOCHO and HCHO, are mainly produced through hydrocarbon ox-idation. The ratio of CHOCHO to HCHO (RGF) was used in a number of studies to identify the sources of VOCs since CHOCHO and HCHO have different precursors or different formation pathways (e.g., Vrekoussis et al., 2010). Figure 11 shows the diurnal variation of the CHOCHO to HCHO ratio (RGF) in the 9 cloud-free days. AlthoughRGF
5
calculated from the mixing ratio near the ground surface (RGF,m0) have similar average value as that from VCDrtm(RGF,m0=0.135±0.069,RGF,rtm=0.177±0.183), they show different diurnal variations. While RGF,m0 is nearly constant over the day, values of
RGF,rtmaround noon were higher than that in the morning and late afternoon. This dif-ference is caused by the different variation between the CHOCHO mixing ratio (i.e.m0)
10
compared to the CHOCHO vertical column densities (i.e. VCDrtm) (Figs. 5 and 7). Since HCHO and CHOCHO VCDs derived from the geometric approach (VCDgeo) agree with their VCDrtm(Figs. S3 and S4), good agreement between RGF,geo (i.e.RGF calculated from VCDgeo) andRGF,rtmcan be expected (B0=1.02±0.12,R2=0.69).
Values of RGF depend on many factors including primary emissions, compositions
15
and concentrations of precursor VOCs, OH levels, etc.RGFhigher than 0.5 were found by Schauer et al. (2001) in biomass burning emissions, whilstRGF were in the range of 0.02–0.09 in vehicle exhausts (Schauer et al., 1999, 2002). Since different types of VOCs (i.e. alkane, alkene, aromatic, oxygenated VOCs) have different yields of HCHO and CHOCHO, values ofRGF can be different when the VOCs compositions change.
20
Moreover, given CHOCHO is usually the higher generation oxidation product of pri-mary VOCs, in the condition of higher HOX turnover rates, more CHOCHO can be produced leading to higherRGF. Table 4 listsRGFobtained in different environments in the world. In general, RGF in rural areas are below 0.1, whilst values higher than 0.1 exist in urban areas. Besides the lower concentrations of ambient VOCs, most rural
25
areas are strongly influenced by biogenic VOC emissions, e.g. isoprene, terpenes, and 2-methyl-3-butene-2-ol (MBO) (Lee et al., 1995; Munger et al., 1995; Huisman et al., 2011). Compared to anthropogenic VOCs (e.g. aromatics), the CHOCHO yield from isoprene or terpenes oxidations are much lower (Fu et al., 2008). Therefore, though
ACPD
12, 3983–4029, 2012MAX-DOAS trace gases measurements
in China
X. Li et al.
Title Page
Abstract Introduction
Conclusions References
Tables Figures
◭ ◮
◭ ◮
Back Close
Full Screen / Esc
Printer-friendly Version Interactive Discussion
Discussion
P
a
per
|
Dis
cussion
P
a
per
|
Discussion
P
a
per
|
Discussio
n
P
a
per
|
Giesta, Portugal is geologically defined as rural site, the strong influence of anthro-pogenic emissions from industries in surrounding areas cause high levels of HCHO, CHOCHO, andRGF. On other hand, in urban areas like Sao Paulo, Brazil and Mexico City, Mexico, when primary emission (e.g. traffic) accounts for a large fraction of ambi-ent HCHO but barely contributes to CHOCHO (Grosjean et al., 1990; Lei et al., 2009),
5
the prevailing anthropogenic sources can cause a decrease ofRGF. It was also found that, for the same measurement site (i.e. Montelibretti, Italy, Las Vegas, USA, and Eliz-abeth, USA),RGF obtained in summer are higher than in other seasons (Jing et al., 2001; Liu et al., 2006; Possanzini et al., 2007). This is because summer time is usually accompanied by high solar radiation, temperature, and humidity, which are in favor of
10
the photochemical reactions producing HCHO, CHOCHO, and other secondary prod-ucts. RGF obtained at the BG site are higher than the values in most rural areas but comparable with those in urban conditions. As described by Lu et al. (2011), during the PRIDE-PRD2006 campaign, the detected air masses were mixtures of anthropogenic and biogenic emissions. Additionally, the observed high OH andkOHlevel indicate the
15
fast ongoing photochemistry which has rarely been reported for other places in the world. However, in the relationship betweenRGFand other measured parameters (e.g. NOX, O3, VOCs, OH, kOH, OH×kOH), no correlations were found. This is probably due toRGFis determined by the combination of several factors (e.g. the concentration and composition of precursors, the OH level, the photolysis frequencies, etc), which is
20
difficult to be reflected by a single parameter.
The spatial distribution of RGF and its implication on VOC source types have been investigated by Vrekoussis et al. (2010) using satellite measurements. Their observed
RGFof≈0.04 for Southern Asia is much lower than the values obtained at the BG site. This difference can be explained by the different spatial resolution between the
satel-25
lite and local measurements. Vrekoussis et al. (2010) suggest thatRGF in the range
ACPD
12, 3983–4029, 2012MAX-DOAS trace gases measurements
in China
X. Li et al.
Title Page
Abstract Introduction
Conclusions References
Tables Figures
◭ ◮
◭ ◮
Back Close
Full Screen / Esc
Printer-friendly Version Interactive Discussion
Discussion
P
a
per
|
Dis
cussion
P
a
per
|
Discussion
P
a
per
|
Discussio
n
P
a
per
|
the observations for rural areas. The major argument ofRGF<0.04 representing re-gions influenced by anthropogenic emissions is, the primary HCHO from anthropogenic sources can cause a decrease ofRGF (Vrekoussis et al., 2010). As discussed above, this is indeed the case for Mexico City, Mexico, but might not always be true for areas where the primary HCHO concentration is low but anthropogenic VOCs (e.g.
aromat-5
ics) are at high level. According to Table 4, RGF in urban areas are in general higher than 0.04 by a factor of 2. To solve the difference between the conclusion of Vrekoussis et al. (2010) and this study, more simultaneous HCHO and CHOCHO measurements at different locations and seasons are needed. Furthermore, it is necessary to apply the photochemical modeling of HCHO and CHOCHO in terms of VOC compositions.
10
5 Summary and conclusion
During the PRIDE-PRD2006 campaign in Southern China in July 2006, we performed MAX-DOAS measurements for NO2, HCHO, and CHOCHO at a rural site 60 km NW of downtown Guangzhou. Under the assumption of a “box profile” setup for the three trace gases, their tropospheric vertical column densities, mixing layer heights, and
15
mixing ratios at the ground have been retrieved by an automated algorithm.
– The simple geometric approach is able to provide good estimates of the NO2 tropospheric VCDs even under the relatively high aerosol loads encountered here.
– A comparison of OMI tropospheric NO2VCDs with our ground-based MAX-DOAS measurements showed a good agreement when the cloud fraction was below 0.5.
20
– A comparison to the 3-D chemical transport model CMAQ showed a high degree of correlation for NO2 VCDs and NO2ground level concentrations but the model overestimates the measured values indicating a need for a reduction of the NOX emission strength in the source inventory.
ACPD
12, 3983–4029, 2012MAX-DOAS trace gases measurements
in China
X. Li et al.
Title Page
Abstract Introduction
Conclusions References
Tables Figures
◭ ◮
◭ ◮
Back Close
Full Screen / Esc
Printer-friendly Version Interactive Discussion
Discussion
P
a
per
|
Dis
cussion
P
a
per
|
Discussion
P
a
per
|
Discussio
n
P
a
per
|
– The HCHO and CHOCHO concentrations and their ratiosRGFwere much higher
than expected from previous studies. This can be attributed to the high photo-chemical turnover in the PRD region.
– Different from satellite observations, our ground-based measurements indicate thatRGFare lower than 0.1 in rural areas but increase with higher anthropogenic
5
emissions.
Based on these findings, simultaneous measurements of HCHO and CHOCHO and their precursors as well as photochemical modeling are necessary in order to obtain a clearer picture on the influence of anthropogenic and biogenic emissions onRGF. We also showed in this case study for NO2that MAX-DOAS can serve as an excellent tool
10
for 3-d CTM evaluation and for satellite validation even under specific conditions here. The automated MAX-DOAS retrieval of VCDs and mixed layer heights are a first step towards using MAX-DOAS product for data assimilation forecast models.
Supplementary material related to this article is available online at: http://www.atmos-chem-phys-discuss.net/12/3983/2012/
15
acpd-12-3983-2012-supplement.pdf.
Acknowledgements. The authors like to thank Roman Sinreich, Udo Frieß, and Ulrich Platt (Heidelberg) for the lending of the Mini-MAX DOAS instrument, the MiniMax software, and fruitful discussions. The technical help and support at the field site from the PRIDE-PRD2006 campaign team, especially Rolf H ¨aseler (J ¨ulich), Min Hu, Limin Zeng, and Yuanhang Zhang
20
(Beijing) are gratefully acknowledged. We thank all participants of the distributed computing of the RTM. We acknowledge the free use of tropospheric NO2 column data from the OMI
sensor from www.temis.nl. This work was supported by the China National Basic Research and Development Program 2002CB410801, and the National High Technology Research and Development Program of China (863 Program) 2006AA06A301.
ACPD
12, 3983–4029, 2012MAX-DOAS trace gases measurements
in China
X. Li et al.
Title Page
Abstract Introduction
Conclusions References
Tables Figures
◭ ◮
◭ ◮
Back Close
Full Screen / Esc
Printer-friendly Version Interactive Discussion
Discussion
P
a
per
|
Dis
cussion
P
a
per
|
Discussion
P
a
per
|
Discussio
n
P
a
per
|
References
Bobrowski, N., Honninger, G., Galle, B., and Platt, U.: Detection of bromine monoxide in a vol-canic plume, Nature, 423, 273–276, doi:10.1038/nature01625, 2003. 4015
Boersma, K. F., Eskes, H. J., Veefkind, J. P., Brinksma, E. J., van der A, R. J., Sneep, M., van den Oord, G. H. J., Levelt, P. F., Stammes, P., Gleason, J. F., and Bucsela, E. J.:
5
Near-real time retrieval of tropospheric NO2from OMI, Atmos. Chem. Phys., 7, 2103–2118,
doi:10.5194/acp-7-2103-2007, 2007. 3997
Boersma, K. F., Jacob, D. J., Trainic, M., Rudich, Y., DeSmedt, I., Dirksen, R., and Eskes, H. J.: Validation of urban NO2 concentrations and their diurnal and seasonal variations observed
from the SCIAMACHY and OMI sensors using in situ surface measurements in Israeli cities,
10
Atmos. Chem. Phys., 9, 3867–3879, doi:10.5194/acp-9-3867-2009, 2009. 3985, 3997 Borrego, C., Gomes, P., Barros, N., and Miranda, A. I.: Importance of handling
or-ganic atmospheric pollutants for assessing air quality, J. Chromatogr. A, 889, 271–279, doi:10.1016/S0021-9673(00)00230-2, 2000. 4018
Brinksma, E. J., Pinardi, G., Volten, H., Braak, R., Richter, A., Sch ¨ohardt, A., van Roozendael,
15
M., Fayt, C., Hermans, C., Dirksen, R. J., Vlemmix, T., Berkhout, A. J. C., Swart, D. P. J., Oet-jen, H., Wittrock, F., Wagner, T., Ibrahim, O. W., de Leeuw, G., Moerman, M., Curier, R. L., Celarier, E. A., Cede, A., Knap, W. H., Veefkind, J. P., Eskes, H. J., Allaart, M., Rothe, R., Piters, A. J. M., and Levelt, P. F.: The 2005 and 2006 DANDELIONS NO2and aerosol
inter-comparison campaigns, J. Geophys. Res., 113, D16S46, doi:10.1029/2007JD008808, 2008.
20
3985, 3997
Bussemer, M.: Der Ring-Effekt: Ursachen und Einfluß auf die spektroskopische Messung stratosph ¨aischer Spurenstoffe, Diploma thesis, Universit ¨at Heidelberg, Heidelberg, Ger-many, 1993. 3988
Celarier, E. A., Brinksma, E. J., Gleason, J. F., Veefkind, J. P., Cede, A., Herman, J. R., Ionov, D.,
25
Goutail, F., Pommereau, J.-P., Lambert, J.-C., van Roozendael, M., Pinardi, G., Wittrock, F., Sch ¨onhardt, A., Richter, A., Ibrahim, O. W., Wagner, T., Bojkov, B., Mount, G., Spinei, E., Chen, C. M., Pongetti, T. J., Sander, S. P., Bucsela, E. J., Wenig, M. O., Swart, D. P. J., Volten, H., Kroon, M., and Levelt, P. F.: Validation of Ozone Monitoring Instrument nitrogen dioxide columns, J. Geophys. Res., 113, D15S15, doi:10.1029/2007JD008908, 2008. 3996,
30
3997
Cerqueira, M. A., Pio, C. A., Gomes, P. A., Matos, J. S., and Nunes, T. V.: Volatile organic
ACPD
12, 3983–4029, 2012MAX-DOAS trace gases measurements
in China
X. Li et al.
Title Page
Abstract Introduction
Conclusions References
Tables Figures
◭ ◮
◭ ◮
Back Close
Full Screen / Esc
Printer-friendly Version Interactive Discussion
Discussion
P
a
per
|
Dis
cussion
P
a
per
|
Discussion
P
a
per
|
Discussio
n
P
a
per
|
compounds in rural atmospheres of Central Portugal, Sci. Total Environ., 313, 49–60, doi:10.1016/S0048-9697(03)00250-X, 2003. 4018
Chen, D., Zhou, B., Beirle, S., Chen, L. M., and Wagner, T.: Tropospheric NO2column densities
deduced from zenith-sky DOAS measurements in Shanghai, China, and their application to satellite validation, Atmos. Chem. Phys., 9, 3641–3662, doi:10.5194/acp-9-3641-2009, 2009.
5
3996
Choi, W., Faloona, I. C., Bouvier-Brown, N. C., McKay, M., Goldstein, A. H., Mao, J., Brune, W. H., LaFranchi, B. W., Cohen, R. C., Wolfe, G. M., Thornton, J. A., Sonnen-froh, D. M., and Millet, D. B.: Observations of elevated formaldehyde over a forest canopy suggest missing sources from rapid oxidation of arboreal hydrocarbons, Atmos. Chem.
10
Phys., 10, 8761–8781, doi:10.5194/acp-10-8761-2010, 2010. 4018
De Smedt, I., M ¨uller, J.-F., Stavrakou, T., van der A, R., Eskes, H., and Van Roozendael, M.: Twelve years of global observations of formaldehyde in the troposphere using GOME and SCIAMACHY sensors, Atmos. Chem. Phys., 8, 4947–4963, doi:10.5194/acp-8-4947-2008, 2008. 3999
15
Deutschmann, T., Beirle, S., Frieß, U., Grzegorski, M., Kern, C., Kritten, L., Platt, U., Prados-Rom ´an, C., Pukite, J., Wagner, T., Werner, B., and Pfeilsticker, K.: The Monte Carlo atmo-spheric radiative transfer model McArtim: introduction and validation of Jacobians and 3D features, J. Quant. Spectrosc. Ra., 112, 1119–1137, doi:10.1016/j.jqsrt.2010.12.009, 2011. 3989
20
Fan, S. J., Fan, Q., Yu, W., Luo, X. Y., Wang, B. M., Song, L. L., and Leong, K. L.: Atmospheric boundary layer characteristics over the Pearl River Delta, China, during the summer of 2006: measurement and model results, Atmos. Chem. Phys., 11, 6297–6310, doi:10.5194/acp-11-6297-2011, 2011. 3987
Fried, A., Crawford, J., Olson, J., Walega, J., Potter, W., Wert, B., Jordan, C., Anderson, B.,
25
Shetter, R., Lefer, B., Blake, D., Blake, N., Meinardi, S., Heikes, B., O’Sullivan, D., Snow, J., Fuelberg, H., Kiley, C. M., Sandholm, S., Tan, D., Sachse, G., Singh, H., Faloona, I., Har-ward, C. N., and Carmichael, G. R.: Airborne tunable diode laser measurements of formalde-hyde during TRACE-P: distributions and box model comparisons, J. Geophys. Res., 108, 8798, doi:10.1029/2003jd003451, 2003. 3990
30
ACPD
12, 3983–4029, 2012MAX-DOAS trace gases measurements
in China
X. Li et al.
Title Page
Abstract Introduction
Conclusions References
Tables Figures
◭ ◮
◭ ◮
Back Close
Full Screen / Esc
Printer-friendly Version Interactive Discussion
Discussion
P
a
per
|
Dis
cussion
P
a
per
|
Discussion
P
a
per
|
Discussio
n
P
a
per
|
Garland, R. M., Yang, H., Schmid, O., Rose, D., Nowak, A., Achtert, P., Wiedensohler, A., Takegawa, N., Kita, K., Miyazaki, Y., Kondo, Y., Hu, M., Shao, M., Zeng, L. M., Zhang, Y. H., Andreae, M. O., and P ¨oschl, U.: Aerosol optical properties in a rural environment near the mega-city Guangzhou, China: implications for regional air pollution, radiative forcing and remote sensing, Atmos. Chem. Phys., 8, 5161–5186, doi:10.5194/acp-8-5161-2008, 2008.
5
3987, 3992, 3995, 3998
Greenblatt, G. D., Orlando, J. J., Burkholder, J. B., and Ravishankara, A. R.: Absorption measurements of oxygen between 330 and 1140 nm, J. Geophys. Res., 95, 18577–18582, doi:10.1029/JD095iD11p18577, 1990. 3988
Grosjean, D., Miguel, A. H., and Tavares, T. M.: Urban air pollution in Brazil: acetaldehyde and
10
other carbonyls, Atmos. Environ. B-Urb., 24, 101–106, doi:10.1016/0957-1272(90)90015-M, 1990. 4002, 4018
Grosjean, E., Grosjean, D., Fraser, M. P., and Cass, G. R.: Air quality model evaluation data for organics. 2. C1-C14carbonyls in Los Angeles air, Environ. Sci. Technol., 30, 2687,
doi:10.1021/es950758w, 1996. 4018
15
Halla, J. D., Wagner, T., Beirle, S., Brook, J. R., Hayden, K. L., O’Brien, J. M., Ng, A., Majonis, D., Wenig, M. O., and McLaren, R.: Determination of tropospheric vertical columns of NO2and
aerosol optical properties in a rural setting using MAX-DOAS, Atmos. Chem. Phys., 11, 12475–12498, doi:10.5194/acp-11-12475-2011, 2011. 3997
Heckel, A., Richter, A., Tarsu, T., Wittrock, F., Hak, C., Pundt, I., Junkermann, W., and
Bur-20
rows, J. P.: MAX-DOAS measurements of formaldehyde in the Po-Valley, Atmos. Chem. Phys., 5, 909–918, doi:10.5194/acp-5-909-2005, 2005. 4015
Hendrick, F., Van Roozendael, M., Kylling, A., Petritoli, A., Rozanov, A., Sanghavi, S., Schofield, R., von Friedeburg, C., Wagner, T., Wittrock, F., Fonteyn, D., and De Mazi `ere, M.: Intercomparison exercise between different radiative transfer models used for the
interpreta-25
tion of ground-based zenith-sky and multi-axis DOAS observations, Atmos. Chem. Phys., 6, 93–108, doi:10.5194/acp-6-93-2006, 2006. 3991
Ho, S. S. H. and Yu, J. Z.: Feasibility of collection and analysis of airborne carbonyls by on-sorbent derivatization and thermal desorption, Anal. Chem., 74, 1232–1240, doi:10.1021/ac015708q, 2002. 4018
30
Hofzumahaus, A., Rohrer, F., Lu, K., Bohn, B., Brauers, T., Chang, C.-C., Fuchs, H., Hol-land, F., Kita, K., Kondo, Y., Li, X., Lou, S., Shao, M., Zeng, L., Wahner, A., and Zhang, Y.: Amplified trace gas removal in the troposphere, Science, 324, 1702–1704,