Fabrício Mezzomo Collares Fernando Freitas Portella Vicente Castelo Branco Leitune Susana Maria Werner Samuel
DentalMaterials Laboratory, School of Dentistry, Universidade Federal do Rio Grande do Sul - UFRGS, Porto Alegre, RS, Brazil.
Corresponding Author: Fabrício Mezzomo Collares E-mail: [email protected]
Discrepancies in degree of conversion
measurements by FTIR
Abstract: The purpose of this study was to evaluate the inluence of the internal standard peak on the measured degree of conversion (DC) for methacrylate-based resins analyzed by Fourier-transform infrared spectroscopy (FTIR). The inluence of different baseline measurement methods was also determined. Different blends were prepared,
mix-ing BisGMA/BisEMA and BisGMA/TEGDMA at proportions of 0%
to 100%, in weight. Camphoroquinone and
ethyl-4-dimethylamino-benzoate were used to permit the light activation of blends. Degree of conversion was evaluated using FTIR equipped with an attenuated total relectance (ATR) device. Samples were dispensed onto ATR crystal and light activated for 40 s. The DC was calculated by relating the height of the peak 1637 cm−1 to the intensity of different internal standard
peaks (1715, 1608, or 1582 cm−1), measured using two different
base-line methods, before and after polymerization. Data were compared by
ANOVA at 5% signiicance. The relationship between DC and
mono-mer ratio was obtained by regression analysis. Double-bond conversion
ranged from 32.75% to 78.50% for BisGMA/BisEMA blends, and from
32.75% to 76.22% for BisGMA/TEGDMA blends. For the BisGMA/
BisEMA blends, the DC showed a linear association with the composi-tion of the comonomer blends, independent of the internal standard peak and baseline method used. In contrast, the trends in DC for BisGMA/ TEGDMA blends were different for each method of measurement. The internal standard peaks and measurement baseline should be taken into account when using FTIR to calculate the DC of methacrylate-based res-ins, especially comonomer blends containing a high degree of monomers that lack aromatic rings.
Descriptors: Polymerization; Bisphenol A-Glycidyl Methacrylate; Dental Materials.
Introduction
The degree of conversion (DC) of polymerizable resins has been widely
investigated in the dental literature.1-5 A high degree of double-bond
con-version of methacrylate-based resins yields favorable mechanical prop-erties6,7 and reduced degradation of the polymer.6 Despite the high DC
achieved in dental resins, complete conversion of aliphatic carbon-carbon double bonds is typically not achieved. The unconverted double bonds re-maining in the resin arise from at least two situations, namely, unreacted monomers or pendant double bonds at the extremities of polymer chains.
Declaration of Interests: The authors certify that they have no commercial or associative interest that represents a conflict of interest in connection with the manuscript.
Submitted: May 02, 2013
Accepted for publication: Aug 12, 2013 Last revision: Aug 27, 2013
Unreacted monomers in the polymer network may
irritate surrounding tissues.8-10 Furthermore, low DC
may render the polymer more prone to oxidation
and hydrolytic degradation over time,6 decreasing
the success of restorative procedures.
One of the most common methods to determine the extent of double-bond conversion is
Fourier-transform infrared spectroscopy (FTIR),2,11 which
can detect the stretching vibrations of
carbon-car-bon double carbon-car-bonds involved in polymerization.11 The
method typically utilizes the height ratio of the peaks
corresponding to aliphatic (1640 cm−1) and
aromat-ic (1610 cm−1) double bonds2 to determine the DC.
However, not all dental methacrylate-based polymers contain aromatic rings. Moreover, currently available dental polymer blends present different monomer compositions compared to each other (i.e., BisGMA,
TEGDMA, BisEMA and UDMA) and ratios.12-15
Be-cause FTIR measurements of DC use the aromatic carbon-carbon double bond peak as internal stan-dard, variations in comonomer blend composition and ratio can inluence the results. FTIR spectra of methacrylate-based dental materials also present other peaks related to carbon bond stretching, at 1715 and 1580 cm−1. Therefore, it is of great
inter-est to invinter-estigate whether these peaks may be used as internal standards in FTIR to determine the DC.
The purpose of this study was to evaluate the in-luence of the internal standard peak on the mea-sured degree of conversion (DC) for methacrylate-based resins analyzed by FTIR. Two statistical null hypotheses were tested:
1. that modifying the internal standards does not inluence the DC of comonomer blends, and
2. that the baseline used to measure the peak height
does not inluence the DC results.
Methodology
MaterialsBisphenol-A glycol dimethacrylate (BisGMA) was blended with monomers of either ethoxylated bisphenol-A glycol dimethacrylate 6 (BisEMA) or triethylene glycol dimethacrylate (TEGDMA). Con-centrations of BisEMA and TEGDMA in BisGMA were varied from 0% to 100% by weight. To each
sample was added 1% mol of camphoroquinone, as
a photosensitizer, and 1% mol of
ethyl-4-dimethyl-amino-benzoate, as a reducing agent. All reagents were obtained from Esstech Inc., Essington, USA.
Degree of conversion analysis
The DC was evaluated by FTIR (Vertex 70, Bruk-er Optics, Ettlingen, GBruk-ermany). The spectrometBruk-er was coupled to a horizontal attenuated total relec-tance (ATR) device consisting of a diamond crystal of 2 mm in diameter (Platinum ATR-QL, Bruker Optics, Ettlingen, Germany). A mid-infrared detec-tor (MIR ATR A225 Diamont, Bruker Optics, Et-tlingen, Germany) was used to capture the relected IR. A support device was used to afix the light-cur-ing unit at a distance of 5 mm from the sample. A drop of each sample (n = 3), more than 1 mm thick and suficiently wide to cover the entire surface of the diamond crystal, was directly dispensed onto the ATR crystal and photoactivated for 40 s by a light-emitting diode (Radii, SDI, Bayswater, Austra-lia). The irradiance value was 1200 mW/cm², con-irmed with a digital power meter (Ophir Optron-ics, North Andover, USA). Sixteen co-addition scans
were made at 10 kHz velocity and 4 cm−1 resolution,
with an instrument aperture of 6 mm. Absorbance spectra were obtained before and immediately after light polymerization using Opus software (Opus 6.5, Bruker Optics, Ettlingen, Germany), with Blackman-Harris 3-Term apodization over the range of 4000 to
400 cm−1. Spectra were transferred to IrfanView 4.25
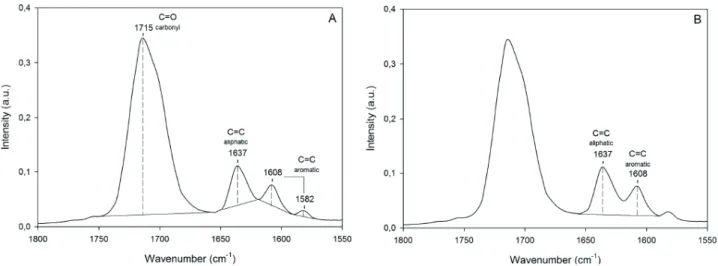
software (Irfan Skiljan, Wiener Neustadt, Austria), and different baselines were traced onto them, ac-cording to Figure 1. The peak height was measured from the top of the peak to the baseline.
The DC for each blend, polymerized and unpo-lymerized, was determined by the ratio of the ab-sorbance peak corresponding to the aliphatic
car-bon-carbon double bond (1637 cm−1 peak height)
with that of the internal standard (1715, 1608, and 1582 cm−1 peak height), according to methods
de-scribed in a previous study.11
Statistical analysis
dard peak was performed according to two
dif-ferent baseline tracing methods (1608 cm−1a and
1608 cm−1b). Double-bond conversion ranged from
32.75% to 78.50% for BisGMA/BisEMA blends,
and from 32.75% to 76.22% for
BisGMA/TEGD-MA blends. Use of 1608 cm−1a as an internal
stan-dard yielded the highest reported values of DC for almost all analyses.
BisGMA/BisEMA blends
Trends in DC for BisGMA/BisEMA blends were and comonomer blend ratio or internal standard was
analyzed by linear regression, yielding a correlation of determination (R²). All analyses were conducted at a statistical signiicance level of 5%.
Results
Tables 1 and 2 show the DC of the polymer blends, measured by different methods. The base-line tracing (Figure 1) inluenced the reported DC, as illustrated in Figures 1A and 1B, where the
height measurement of the 1608 cm−1 internal
stan-Figure 1 - Schematic representation of the baseline methods proposed to determine the ratios of the absorbance peaks cor-responding to aliphatic (1637 cm−1), aromatic (1608 and 1582 cm−1) or carbonyl (1715 cm−1) bonds. The peak heights were measured in relation to the baseline, determined as follows. (A) Baseline was traced by connecting the troughs of each peak. (B) Baseline was obtained by connecting the 1637 cm−1 initial trough and the 1608 cm−1 final trough.
BisGMA/ BisEMA ratio
Internal standard
1715 cm−1 1608 cm−1a 1608 cm−1b 1582 cm−1
0/100 68.68 (1.43) b 77.88 (1.24) a 71.31 (0.93) b 78.50 (1.98) a
10/90 68.76 (0.82) b 78.07 (0.78) a 67.35 (0.86) b 78.03 (1.24) a
20/80 61.46 (1.59) c 72.28 (1.31) a 65.89 (0.83) bc 70.06 (3.25) ab
30/70 53.85 (2.10) c 66.41 (1.87) a 59.75 (2.39) bc 62.97 (3.03) ab
40/60 54.53 (1.06) c 65.83 (0.40) a 59.09 (1.42) b 63.56 (1.84) a
50/50 51.08 (1.15) c 62.21 (0.73) a 56.50 (0.82) b 60.34 (2.56) ab
60/40 49.88 (0.83) c 61.01 (0.06) a 54.61 (0.45) b 60.63 (0.57) a
70/30 45.28 (2.36) b 54.45 (2.09) a 46.59 (1.50) b 55.89 (2.93) a
80/20 43.29 (0.13) c 53.79 (0.27) a 48.29 (2.30) b 53.70 (1.49) a
90/10 34.14 (1.46) b 43.91 (2.02) a 41.37 (0.26) a 40.67 (3.07) a
100/0 32.75 (1.58) b 40.02 (2.32) a 33.99 (3.26) ab 38.14 (3.49) ab
Means followed by distinct letters in the same line are significantly different (p < 0.05).
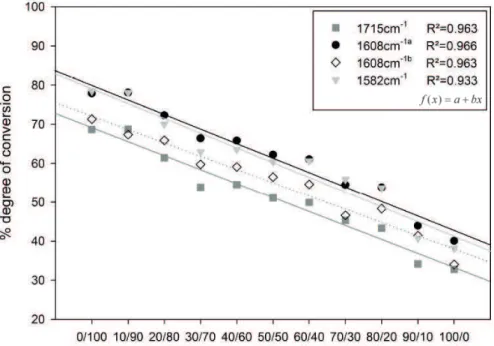
adequately itted by linear regression (R² > 0.9; p < 0.001). Increasing the BisGMA/BisEMA ratio decreased the DC (Figure 2). Regardless of the inter-nal standard peak or measurement baseline, the DC showed a strong association with the composition of the comonomer blend.
BisGMA/TEGDMA blends
BisGMA/TEGDMA blends could not be
char-acterized by linear regression, with the exception of
the experiment using the 1608 cm−1a standard peak
and baseline method (R² = 0.803; p < 0.001). This set of experiments was better it by Gaussian 3-param-eter regression (p1715 cm−1 < 0.001; p1608 cm−1b = 0.004;
p1582 cm−1 = 0.041). Increasing the ratio of BisGMA/
TEGDMA to 50/50 promoted an increase in DC. At BisGMA/TEGDMA ratios greater than 50/50, a de-crease in DC was observed (Figure 3).
Table 2 - Mean (standard deviation) DC (%) for BisGMA/ TEGDMA blends, measured using
different internal standard peaks.
Figure 2 - Linear regression analysis to obtain the relationship between DC and proportions of BisGMA/BisEMA blends.
BisGMA/ TEGDMA ratio
Internal standard
1715 cm−1 1608 cm−1a 1608 cm−1b 1582 cm−1
0/100 38.83 (4.62) a * 40.19 (6.68) a *
10/90 50.43 (0.66) b 76.22 (2.31) a 50.96 (0.33) b *
20/80 53.12 (0.66) b 73.63 (1.52) a 53.68 (0.48) b 55.44 (14.01) ab
30/70 53.63 (0.95) b 70.12 (1.73) a 56.40 (0.67) b 58.63 (4.70) b
40/60 54.92 (1.22) b 70.93 (0.91) a 58.83 (0.57) b 65.92 (3.86) a
50/50 55.52 (0.72) c 68.31 (1.08) a 59.98 (0.47) b 67.99 (0.28) a
60/40 49.03 (0.69) d 64.00 (0.57) a 55.43 (0.61) c 59.94 (2.32) b
70/30 49.01 (0.95) d 64.02 (1.78) a 52.94 (0.96) c 57.80 (1.91) b
80/20 42.55 (1.63) c 55.35 (1.23) a 48.63 (1.06) b 48.03 (0.97) b
90/10 49.82 (3.36) b 60.48 (2.31) a 55.07 (3.24) ab 60.13 (2.16) a
100/0 32.75 (1.58) b 40.02 (2.32) a 33.99 (3.26) ab 38.14 (3.49) ab
Discussion
This study aimed to evaluate how the measure-ment of DC via FTIR is inluenced by the internal standard peak and baseline method. Comonomer blends with or without aromatic rings were test-ed. The DC of the comonomer blends varied from
32.75% to 78.50% as function of monomer
compo-sition and ratio. These results indicate that, contrary to our two null hypotheses, the internal standard and the baseline do, in some cases, affect measure-ments of DC.
The DC of BisGMA/BisEMA blends varied from
32.75% to 78.50%, presenting an indirect linear
re-lationship to BisGMA concentration for all internal standards. The decrease in DC at larger BisGMA/ BisEMA ratios can be attributed to differences in viscosity. Increasing the content of BisGMA can de-crease the mobility of monomers into the polymer-izing bulk.16 The results for these samples indicate
that the blends composed of monomers with aro-matic rings used in this study were not inluenced by differences in the internal standard peak or baseline method.
The DC of BisGMA/TEGDMA blends ranged
from 32.75% to 76.22%, presenting an indirect
lin-ear relationship to BisGMA concentration only for
the 1608 cm−1a internal standard. Trends in DC for
BisGMA/TEGDMA blends differed when the
in-ternal standard peak was varied from 1715 cm−1 to
1608 cm−1b and 1582 cm−1. In general, the DC
exhib-ited an initial increase as the BisGMA content was
increased to 50 wt%, followed by a decrease as the
BisGMA content was increased further. The results for BisGMA/TEGDMA show that the internal stan-dards and baseline do inluence the measured DC of comonomer blends containing monomers without aromatic rings (i.e., TEGDMA).
Our results are in accordance with those of a previous study that showed an increase in DC upon decreasing the BisGMA content in a
BisGMA/TEG-DMA blend.17 Thus, despite the large number of
studies that determine DC via FTIR with the
aro-matic carbon-carbon peak (1608 cm−1) as the
inter-nal standard, caution must be taken when using this method to ind the DC of blends that contain mono-mers without aromatic rings. In the FTIR spectra of resins comprising a high content of monomers without aromatic carbon-carbon double bonds, the peaks at 1608 and 1582 cm−1 have low or
nonex-istent intensity, decreasing the reliability and repro-ducibility of DC measurements on these samples. However, most commercial methacrylate-based
dental materials do comprise monomers with aro-matic rings; such monomers produce a stiff central core in the inal polymer, increasing its mechanical strength.
Ideally, the DC of TEGDMA-rich blends
(con-taining > 80% TEGDMA by weight) should be
de-termined by other internal standard peaks besides 1608 cm−1 due to the low intensity of this peak in
the FTIR spectrum of such blends. For these blends, the 1715 cm−1 peak, corresponding to the carbonyl
C=O bond, showed reliable results. The lower DC
values measured using the 1715 cm−1 internal
stan-dard in comparison to the 1608 cm−1a standard can
be explained by the cyclization that occurs during TEGDMA polymerization. The TEGDMA molecule has a short and lexible chain that permits a meth-acrylate radical from one extremity to react with the methacrylate of another extremity, reducing the chain mobility and hindering the copolymerization of TEGDMA with BisGMA. This reaction forms an
inhomogeneous polymer that presents a low DC.18
Unexpectedly, the 1608 cm−1b internal standard
yielded reasonable results for the DC of pure TEG-DMA. This result should be viewed with caution, because this peak, theoretically, should not be pres-ent on the TEGDMA IR spectrum.
In general, for both blend compositions, the measured DC values followed the following order: 1608 cm−1a > 1582 cm−1 > 1608 cm−1b > 1715 cm−1.
Using the 1608 cm−1 peak as internal standard, and
determining its height by baseline method “a”, ap-pears to be the best way to evaluate DC, yielding results that are comparable to those of other stud-ies.19,20 Previous studies showed a direct linear
pro-portional relationship between TEGDMA
concen-tration and DC in dimethacrylate blends.21
Conclusion
The internal standard peak and baseline mea-surement affect the measured DC of methacrylate-based resins and its relationship to the comonomer blend composition, as determined by FTIR spectros-copy. The best internal standard for DC measure-ment is the 1608 cm−1 peak, whose height is
mea-sured by baseline method “a”, for the comonomer blends that were used in this study.
Acknowledgments
Fernando Freitas Portela gratefully
acknowled-ges scholarship support from CAPES (Coordenação
de Aperfeiçoamento de Pessoal de Nível Superior).
References
1. Porto IC, Soares LE, Martin AA, Cavalli V, Liporoni PC. Influence of the photoinitiator system and light photoactiva-tion units on the degree of conversion of dental composites. Braz Oral Res. 2010 Oct-Dec;24(4):475-81.
2. Collares FM, Ogliari FA, Zanchi CH, Petzhold CL, Piva E, Samuel SM. Influence of 2-hydroxyethyl methacrylate concen-tration on polymer network of adhesive resin. J Adhes Dent. 2011 Apr;13(2):125-9.
3. Zhang Y, Wang Y. Distinct photopolymerization efficacy on dentin of self-etch adhesives. J Dent Res. 2012 Aug;91(8):795-9.
4. Wu N, Zhang Y, Wang Y. Photo-polymerization efficiency of self-etch dental adhesives composed of camphorquinone or trimethylbenzoyl-diphenyl-phosphine oxide. Int J Adhes Adhes. 2013 Sep;45:53-8.
5. Marovic D, Panduric V, Tarle Z, Ristic M, Sariri K, Demoli N, et al. Degree of conversion and microhardness of dental com-posite resin materials. J Mol Struct. 2013 Jul;1044(24):299-302.
6. Ferracane JL. Hygroscopic and hydrolytic effects in dental polymer networks. Dent Mater. 2006 Mar;22(3):211-22. 7. Palin WM, Fleming GJ, Burke FJ, Marquis PM, Randall RC.
Monomer conversion versus flexure strength of a novel dental composite. J Dent. 2003 Jul;31(5):341-51.
8. Durner J, Obermaier J, Draenert M, Ilie N. Correlation of the degree of conversion with the amount of elutable sub-stances in nano-hybrid dental composites. Dent Mater. 2012 Nov;28(11):1146-53.
9. Mantellini MG, Botero TM, Yaman P, Dennison JB, Hanks CT, Nor JE. Adhesive resin induces apoptosis and cell-cycle arrest of pulp cells. J Dent Res. 2003 Aug;82(8):592-6. 10. Pashley DH, Zhang Y, Agee KA, Rouse CJ, Carvalho RM,
Russell CM. Permeability of demineralized dentin to HEMA. Dent Mater. 2000 Jan;16(1):7-14.
12. Jia W, Jin S, inventors; Pentron Clinical Technologies, LLC., assignee. Dental resin materials, method of manufacture, and uses thereof. United States patent US 6,787,629 B2. 2004 Sep 7.
13. Salz U, Zimmermann J, Poppe D, Rheinberger V, Tiller J, Was-chinski C, inventors; Ivoclar Vivadent AG, assignee. Dental materials based on radically polymerizable macromers with antimicrobial effect. United States patent US 7,553,881 B2. 2009 Jun 30.
14. Rao PS, Aasen SM, Abuelyaman AS, Mitra SB, Craig BD, Shukla BA, Plaut DJ, Russel VA, inventors; 3M Innovative Properties Company, assignee. Adhesive composition for hard tissue. United States patent US 8,076,389 B2. 2011 Dec 13. 15. Jin X, inventor; Dentsply International Inc., assignee. Method
and antibacterial/antimicrobial compositions in dental com-positions. United States patent US 2012/0328553 A1. 2012 Dec 27.
16. Andrzejewska E. Photopolymerization kinetics of multifunc-tional monomers. Prog Polym Sci. 2001 May;26(4):605-65.
17. Lovell LG, Newman SM, Bowman CN. The effects of light intensity, temperature, and comonomer composition on the polymerization behavior of dimethacrylate dental resins. J Dent Res. 1999 Aug;78(8):1469-76.
18. Elliott JE, Lovell LG, Bowman CN. Primary cyclization in the polymerization of bis-GMA and TEGDMA: a modeling approach to understanding the cure of dental resins. Dent Mater. 2001 May;17(3):221-9.
19. Amirouche-Korichi A, Mouzali M, Watts DC. Effects of monomer ratios and highly radiopaque fillers on degree of conversion and shrinkage-strain of dental resin composites. Dent Mater. 2009 Nov;25(11):1411-8.
20. Goncalves F, Azevedo CL, Ferracane JL, Braga RR. BisGMA/ TEGDMA ratio and filler content effects on shrinkage stress. Dent Mater. 2011 Jun;27(6):520-6.