AMTD
5, 7025–7065, 2012LT ozone from IASI-NG
P. Sellitto et al.
Title Page
Abstract Introduction
Conclusions References
Tables Figures
◭ ◮
◭ ◮
Back Close
Full Screen / Esc
Printer-friendly Version Interactive Discussion
Discussion
P
a
per
|
Dis
cussion
P
a
per
|
Discussion
P
a
per
|
Discussio
n
P
a
per
|
Atmos. Meas. Tech. Discuss., 5, 7025–7065, 2012 www.atmos-meas-tech-discuss.net/5/7025/2012/ doi:10.5194/amtd-5-7025-2012
© Author(s) 2012. CC Attribution 3.0 License.
Atmospheric Measurement Techniques Discussions
This discussion paper is/has been under review for the journal Atmospheric Measurement Techniques (AMT). Please refer to the corresponding final paper in AMT if available.
Potential of the future thermal infrared
space-borne sensor IASI-NG to monitor
lower tropospheric ozone
P. Sellitto1, G. Dufour1, M. Eremenko1, J. Cuesta1, P. Dauphin1, G. For ˆet1, B. Gaubert1, M. Beekmann1, V.-H. Peuch2, and J.-M. Flaud1
1
Laboratoire Inter-universitaire des Syst `emes Atmosph ´eriques (LISA), UMR7583, CNRS – Universit ´es Paris-Est Cr ´eteil et Paris Diderot, CNRS, Rue du G ´en ´eral de Gaulle,
94010 Cr ´eteil, France
2
European Centre for Medium-Range Weather Forecasts (ECMWF), Research Department,Shinfield Park, Reading, Berkshire, RG2 9AX, UK
Received: 28 July 2012 – Accepted: 11 September 2012 – Published: 21 September 2012 Correspondence to: P. Sellitto (pasquale.sellitto@lisa.u-pec.fr)
AMTD
5, 7025–7065, 2012LT ozone from IASI-NG
P. Sellitto et al.
Title Page
Abstract Introduction
Conclusions References
Tables Figures
◭ ◮
◭ ◮
Back Close
Full Screen / Esc
Printer-friendly Version Interactive Discussion
Discussion
P
a
per
|
Dis
cussion
P
a
per
|
Discussion
P
a
per
|
Discussio
n
P
a
per
|
Abstract
The lower tropospheric (LT) ozone concentration is a key factor for air quality (AQ).
Observing efficiently LT ozone from space is crucial to monitor and better understand
pollution phenomena occurring from inter-continental to local scales, and that have
a proven noxious effect on the human health and the biosphere. The Infrared
Atmo-5
spheric Sounder Interferometer (IASI) flies on MetOp-A spacecraft and is planned to be launched in the next future as part of the other MetOp modules, i.e. MetOp-B and C. IASI has demonstrated to have the capability to single out the LT ozone signal only at favourable conditions, i.e. in presence of high thermal contrast scenarios. New gener-ation satellite instruments are being designed to address several pressing geophysical
10
issues, including a better observation capability of LT ozone. IASI-NG (New Genera-tion), now having reached the accomplishment of design phase-A for launch in the 2020 timeframe as part of the EPS-SG (EUMETSAT Polar System-Second Generation, for-merly post-EPS) mission, may render feasible a better observation of AQ in terms of LT ozone. To evaluate the added-value brought by IASI-NG in this context, we developed
15
a pseudo-observation simulator, including a direct simulator of thermal infrared spectra and a full inversion scheme to retrieve ozone concentration profiles. We produced one month (August 2009) of tropospheric ozone pseudo-observations based on both IASI and IASI-NG instrumental configurations. We compared the pseudo-observations and we found a clear improvement of LT ozone (up to 6 km altitude) pseudo-observations
20
quality for IASI-NG. The estimated total error is expected to be more than 35 % smaller at 5 km, and 20 % smaller for the LT ozone column. The total error on the LT ozone col-umn is, on average, lower than 10 % for IASI-NG. IASI-NG is expected to have a signif-icantly better vertical sensitivity (monthly average degrees of freedom surface-6 km of 0.70) and to be sensitive at lower altitudes (more than 0.5 km lower than IASI, reaching
25
values of nearly 3.0 km). Vertical ozone layers of 4 to 5 km thickness are expected to be resolved by IASI-NG, while IASI has a vertical resolution of 6–8 km. According to
AMTD
5, 7025–7065, 2012LT ozone from IASI-NG
P. Sellitto et al.
Title Page
Abstract Introduction
Conclusions References
Tables Figures
◭ ◮
◭ ◮
Back Close
Full Screen / Esc
Printer-friendly Version Interactive Discussion
Discussion
P
a
per
|
Dis
cussion
P
a
per
|
Discussion
P
a
per
|
Discussio
n
P
a
per
|
from upper tropospheric ozone information even for low sensitivity scenarios. In addi-tion, IASI-NG is expected to be able to better monitor LT ozone patterns at local spatial scale and to monitor abrupt temporal evolutions occurring at time-scales of a few days, thus bringing an expected added-value with respect to IASI for the monitoring of AQ.
1 Introduction
5
Air quality (AQ) pertains to the characterization of the atmospheric composition at the lowest altitude levels, in terms of both trace gases concentrations and aerosol burden and composition. It is increasingly evident how pollution in the lower troposphere (LT) and a poor AQ have an onerous impact on human health and environment, and then on society. An average reduction of up to several months in life expectation in European
10
urban areas has been hypothesized (Amann et al., 2005). One of the most important parameters to characterize AQ is the ozone concentration in the LT (WMO, 2002). Tro-pospheric ozone is a secondary air pollutant and also acts as a greenhouse gas (third in importance, Shindell et al., 2009). Ozone levels in the troposphere are mainly de-termined by two distinct phenomena: stratosphere/troposphere exchanges (STE) and
15
photochemical production partially linked to human emitted primary pollutants (WMO, 2002). In last decades, this latter source of tropospheric ozone has started to be con-sidered as more important than STE (WMO, 2002), rising the interest to the human impact on AQ (Crutzen and Stoermer, 2000). Some recent studies have shown that the ozone levels in troposphere may have been increased of up to the 50 % by human
20
activity from pre-industrial age, and present projections on future emission rates may lead to a further increase of 40 % (for the worst case scenario) by 2100, the largest increase occurring at northern mid- to high-latitudes (Horowitz, 2006). In spite of the clear reduction of ozone precursors concentrations (Monks et al., 2009) over the US and Europe, mean ozone concentrations in the troposphere, and even at the surface,
25
AMTD
5, 7025–7065, 2012LT ozone from IASI-NG
P. Sellitto et al.
Title Page
Abstract Introduction
Conclusions References
Tables Figures
◭ ◮
◭ ◮
Back Close
Full Screen / Esc
Printer-friendly Version Interactive Discussion
Discussion
P
a
per
|
Dis
cussion
P
a
per
|
Discussion
P
a
per
|
Discussio
n
P
a
per
|
significant enhancements of ozone concentrations at surface and in the LT, are likely to become more and more frequent (Sch ¨ar and Jendritzky, 2004; Vautard et al., 2005; Ran et al., 2009). In addition, the lifetime of ozone precursors and ozone itself can be very variable (from days to months). Ozone concentrations in the LT, correspond-ingly, can be very variable both in time and in space. In this complex framework it is
5
very important to monitor the levels and evolution of LT ozone at those various space-time scales. Indeed, both local production of ozone (Ran et al., 2009) and transport at small to continental (and sometimes intercontinental) scales (Lin et al., 2012) concur to determine local LT ozone levels.
Monitoring AQ from space is a topical task in modern geosciences, see, e.g. the
10
review done by Martin (2008). In the last few years, the use of satellites for the ob-servation of relevant AQ parameters, like LT ozone concentration or other trace gases associated to air pollution, has undergone significant advances with new and excit-ing perspectives in atmospheric pollution monitorexcit-ing. Satellite instruments flyexcit-ing in low Earth orbit (LEO) and observing the Earth with a nadir geometry have proved to be
15
able to retrieve the tropospheric ozone information, both exploiting the ultraviolet (UV) backscattered spectra, (e.g. Ziemke et al., 2003; Schoeberl et al., 2007; Liu et al., 2010), the synergy ultraviolet/visible (UV/VIS) (Sellitto et al., 2012a,b), and the ther-mal infrared (TIR) emitted spectra (e.g. Eremenko et al., 2008; Worden et al., 2007a). Some simulation experiments of combining the TIR and the UV/VIS have also been
20
recently done (Worden et al., 2007b), as well as some first attempts with real measure-ments (Cuesta et al., 2012). TIR measuremeasure-ments, in particular those obtained by the Infrared Atmospheric Sounding Interferometer (IASI), have been shown to have the capability of further distinguish the LT ozone information (up to 6 km altitude) when in presence of higher thermal contrasts, so for high sensitivity scenarios (Dufour et al.,
25
2010). In a comparative study with ozonesondes reference data involving 3 different
AMTD
5, 7025–7065, 2012LT ozone from IASI-NG
P. Sellitto et al.
Title Page
Abstract Introduction
Conclusions References
Tables Figures
◭ ◮
◭ ◮
Back Close
Full Screen / Esc
Printer-friendly Version Interactive Discussion
Discussion
P
a
per
|
Dis
cussion
P
a
per
|
Discussion
P
a
per
|
Discussio
n
P
a
per
|
always possible to derive a reliable and independent information on LT ozone from IASI. Notice that one of the three inversion schemes used in the mentioned paper, hereafter
mentioned as theLISA algorithm, is the inversion scheme used in the present work.
New generation observing systems are envisaged to improve the capability to moni-tor tropospheric composition in details, including AQ. In this context, one of the existing
5
projects is IASI-NG (Infrared Atmospheric Sounding Interferometer-New Generation) (Crevoisier et al., 2012; Clerbaux and Crevoisier, 2012). IASI-NG is expected to be launched in the 2020 timeframe as part of the EUMETSAT Polar System-Second Gen-eration (EPS-SG) programme (formerly called post-EPS programme). The instrument
will be a Fourier transform spectrometer with optical path difference greater than 4 cm;
10
its primary scientific objectives are to assure the continuity of IASI to measure meteo-rological parameters as well as trace gases in the Earth’s atmosphere, to improve the vertical sensitivity of IASI and, secondarily, to contribute to the monitoring of Essential Climate Variables (as in the definition of ESA Climate Change Initiative). IASI-NG has recently accomplished the phase-A stage (Crevoisier et al., 2012) and follows in its
15
heritage of IASI. It will have similar observation geometry than IASI, with a pixel size of 12 km diameter at the nadir. The spectral sampling interval (SSI), spectral resolution and radiometric noise will be improved of a factor 2. The SSI and spectral resolution
are then expected to have values of 0.125 cm−1, 0.25 cm−1, and a radiometric noise, in
terms of the noise equivalent spectral radiance (NESR), of 10 nW cm−2sr cm−1, in the
20
spectral band relevant for ozone retrievals (around 10 µm). A factor 2 improvement of the spectral and noise characterization with respect to IASI is expected to bring a clear added-value in the observation capabilities into the LT, both in terms of systematic and random errors, and of vertical resolution.
In this paper, we present a study aimed at comparing the performances of IASI-NG
25
AMTD
5, 7025–7065, 2012LT ozone from IASI-NG
P. Sellitto et al.
Title Page
Abstract Introduction
Conclusions References
Tables Figures
◭ ◮
◭ ◮
Back Close
Full Screen / Esc
Printer-friendly Version Interactive Discussion
Discussion
P
a
per
|
Dis
cussion
P
a
per
|
Discussion
P
a
per
|
Discussio
n
P
a
per
|
and short-term LT ozone evolutions. Another option is that its added-value is limited to a better characterization of continental scale phenomena. To this end, spatial and
temporal features are both investigated at those different scales. We based our
anal-ysis on the so-called pseudo-observations generated by a newly developed
pseudo-observation simulator. Using reference trace gases and meteorological fields, the
so-5
calledpseudo-reality, for a given period over Europe, the simulator calculates the TIR
spectra including noise and then inverts them to retrieve ozone concentration profiles, with a full inversion scheme. The selected study period is August 2009. This period is characterized by some interesting pollution events, like a tropospheric ozone plume de-veloping in the period 19–21 August, with ozone-rich airmasses extending from
South-10
ern France to the Scandinavian Peninsula. The set-up of our pseudo-observations sim-ulator, including the retrieval scheme, is described in Sects. 2.1 and 2.2. The error and vertical resolution characterization of the IASI and IASI-NG pseudo-observations is given in Sects. 3.1 and 3.2. We carried out a general statistical characterization of the pseudo-observations for the two observing systems and this is discussed in Sect. 4.1.
15
We then studied the added-values brought by IASI-NG in monitoring both LT ozone dis-tribution at continental and regional scale (Sect. 4.2), and at local scale (Sect. 4.3). This latter spatial scale is the most important for AQ. Finally, in Sect. 5 we give conclusions.
2 IASI and IASI-NG pseudo-observations
2.1 Pseudo-observations simulator
20
The pseudo-reality, in terms of both the meteorological variables and the trace gases concentrations, including the target ozone fields, is produced by means of the MOCAGE (MOd `ele de Chimie Atmosph ´erique `a Grande Echelle) chemistry and
trans-port model (CTM). MOCAGE simulates the physical and chemical processes aff
ect-ing gases and aerosols in both the troposphere and the stratosphere (e.g. Dufour
25
AMTD
5, 7025–7065, 2012LT ozone from IASI-NG
P. Sellitto et al.
Title Page
Abstract Introduction
Conclusions References
Tables Figures
◭ ◮
◭ ◮
Back Close
Full Screen / Esc
Printer-friendly Version Interactive Discussion
Discussion
P
a
per
|
Dis
cussion
P
a
per
|
Discussion
P
a
per
|
Discussio
n
P
a
per
|
The fine vertical grid of MOCAGE, from about 200 m into the lower troposphere to about 1 km into the stratosphere, has been reduced to the smaller vertical resolution required by the subsequent radiative transfer calculation, 1 km into the troposphere and lower stratosphere, and 2 to 5 km at higher altitudes. Topography data have been taken from GTOPO30 digital elevation model (http://www1.gsi.go.jp/geowww/globalmap-gsi/
5
gtopo30/gtopo30.html). Trace gas concentrations, pressure, temperature and specific humidity vertical profiles at the mentioned vertical resolutions are finally obtained and used as inputs for the radiative transfer (RT) calculations. For the present work, the presence of clouds has not been considered.
The Karlsruhe Optimized and Precise Radiative transfer Algorithm (KOPRA)
radia-10
tive transfer model (RTM) (Stiller et al., 2002) is used to simulate the radiation spectra viewed by the selected instruments. This model, formerly developed to simulate MI-PAS (MIchelson Interferometer Passive Atmospheric Sounding) limb measurements, has been adapted to the nadir geometry (Eremenko et al., 2008). The two instruments, IASI and IASI-NG are defined by their technical specifications. The observation
geom-15
etry has been taken from real IASI measurements, at the corresponding date of each
simulation. An instantaneous field-of-view set-up of 2×2 horizontal array of pixels of
12 km diameter each and spaced by 25 km at nadir has been, accordingly considered. IASI overpasses Europe twice a day, at about 09:00–10:00 UTC and 21:00–22:00 UTC. We simulated both overpasses, hereafter referred to as AM and PM overpasses. The
20
observations, in the region of interest (latitude: 35◦N–70◦N, longitude: 15◦W–35◦E),
are then about 18 000 for each overpass, so more than 1 million for the whole study period (August 2009). The instrumental spectral sampling and radiometric noise have
been modelled by the SSI and the NESR. The SSI of IASI is 0.25 cm−1,
correspond-ing to a 0.50 cm−1apodized spectral resolution (optical path di
fference of 2 cm), while
25
the NESR is 20.0 nW cm−2sr cm−1 (Clerbaux et al., 2009). IASI-NG is expected to
im-prove of a factor 2 both the spectral resolution and the radiometric noise (Crevoisier
et al., 2012). The SSI and NESR for IASI-NG are, accordingly, 0.125 cm−1 (0.25 cm−1
AMTD
5, 7025–7065, 2012LT ozone from IASI-NG
P. Sellitto et al.
Title Page
Abstract Introduction
Conclusions References
Tables Figures
◭ ◮
◭ ◮
Back Close
Full Screen / Esc
Printer-friendly Version Interactive Discussion
Discussion
P
a
per
|
Dis
cussion
P
a
per
|
Discussion
P
a
per
|
Discussio
n
P
a
per
|
2.2 Inversion algorithm
The simulated spectra are inverted by means of the KOPRAfit module embedding a dedicated algorithm based on a constrained least squares fit method, to obtain pseudo-observations of ozone profiles. The pseudo-observations can be, then, finally compared with the pseudo-reality to evaluate possibilities and limits of the selected
ob-5
serving system. The KOPRAfit also provides the averaging kernels (AvKs), that can be
used to derive the information on the vertical sensitivity of the different configurations
over several conditions defined, e.g. by the meteorology and surface characteristics. The inversion algorithm used to derive the pseudo-observations, hereafter referred
to asLISA algoritm(Eremenko et al., 2008), is an altitude-dependent Tikhonov-Phillips
10
regularization method, embedded into the KOPRAfit retrieval module using the KOPRA RTM. Altitude dependent Tikhonov-Phillips regularization methods were introduced by Kulawik et al. (2006); the method is here optimized for LT ozone observations using IASI measurements (Eremenko et al., 2008). The constraint matrix and parameters of the LISA algorithm are optimized to maximize the degrees of freedom (DOF) and
15
minimize the error in the LT while retaining a sufficient accuracy in the upper
tropo-sphere and in the stratotropo-sphere. Dufour et al. (2012) evaluated the performances of ozone profiles obtained by means of the LISA algorithm with a validation exercise us-ing ozonesondes measurements and verified the very good performances in the LT, if compared to other scientific retrieval schemes. In this validation, the mean DOF of
20
the LISA algorithm is in the range 0.4–0.6 and the estimated error is about 12.5 %, at mid-latitudes. The ozone a priori profiles used in the present work are derived from McPeters climatology (McPeters et al., 2007). To avoid numerical instability and
aber-rant oscillations in the retrieved profiles, we used a different a priori depending on
tropopause height derived from the pseudo-reality. We consider a tropopause higher
25
than 14 km as a proxy for tropical airmasses and then we used a tropical a priori (yearly
climatological profile 20–30◦N) in those cases. We used a mid-latitude a priori (summer
climatological profile 30–60◦N) in the other cases. The use of two di
AMTD
5, 7025–7065, 2012LT ozone from IASI-NG
P. Sellitto et al.
Title Page
Abstract Introduction
Conclusions References
Tables Figures
◭ ◮
◭ ◮
Back Close
Full Screen / Esc
Printer-friendly Version Interactive Discussion
Discussion
P
a
per
|
Dis
cussion
P
a
per
|
Discussion
P
a
per
|
Discussio
n
P
a
per
|
particular a mid-latitude and tropical climatological profiles, has been already success-fully exploited for LISA algorithm (Dufour et al., 2010). The LISA algorithm operates
at seven spectral microwindows, in the region of 975–1100 cm−1, for avoiding carbon
dioxide and water vapour impact on ozone retrievals. For more details, please refer to the comprehensive description of the LISA algorithm in (Eremenko et al., 2008; Dufour
5
et al., 2010).
3 Characterization of the pseudo-observations
3.1 Error estimation for IASI and IASI-NG tropospheric ozone retrievals
In this section, we provide a comparative analysis of the error budget estimated for IASI and IASI-NG pseudo-observations.
10
According to Rodgers (1990), if the inversion occurs in an incrementally linear regime, the total error budget of a constrained least squares fit method can be sepa-rated into three main components: (a) measurement noise (random) error, (b) smooth-ing error due to the limited vertical resolution of the observsmooth-ing system, and (c) model parameters (systematic) error. Equation (1) describes analytically these three error
15
components, the smoothing, the measurement noise and the systematic error,
respec-tively.AvKis the averaging kernel matrix, that is extensively analyzed and discussed in
Sect. 3.2,Gis the gain matrix,Ksystis the Jacobian matrix for the systematic errors and
Iis the identity matrix. The covariance matrices for the total error, the a priori ozone
variability, the measurement noise and the systematic error are here indicated asSe,
20
Sa,SmandSsys.
Se=(I−AvK)Sa(I−AvK)
T
+GSmGT+GKsystSsyst GKsystT
(1)
AMTD
5, 7025–7065, 2012LT ozone from IASI-NG
P. Sellitto et al.
Title Page
Abstract Introduction
Conclusions References
Tables Figures
◭ ◮
◭ ◮
Back Close
Full Screen / Esc
Printer-friendly Version Interactive Discussion
Discussion
P
a
per
|
Dis
cussion
P
a
per
|
Discussion
P
a
per
|
Discussio
n
P
a
per
|
covariance and the regularization matrix as the constraints of the least square minimi-sation (Steck and von Clarmann, 2000).
Figure 1a, b show the mean measurement, smoothing and total error (in absolute, Fig. 1a, and percent units, Fig. 1b), for IASI and IASI-NG pseudo-observations, aver-aged over all pixels of the day 20 August 2009, for the AM overpass. The results for the
5
PM overpass are very similar (not shown here). The mid-latitude a priori and pseudo-reality variability are also shown as a reference. The first one is given by the diagonal elements of the mid-latitude a priori covariance. The errors for this day are quite rep-resentative of the other days and of individual pixels. The dominant error component is the smoothing error. It has values of about 25 % at the surface for the two
instru-10
ments, 15–20 % for IASI-NG and 20–25 % for IASI in the interval 2–6 km, and 20–25 % for IASI-NG and 20–30 % for IASI in the interval 7–12 km. For the measurement noise error, we found typical values of 3–4 % at the surface for the two instruments, 3–7 % for IASI-NG and 6–9 % for IASI in the interval 2–6 km, and 3–12 % for IASI-NG and 7–11 % for IASI in the interval 7–12 km. Correspondingly, total error typical values were about
15
30 % (10.2 ppb) at the surface for the two instruments, 22–30 % (8.3–9.9 ppb) for IASI-NG and 30–35 % (10.3–15.5 ppb) for IASI in the interval 2–6 km, and 24–40 % (10.4– 44.6 ppb) for IASI-NG and 30–40 % (12.2–50.2 ppb) for IASI in the interval 7–12 km. Figure 1c summarizes these results as a percent improvement of IASI-NG error over
IASI error, defined as the percent difference of the absolute measurement, smoothing
20
and total errors of IASI-NG and IASI. The improvement is particularly significant for the smoothing component in the range 1–5 km and for the measurement noise com-ponent in the range 3–7 km. The improvement of the total error reaches values higher than 35 % at 5 km. The errors on the tropospheric ozone column (TOC) for IASI/IASI-NG are: 3.81 DU (10.51 %)/3.12 DU (8.41 %), for the TOC surface-12 km, and 2.49 DU
25
AMTD
5, 7025–7065, 2012LT ozone from IASI-NG
P. Sellitto et al.
Title Page
Abstract Introduction
Conclusions References
Tables Figures
◭ ◮
◭ ◮
Back Close
Full Screen / Esc
Printer-friendly Version Interactive Discussion
Discussion
P
a
per
|
Dis
cussion
P
a
per
|
Discussion
P
a
per
|
Discussio
n
P
a
per
|
error are considered, while Eremenko et al. (2008) considered also temperature profile errors and other systematic error sources. These components may explain the small
difference between our IASI pseudo-observations and IASI real measurements error
analysis described by Eremenko et al. (2008). Indeed, error components other than smoothing and measurement noise usually contribute for a few percent (Boynard et al.,
5
2009). From the comparison of the two set of pseudo-observations, we found that er-rors on the TOC surface-6 km, taken as representative of the LT ozone, are nearly 20 % smaller for IASI-NG.
3.2 Averaging kernels shape and vertical sensitivity to ozone
In the following, we discuss and compare some important quantities to characterize the
10
pseudo-observation of IASI and IASI-NG, with emphasis on the vertical resolution. To
do so, we analyze theAv Ks shape and some derived quantities.
The AvK matrix has already been introduced in Sect. 3.1 for his role in
determin-ing the smoothdetermin-ing error component. The AvK matrix represents the sensitivity of
the retrieved to the true profile. Each AvK matrix row shows the fractional
height-15
resolved source of information for the retrieval at the selected altitude. For higher val-ues, a greater fraction of information is taken from the observed spectrum, the
remain-ing fraction comremain-ing from the a priori. In Fig. 2, we show the AvK rows for nominal
altitudes from surface to 12 km, for the two instruments, calculated as means over all pixels in August 2009 with thermal contrast lying into a chosen interval. We show the
20
averageAv Ks for pixels with thermal contrast in the interval [+8.0, +9.0] K, as
repre-sentative of high sensitivity scenarios, and [−9.0,−8.0] K as representative of low
sen-sitivity scenarios. The greatest added-value of IASI-NG emerges for the small sensitiv-ity scenarios. There, IASI-NG pseudo-observations have a significantly better vertical sensitivity, represented by narrow functions peaking at lower altitudes. In general, we
25
found significantly better performances of the IASI-NG in presence of small/negative
thermal contrasts. In Fig. 3, we also show the integralAv Ks calculated for the ozone
AMTD
5, 7025–7065, 2012LT ozone from IASI-NG
P. Sellitto et al.
Title Page
Abstract Introduction
Conclusions References
Tables Figures
◭ ◮
◭ ◮
Back Close
Full Screen / Esc
Printer-friendly Version Interactive Discussion
Discussion
P
a
per
|
Dis
cussion
P
a
per
|
Discussion
P
a
per
|
Discussio
n
P
a
per
|
upper and the whole troposphere. What we found is that the integralAv Ks of IASI-NG
for the lower and upper troposphere are well separated also for small sensitivity sce-narios (see Fig. 3b), thus confirming the previous findings. For IASI, on the contrary,
the integralAv Ks surface-6 km and 7–12 km are partially overlapped in low sensitivity
scenarios (see Fig. 3a), thus indicating that our IASI pseudo-observations have not
5
the potential to single out the LT information component in those cases. This result is coherent with several studies dealing with tropospheric ozone retrievals from IASI (e.g. Dufour et al., 2010). On the other hand, the separation of lower to upper tropospheric ozone information is better possible with IASI-NG over several scenarios, both with higher and lower/negative thermal contrast.
10
Other two valuable diagnostic parameters to study the vertical sensitivity of a retrieval
are the DOF and the altitude of the maximum of the Av Ks. DOF is a quantity that
indicates the number of independent pieces of information that can be determined from
a measurement. It is linked to the AvK matrix by means of the following relationship
(Rodgers, 2000):
15
DOF=tr(AvK) (2)
DOF for ozone partial columns are obtained from theAvKby calculating the trace up to
the top height of the column. It is straightforward how the total DOF or the DOF for the partial columns can be seen as one scalar quantity which describes the more complex
AvKmatrix quantity in terms of the vertical sensitivity of the retrieval. This parameter
20
is complemented by the altitude of the maximum of the Av K of a selected altitude
or column. In the following, we will concentrate on the altitude of the maximum of the
integralAv K of the TOC surface-6 km, which represents the altitude of maximum
sen-sitivity of the observations of the TOC surface-6 km. Figure 4 shows the histogram of DOF surface-6 km and altitude of maximum sensitivity for all the observations in August
25
AMTD
5, 7025–7065, 2012LT ozone from IASI-NG
P. Sellitto et al.
Title Page
Abstract Introduction
Conclusions References
Tables Figures
◭ ◮
◭ ◮
Back Close
Full Screen / Esc
Printer-friendly Version Interactive Discussion
Discussion
P
a
per
|
Dis
cussion
P
a
per
|
Discussion
P
a
per
|
Discussio
n
P
a
per
|
sensitivity of IASI-NG for the TOC surface-6 km is more than 0.5 km lower than for IASI, reaching a mean value of nearly 3.0 km for the AM overpass. The PM overpass is characterized by a significantly lower vertical sensitivity for both instruments. This can be related to the smaller thermal contrasts that characterize, on average, the PM overpasses. The mean values of the DOF surface-6 km, at PM, are about 10 % smaller
5
than for AM overpasses, in particular 0.63 and 0.48 for IASI-NG and IASI, respectively. The maximum sensitivity is found more than 0.5 km higher than for AM overpasses, on average, and in particular at 3.7 and 4.3 km for the two instruments. Nevertheless, it should be noticed that the mean DOF at PM overpass for IASI-NG is higher than the mean DOF for IASI at AM overpass. Moreover, the mean maximum sensitivity altitude
10
is lower for the PM overpass of IASI-NG than for the AM overpass of IASI. The vertical sensitivity in the LT of IASI-NG at PM is then comparable to that of IASI at AM.
The analyses of this and the previous sections clearly show the improved accuracy and vertical sensitivity in the LT of IASI-NG. In the next sections, we analyze how this potential is expected to impact on the observation capabilities in the LT, in particular for
15
the tropospheric ozone monitoring at both continental/regional and local scales.
4 LT ozone distributions retrieved by IASI and IASI-NG
4.1 Global analysis
In the present section, we give a global characterization of the pseudo-observations. To this end, we have performed a general statistical analysis of IASI and IASI-NG
tropo-20
spheric ozone profile and TOC surface-6 km pseudo-observations, by comparing them to the reference MOCAGE pseudo-reality, based on several statistical parameters.
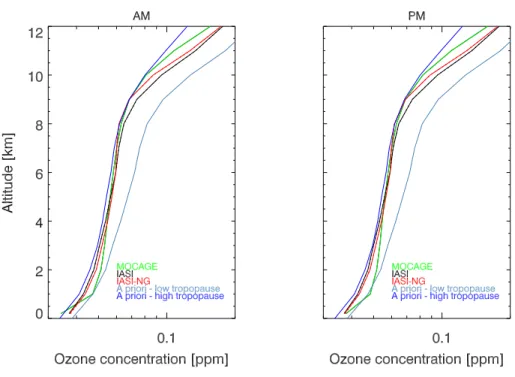
Figure 5 shows the monthly average ozone profile in the troposphere from pseudo-reality, and IASI and IASI-NG pseudo-observations, for AM and PM overpasses. As a further reference, the two a priori profiles are also shown on the plots. It is clear
25
AMTD
5, 7025–7065, 2012LT ozone from IASI-NG
P. Sellitto et al.
Title Page
Abstract Introduction
Conclusions References
Tables Figures
◭ ◮
◭ ◮
Back Close
Full Screen / Esc
Printer-friendly Version Interactive Discussion
Discussion
P
a
per
|
Dis
cussion
P
a
per
|
Discussion
P
a
per
|
Discussio
n
P
a
per
|
the interval 1–4 km and overestimate the pseudo-reality in the range 9–12 km. This
effect is more marked for IASI. AM and PM overpasses behave in a quite similar
man-ner. Please note how the low tropopause/mid-latitude and the high tropopause/tropical a priori respectively overestimate and underestimate the mean pseudo-reality ozone
profile. This effect has an impact on the pseudo-observations and it will be recalled
5
later during the interpretation of their behaviour. Figure 6 shows the percent bias, the
percent RMSE and the linear correlation (Pearson) coefficient profiles for IASI and
IASI-NG, with respect to pseudo-reality, for AM and PM overpasses. In Table 1, the same parameters are reported as vertical averages in the intervals 0–3 km, 0–6 km, 0–12 km and 7–12 km. For both instruments, the bias is negative from 0 to 4 km, tends to be
10
very small from 4 to 8 km, and it is positive at higher altitudes, reaching values as high as 15 % for IASI-NG and 25 % for IASI. The negative bias of the AM overpass for IASI of about the 3 % in the range 0–3 km, as well as the positive bias of about the 11.5 % in the range 7–12 km are reduced by about 50 % with IASI-NG (see Table 1). Also for the PM overpass, the biases are strongly reduced by IASI-NG. The underestimation
15
at the lowest levels may be due to the small sensitivity and the different impact of the
a priori profiles. The high tropopause/tropical a priori is strongly negatively biased in the range surface-3 km (see Fig. 5) and may certainly transmit this negative bias to the
pseudo-observations. TheAv Ks, indeed, are generally very small at those altitudes
and a strong contribution of the a priori is expected on the pseudo-observations. On
20
the contrary, the low tropopause/mid-latitude a priori has similar values with respect to
pseudo-reality in that range. The net effect on the overall dataset is likely to be a
nega-tive bias. The neganega-tive bias is less important for IASI-NG because this latter instrument has a better sensitivity at the lowest altitudes and then a smaller contribution of the a priori. As for the overestimations in the range 8–12 km, this is coherent with the
vali-25
AMTD
5, 7025–7065, 2012LT ozone from IASI-NG
P. Sellitto et al.
Title Page
Abstract Introduction
Conclusions References
Tables Figures
◭ ◮
◭ ◮
Back Close
Full Screen / Esc
Printer-friendly Version Interactive Discussion
Discussion
P
a
per
|
Dis
cussion
P
a
per
|
Discussion
P
a
per
|
Discussio
n
P
a
per
|
As for the RMSE, the lowest values are in the range 2–8 km (where the information provided by IASI and IASI-NG spectra contribute the most), reaching values as small as 10 % for IASI-NG and 20 % for IASI, for the AM overpass, and 12 % and 23 %, for the
PM overpass. The Pearson correlation coefficient over the whole dataset has the more
significant differences between IASI and IASI-NG. The vertical profile has two maxima,
5
one at about 4 km and one at 12 km. At those maxima, typical values for IASI are 0.50– 0.75 while IASI-NG can reach values of 0.90–0.95, for the AM overpass. In addition, while IASI-NG performances for the AM and PM overpasses are quite similar, the IASI pseudo-observations performances at PM show a significant degradation, especially in the range 0–6 km, where a vertically averaged value of 0.30 is found (see Table 1).
10
This behaviour can be easily associated with the results of Sect. 3.2, and in particu-lar of Fig. 3. In fact, it has been shown that the performances of IASI are particuparticu-larly weak at unfavourable conditions, i.e. in presence of small/negative thermal contrasts. IASI-NG, on the contrary, performs quite well also over low sensitivity scenarios. Dur-ing the PM overpass, small/negative thermal contrasts are significantly more frequent
15
and then the added-value brought by IASI-NG is more critical. In general, biases and RMSEs of the profiles are systematically smaller and correlations are systematically higher for IASI-NG, reaching an improvement of 26 % (RMSE) and 67 % (correlation) with respect to IASI in the range surface-6 km. There, IASI-NG has nearly no bias, on average, at AM overpass. Note that the bias can be significant over specific scenarios
20
or over selected sub-regions (see Sects. 4.2 and 4.3). The significant bias in the up-per troposphere for IASI, about 11 % on average in the interval 7–12 km, is reduced to about the 5–6 % by IASI-NG, which brings an improvement of more than 50 %.
We have also compared IASI and IASI-NG TOC surface-6 km pseudo-observations.
IASI has RMSE, bias and Pearson coefficient of about 15.5 %,−2.5 % and 0.65.
IASI-25
NG is able to retrieve the TOC surface-6 km with a 9 % RMSE, a−1 % bias and a 0.88
correlation coefficient (AM overpass); this is the 41 %, 54 % and 33 % better than for
AMTD
5, 7025–7065, 2012LT ozone from IASI-NG
P. Sellitto et al.
Title Page
Abstract Introduction
Conclusions References
Tables Figures
◭ ◮
◭ ◮
Back Close
Full Screen / Esc
Printer-friendly Version Interactive Discussion
Discussion
P
a
per
|
Dis
cussion
P
a
per
|
Discussion
P
a
per
|
Discussio
n
P
a
per
|
4.2 Tropospheric ozone distribution at regional scale
Here we present our analyses of the performances of IASI and IASI-NG to describe tropospheric ozone plumes at regional scale over Europe. We studied both spatial distributions and temporal evolutions.
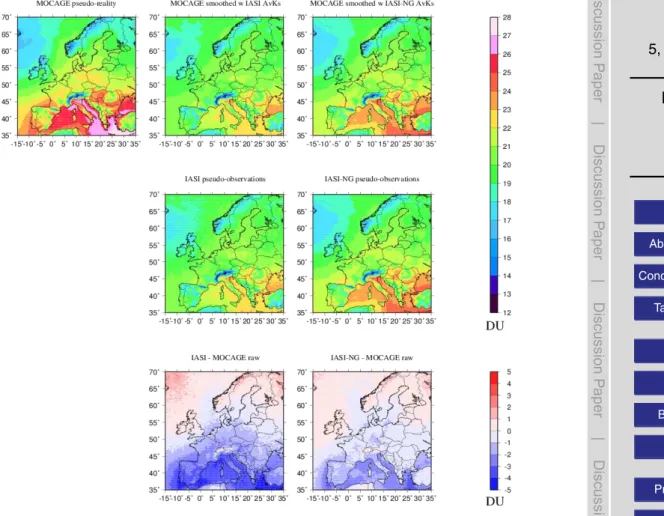
Figure 7 shows the maps of the average TOC surface-6 km for August 2009, from
5
raw and AvK-smoothed MOCAGE reality, and IASI and IASI-NG
pseudo-observations. The differences of IASI and IASI-NG pseudo-observations with respect to
raw MOCAGE pseudo-reality are also shown (bottom of the figure). In addition, Table 2 reports on the mean biases and RMSEs of IASI and IASI-NG pseudo-observations
in the whole Europe and in four sub-regions: Northern (latitude greater than 52.5◦
N)-10
Land, Northern-Sea, Southern (latitude smaller than 52.5◦N)-Land and Southern-Sea
pixels. These results show that both IASI and IASI-NG underestimate the
pseudo-reality at southern sub-region and overestimate it at northern sub-region. This effect
is likely due to the small sensitivity of both pseudo-observations at the lowest levels (surface to 3 km). There, the a priori information prevails in the retrieval. Indeed, at
15
southern locations high tropopauses are more likely, thus we use quite systematically the tropical a priori which is negatively biased with respect to MOCAGE pseudo-reality (see Fig. 5). The negative bias at southern locations is more marked over sea than over land. It should be mentioned that smaller thermal contrasts are expected over sea than over land. At northern locations, in particular at north-west quadrant, we find a small
20
overestimation. Also the overestimation is due to the scarce sensitivity at the lowest
lev-els and to the effect of the low tropopause/mid-latitude a priori, which indeed tends to
slightly overestimate the pseudo-reality (see Fig. 5). The areas of under/overestimation are much less extended for IASI-NG, and deviations are smaller. On average, IASI un-derestimates of over 10 % at southern sub-region (about 8 % over land and 12.5 % over
25
AMTD
5, 7025–7065, 2012LT ozone from IASI-NG
P. Sellitto et al.
Title Page
Abstract Introduction
Conclusions References
Tables Figures
◭ ◮
◭ ◮
Back Close
Full Screen / Esc
Printer-friendly Version Interactive Discussion
Discussion
P
a
per
|
Dis
cussion
P
a
per
|
Discussion
P
a
per
|
Discussio
n
P
a
per
|
of the same magnitude for the two instruments, and generally small. No clear land/sea
difference is found in the performances of IASI and IASI-NG at northern sub-regions.
As for the RMSE, the values over the whole Europe are about 13.5 % for IASI and about 9.7 % for IASI-NG. These values may be considered as a posteriori total er-rors and then compared to the theoretical erer-rors on the TOC surface-6 km discussed
5
in Sect. 3.1: only a very small overestimation of the a posteriori error is made by the theoretical total error calculation (0.1 and 0.2 DU overestimation for IASI and IASI-NG, respectively), showing the coherence of our error estimations.
After the general characterization of pseudo-observations over Europe, we got some insights into the temporal evolution at continental to regional scale. To this aim, we
10
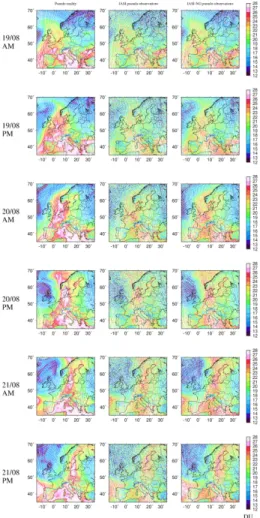
study a peculiar LT ozone plume evolution occurring in the period 19–21 August 2009 and analyze how the two instruments are able to characterize this kind of phenomenon. These days are characterized by a pollution event. Figure 8 shows the TOC surface-6 km from MOCAGE pseudo-reality, and IASI and IASI-NG pseudo-observations, for the 3 days. High values of the TOC surface-6 km over the south of France on the
15
19 August were moving toward north-east, reaching north of France to Netherlands on the 20 August, and then Germany, Poland and the Scandinavian Peninsula on the 21 August (see first column of Fig. 8). In addition to this ozone plume evolution, some persistent high ozone levels can be seen over the Po Valley and the Mediterranean Basin. IASI-NG is able to better depict the ozone plume and its evolution, both for the
20
AM and the PM overpasses. PM observations carry less information than AM observa-tions, due to the smaller thermal contrasts during the PM overpass. In spite of this, PM observations by IASI-NG still contribute at the description of the ozone plume evolution, owing to the better performances of IASI-NG in presence of small sensitivity scenarios. Also the region with very small TOCs at the north-west quadrant and the area with very
25
AMTD
5, 7025–7065, 2012LT ozone from IASI-NG
P. Sellitto et al.
Title Page
Abstract Introduction
Conclusions References
Tables Figures
◭ ◮
◭ ◮
Back Close
Full Screen / Esc
Printer-friendly Version Interactive Discussion
Discussion
P
a
per
|
Dis
cussion
P
a
per
|
Discussion
P
a
per
|
Discussio
n
P
a
per
|
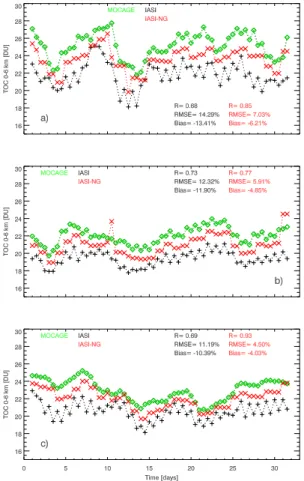
In order to analyse smaller regions showing a high ozone load, we focused our at-tention on some regional domains. Time series of raw MOCAGE TOC surface-6 km pseudo-reality, and IASI and IASI-NG pseudo-observations over Po Valley, Eastern and western section of the Mediterranean Basin are shown in Fig. 9. The general fea-ture over those regions, where we mainly used the high tropopause/tropical a priori,
5
is a quite systematic underestimation of both pseudo-observations. The bias for IASI at those locations is in the range 10.5–13.5 %, while IASI-NG reduces biases of 50 to 60 %, reaching values as low as 4.0–6.0 %. A further systematic underestimation for PM overpasses is present, creating unrealistic oscillations (alternating day/night) in the
time series. This latter effect is likely due to the smaller sensitivity at lower altitudes
10
for PM overpass, which is typically characterized by smaller thermal contrasts. This
effect is strongly mitigated by IASI-NG, see, e.g. the very strong oscillations in the IASI
dataset from 15 to 20 August over the Po Valley (Fig. 9a) and from 25 to 31 August over the Western Mediterranean region (Fig. 9c). As for the RMSEs and Pearson
co-efficients, IASI exhibits values in the range 11.0–14.5 % and 0.68–0.73, while IASI-NG
15
can reach values as low as 4.5 % for the RMSE and 0.93 for the Pearson coefficient,
at Western Mediterranean region. Finally, the time series from IASI-NG follow quite well the temporal variability of MOCAGE pseudo-observations at regional scale, thus indicating that IASI-NG is better suited than IASI to monitor LT ozone at this spatial scale.
20
4.3 Local scale and air quality
In the present section, we investigate the behaviour of the two pseudo-observation datasets at a smaller spatial scale. We focus our analysis on some selected locations.
The typical dimension of the areas is about 0.5◦
×0.5◦. The scope of this analyses is
to evaluate the performances of IASI-NG for the monitoring of local evolutions of LT
25
AMTD
5, 7025–7065, 2012LT ozone from IASI-NG
P. Sellitto et al.
Title Page
Abstract Introduction
Conclusions References
Tables Figures
◭ ◮
◭ ◮
Back Close
Full Screen / Esc
Printer-friendly Version Interactive Discussion
Discussion
P
a
per
|
Dis
cussion
P
a
per
|
Discussion
P
a
per
|
Discussio
n
P
a
per
|
Time series of MOCAGE pseudo-reality, and IASI and IASI-NG pseudo-observations over Amsterdam, the Netherlands; Berlin, Germany; Paris, France; Barcelona, Spain;
a marine location west of Norway coasts (58.0◦N–5.0◦E) are shown in Fig. 10. We have
selected those locations to have examples of urban scenarios at the northern part of Europe, at the southern part of Europe and a remote (marine) location. We aimed at
5
evaluating the potential of IASI-NG over a set of different situations. We first discuss
the urban locations in the northern part of Europe, those of Fig. 10a, b, c. For those pseudo-observations, the low tropopause/mid-latitude a priori is used for the majority of the retrievals, so no systematic negative biases are expected. As it is possible to see from Fig. 10, IASI-NG, despite showing some slight underestimation, has proved to be
10
significantly more sensitive to ozone peaks developing over short time periods (a few days) over Northern European urban locations. To verify this sensitivity over evolution of a few days, refer to, for example, 24 August at Paris (Fig. 10c), 20–31 August at Amsterdam (Fig. 10a), 25 August at Berlin (Fig. 10b). More marked underestimations are observed at Southern European urban locations, see the example of Barcelona
15
in Fig. 10d. A systematic underestimation, due to the a priori, is expected at South-ern Europe, following from the results of Sect. 4.2. There, IASI-NG can significantly reduce the characteristic negative bias (about 45 % reduction of the negative bias at
Barcelona, reaching a value of−7.7 %). Finally, as an example of remote locations we
show a marine location over the North Sea of Fig. 10e. There, both IASI and
IASI-20
NG work pretty well, while IASI-NG still captures better the peaks probably related to small-scale transport phenomena, see, e.g. the case of 2 August.
As a complement to Fig. 10, MOCAGE reality, IASI and IASI-NG pseudo-observations and a priori tropospheric profiles for the peak of the 24 August, AM
over-pass, in Paris are shown in Fig. 11. TheAv Ks from surface to 12 km, for IASI and
IASI-25
AMTD
5, 7025–7065, 2012LT ozone from IASI-NG
P. Sellitto et al.
Title Page
Abstract Introduction
Conclusions References
Tables Figures
◭ ◮
◭ ◮
Back Close
Full Screen / Esc
Printer-friendly Version Interactive Discussion
Discussion
P
a
per
|
Dis
cussion
P
a
per
|
Discussion
P
a
per
|
Discussio
n
P
a
per
|
over Berlin for the two days are reported in Fig. 12. The added-value of IASI-NG may be related to a better sensitivity in the range 2–6 km, while marked peaks of the pseudo-reality from surface to 2 km are not generally detected. In any case, there still is a better sensitivity for IASI-NG, see, e.g. 25 August at Berlin (Fig. 12). Vertical fea-tures of less than 2–3 km resolution are not caught by IASI-NG, while feafea-tures of about
5
4–5 km are sometimes caught by IASI-NG but not by IASI, whose typical vertical res-olution is about 6–8 km (Boynard et al., 2009). The example of the retrieval over Paris of Fig. 11 shows pretty well this latter aspect. The IASI pseudo-observation completely fails in retrieving the vertical behaviour of the pseudo-reality, which is characterized by a 4–5 km resolution oscillation at 9–13 km. While the IASI pseudo-observation is
10
only shifted with respect to the a priori, IASI-NG was able to follow the vertical trend and, correspondingly, to detect also the enhanced values at the lowest layers.
IASI-NGAv Ks show more sensitivity at 9 km, as well as at the mentioned interval 2–6 km
(Fig. 11c). The Av Ks of the ranges 8–10 km are more peaked at the nominal
alti-tudes, while for IASI they peak at higher or lower altitudes and values vanish at 7–9 km
15
(Fig. 11b). A similar situation is shown in Fig. 12, for the 25 August over Berlin. The two retrievals are likely associated to the same plume, passing over the two cities in two consecutive days. For these two cases, the 24 August over Paris and the 25 August over Berlin, the TOC surface-6 km is markedly underestimated by IASI, while it is better estimated by IASI-NG. On the contrary, the case of the 11 August over Berlin shows
20
a typical situation where vertical features of about 2–3 km are not correctly retrieved by both IASI and IASI-NG. The relatively high values of the TOC surface-6 km at Berlin on the 11 August can be linked to a very localized pollution event, as it is possible to argue by seeing Fig. 12.
In general, our results suggest that IASI-NG will be able to give, in several different
25
situations, a significant added-value with respect to IASI also for the monitoring of LT ozone at local scale, both at urban and remote locations. Sometimes, on the contrary,
IASI-NG is not sufficiently sensitive, see, e.g. the entire time series of Barcelona or the
AMTD
5, 7025–7065, 2012LT ozone from IASI-NG
P. Sellitto et al.
Title Page
Abstract Introduction
Conclusions References
Tables Figures
◭ ◮
◭ ◮
Back Close
Full Screen / Esc
Printer-friendly Version Interactive Discussion
Discussion
P
a
per
|
Dis
cussion
P
a
per
|
Discussion
P
a
per
|
Discussio
n
P
a
per
|
5 Conclusions
We have presented a study of the performances of IASI and IASI-NG TIR nadir satel-lite instruments, based on a set of pseudo-observations generated by means of a new modular pseudo-observations simulator. Our simulator is built with the KOPRA RTM and an embedded inversion algorithm routinely used to retrieve high quality lower
tro-5
pospheric ozone information from the IASI real measurements. We have used the MOCAGE CTM to produce the pseudo-reality. We focused our attention on the LT ozone pseudo-observations to investigate how IASI-NG would impact the monitoring of ozone at time-space scales relevant to AQ. We based our analysis on one month, August 2009, AM and PM overpasses, of IASI and IASI-NG pseudo-observations. We
10
found that IASI-NG would likely bring a specific added-value in the observation of local and short term ozone pollution phenomena and evolution of LT ozone plumes. This may be due to the better vertical resolution in the troposphere. Our results suggest that IASI-NG will be able to catch ozone vertical patterns of 4–5 km resolution while IASI has 6–8 km as upper limit for the vertical resolution in the troposphere. This higher
ver-15
tical resolution would bring to values as high as 0.70 DOFs for the TOC surface-6 km, with a maximum sensitivity at nearly 3.0 km altitude, which is about the 30 % better, for the DOF, and more than 0.5 km lower, for the maximum sensitivity, than IASI. This
al-lows an efficient separation of the lower from upper troposphere information also over
low sensitivity scenarios, e.g. with a small or negative thermal contrast. In addition,
20
the errors of the TOC surface-6 km, both from a prior theoretical and from a posteri-ori calculations, are reduced from the values of 2.5–2.4 DU (14.0–13.5 %), for IASI, to 2.0–1.8 DU (10.7–9.7 %), for IASI-NG. According to our analysis, IASI-NG is expected
to be able to very effectively reduce the marked underestimations that our inversion
scheme shows at Southern European sub-region, especially over sea pixels. The
re-25
AMTD
5, 7025–7065, 2012LT ozone from IASI-NG
P. Sellitto et al.
Title Page
Abstract Introduction
Conclusions References
Tables Figures
◭ ◮
◭ ◮
Back Close
Full Screen / Esc
Printer-friendly Version Interactive Discussion
Discussion
P
a
per
|
Dis
cussion
P
a
per
|
Discussion
P
a
per
|
Discussio
n
P
a
per
|
moving northwards and eastwards from south of France to the Scandinavian Penin-sula. The most interesting result of our work is the improved capability of IASI-NG in monitoring small scale and short term pollution evolutions, so in a time-space scale
relevant for AQ. In particular, IASI-NG is expected to be very effective in depicting LT
ozone peaks evolutions within time-frames of a few days, over urban locations.
Sce-5
narios of this kinds have been selected, e.g. in Paris and Berlin urban areas, where IASI-NG has demonstrated its added-value with respect to IASI. By the way, we found that vertical features with a resolution of 2–3 km are not well discriminated by IASI-NG, nor very local ozone enhancements at the lowest altitude layers. All these results show
how IASI-NG would likely be a clear step forward towards a more effective
monitor-10
ing of LT ozone at scales relevant for AQ from a low Earth orbit. Finally, we want to mention that the LT ozone variability at time scales shorter than 1 day gives a further constraint on the revisit time and a properly designed constellation of LEO instruments or, conversely, a geostationary observing system would be necessary for this issue.
Acknowledgements. The authors are grateful to CNRS-INSU for publication support. This
15
work is carried on in the framework of the CNES/TOSCA/GeoQAir (quantification de l’apport d’une plateforme d’observations G ´EOstationnaires pour la surveillance de la Qualit ´e de l’AIR) and CNES/TOSCA/IASI-NG projects. We wish to thank the Institut f ¨ur Meteorologie und Klimaforschung (IMK), Karlsruhe Institute of Technology (KIT), Germany, for a licence to use KOPRA radiative transfer model. This work makes use of results produced with the EGI-France
20
AMTD
5, 7025–7065, 2012LT ozone from IASI-NG
P. Sellitto et al.
Title Page
Abstract Introduction
Conclusions References
Tables Figures
◭ ◮
◭ ◮
Back Close
Full Screen / Esc
Printer-friendly Version Interactive Discussion
Discussion
P
a
per
|
Dis
cussion
P
a
per
|
Discussion
P
a
per
|
Discussio
n
P
a
per
|
The publication of this article is financed by CNRS-INSU.
References
Amann, M., Bertok, I., Cofala, J., Gyarfas, F., Heyes, C., Klimont, Z., Sch ¨opp, W., and Wini-warter, W.: Baseline scenarios for the Clean Air For Europe (CAFE) programme, Tech. rep.,
5
International Institute for Applied Systems Analysis, for the European Commission Direc-torate General for Environment, DirecDirec-torate C: Environment and Health, 2005. 7027
Boynard, A., Clerbaux, C., Coheur, P.-F., Hurtmans, D., Turquety, S., George, M., Hadji-Lazaro, J., Keim, C., and Meyer-Arnek, J.: Measurements of total and tropospheric ozone from IASI: comparison with correlative satellite, ground-based and ozonesonde
observa-10
tions, Atmos. Chem. Phys., 9, 6255–6271, doi:10.5194/acp-9-6255-2009, 2009. 7035, 7044 Clerbaux, C. and Crevoisier, C.: Infrared remote sensing of the troposphere: less, but better,
Atmos. Environ., submitted, 2012. 7029
Clerbaux, C., Boynard, A., Clarisse, L., George, M., Hadji-Lazaro, J., Herbin, H., Hurtmans, D., Pommier, M., Razavi, A., Turquety, S., Wespes, C., and Coheur, P.-F.: Monitoring of
atmo-15
spheric composition using the thermal infrared IASI/MetOp sounder, Atmos. Chem. Phys., 9, 6041–6054, doi:10.5194/acp-9-6041-2009, 2009. 7031
Crevoisier, C., Armante, R., Capelle, V., Ch ´edin, A., Jacquinet-Husson, N., Scott, N., Stuben-rauch, C., Clerbaux, C., George, M., Hadji-Lazaro, J., Payan, S., Guidard, V., Fourri ´e, N., Barret, B., Le Flochmo ¨en, E., Dufour, G., Beekmann, M., Dauphin, P., Eremenko, M.,
20
AMTD
5, 7025–7065, 2012LT ozone from IASI-NG
P. Sellitto et al.
Title Page
Abstract Introduction
Conclusions References
Tables Figures
◭ ◮
◭ ◮
Back Close
Full Screen / Esc
Printer-friendly Version Interactive Discussion
Discussion
P
a
per
|
Dis
cussion
P
a
per
|
Discussion
P
a
per
|
Discussio
n
P
a
per
|
la pr ´evision num ´erique du temps, Tech. rep., CNRS, Comit ´e Terre solide, oc ´ean, surfaces continentales, atmosph ´ere, 2012. 7029, 7031
Crutzen, P. J. and Stoermer, E. F.: The anthropocene, Global Change Newsletter, 41, 17–18, 2000. 7027
Cuesta, J., Eremenko, M., Liu, X., Dufour, G., Hoepfner, M., Cai, Z., von Clarmann, T.,
Or-5
phal, J., Chance, K., Spurr, R., and Flaud, J.-M.: Multi-spectral retrieval of lowermost tropo-spheric ozone combining IASI and GOME-2 satellite observations, in: Proceedings of ESA Advances in Atmospheric Science and Applications Conference, Bruges, Belgium, 2012. 7028
Dufour, A., Amodei, M., Ancellet, G., and Peuch, V.-H.: Observed and
mod-10
elled “chemical weather” during ESCOMPTE, Atmos. Res., 74, 161–89, doi:10.1016/j.atmosres.2004.04.013, 2005. 7030
Dufour, G., Eremenko, M., Orphal, J., and Flaud, J.-M.: IASI observations of seasonal and day-to-day variations of tropospheric ozone over three highly populated areas of China: Beijing, Shanghai, and Hong Kong, Atmos. Chem. Phys., 10, 3787–3801,
doi:10.5194/acp-10-3787-15
2010, 2010. 7028, 7033, 7036
Dufour, G., Eremenko, M., Griesfeller, A., Barret, B., LeFlochmo ¨en, E., Clerbaux, C., Hadji-Lazaro, J., Coheur, P.-F., and Hurtmans, D.: Validation of three different scientific ozone products retrieved from IASI spectra using ozonesondes, Atmos. Meas. Tech., 5, 611–630, doi:10.5194/amt-5-611-2012, 2012. 7028, 7032, 7034, 7038
20
Eremenko, M., Dufour, G., Foret, G., Keim, C., Orphal, J., Beekmann, M., Bergametti, G., and Flaud, J.-M.: Tropospheric ozone distributions over Europe during the heat wave in July 2007 observed from infrared nadir spectra recorded by IASI, Geophys. Res. Lett., 35, L18805, doi:10.1029/2008GL034803, 2008. 7028, 7031, 7032, 7033, 7034, 7035
Horowitz, L. W.: Past, present, and future concentrations of tropospheric ozone and aerosols:
25
methodology, ozone evaluation, and sensitivity to aerosol wet removal, J. Geophys. Res., 111, D22211, doi:10.1029/2005JD006937, 2006. 7027
Kulawik, S. S., Osterman, G., Jones, D. B. A., and Bowman, K. W.: Calculation of altitude-dependent Tikhonov constraints for TES nadir retrievals, IEEE T. Geosci. Remote, 44, 1334– 1342, 2006. 7032
30
west-AMTD
5, 7025–7065, 2012LT ozone from IASI-NG
P. Sellitto et al.
Title Page
Abstract Introduction
Conclusions References
Tables Figures
◭ ◮
◭ ◮
Back Close
Full Screen / Esc
Printer-friendly Version Interactive Discussion
Discussion
P
a
per
|
Dis
cussion
P
a
per
|
Discussion
P
a
per
|
Discussio
n
P
a
per
|
ern United States in spring, J. Geophys. Res., 117, D00V07, doi:10.1029/2011JD016961, 2012. 7028
Liu, X., Bhartia, P. K., Chance, K., Spurr, R. J. D., and Kurosu, T. P.: Ozone profile retrievals from the Ozone Monitoring Instrument, Atmos. Chem. Phys., 10, 2521–2537, doi:10.5194/acp-10-2521-2010, 2010. 7028
5
Martin, V. R.: Satellite remote sensing of surface air quality, Atmos. Environ., 42, 7823–7843, doi:10.1016/j.atmosenv.2008.07.018, 2008. 7028
McPeters, R. D., Labow, G. J., and Logan, J. A.: Ozone climatological profiles for satellite re-trieval algorithms, J. Geophys. Res., 112, D05308 doi:10.1029/2002JD002919, 2007. 7032 Monks, P., Granier, C., Fuzzi, S., Stohl, A., Williams, M., Akimoto, H., Amann, M.,
Bak-10
lanov, A., Baltensperger, U., Bey, I., Blake, N., Blake, R., Carslaw, K., Cooper, O., Den-tener, F., Fowler, D., Fragkou, E., Frost, G., Generoso, S., Ginoux, P., Grewe, V., Guen-ther, A., Hansson, H., Henne, S., Hjorth, J., Hofzumahaus, A., Huntrieser, H., Isaksen, I., Jenkin, M., Kaiser, J., Kanakidou, M., Klimont, Z., Kulmala, M., Laj, P., Lawrence, M., Lee, J., Liousse, C., Maione, M., McFiggans, G., Metzger, A., Mieville, A.,
Moussiopou-15
los, N., Orlando, J., O’Dowd, C., Palmer, P., Parrish, D., Petzold, A., Platt, U., P ¨oschl, U., Pr ´ev ˆot, A., Reeves, C., Reimann, S., Rudich, Y., Sellegri, K., Steinbrecher, R., Simpson, D., ten Brink, H., Theloke, J., van der Werf, G., Vautard, R., Vestreng, V., Vlachokostas, C., and von Glasow, R.: Atmospheric composition change – global and regional air quality, Atmos. Environ., 43, 5268–5350, doi:10.1016/j.atmosenv.2009.08.021, 2009. 7027
20
Ran, L., Zhao, C. S., Geng, F. H., Tie, X., Tang, X., Peng, L., Zhou, G., Yu, Q., Xu, J., and Guenther, A.: Ozone photochemical production in urban Shanghai, China: analysis based on ground level observations, J. Geophys. Res., 114, D15301, doi:10.1029/2008JD010752, 2009. 7028
Rodgers, C. D.: Characterization and error analysis of profiles retrieved from remote sounding
25
instruments, J. Geophys. Res., 95, 5587–5595, 1990. 7033
Rodgers, C. D.: Inverse Methods for Atmospheric Sounding: Theory and Practice, World Sci-entific Publishing Company, London, UK, 2000. 7033, 7036
Sch ¨ar, C. and Jendritzky, G.: Climate change: hot news from summer 2003, Nature, 432, 559– 560, doi:10.1038/432559a, 2004. 7028
30
John-AMTD
5, 7025–7065, 2012LT ozone from IASI-NG
P. Sellitto et al.
Title Page
Abstract Introduction
Conclusions References
Tables Figures
◭ ◮
◭ ◮
Back Close
Full Screen / Esc
Printer-friendly Version Interactive Discussion
Discussion
P
a
per
|
Dis
cussion
P
a
per
|
Discussion
P
a
per
|
Discussio
n
P
a
per
|
son, B. J., Oltmans, S. J., V ¨omel, H., Allaart, M., Kelder, H., Newchurch, M., Godin-Beekmann, S., Ancellet, G., Claude, H., Andersen, S. B., Kyr ¨o, E., Parrondos, M., Yela, M., Zablocki, G., Moore, D., Dier, H., von der Gathen, P., Viatte, P., St ¨ubi, R., Calpini, B., Skrivankova, P., Dorokhov, V., de Backer, H., Schmidlin, F. J., Coetzee, G., Fujiwara, M., Thouret, V., Posny, F., Morris, G., Merrill, J., Leong, C. P., Koenig-Langlo, G., and Joseph, E.:
5
A trajectory-based estimate of the tropospheric ozone column using the residual method, J. Geophys. Res., 112, D24S49, doi:10.1029/2007JD008773, 2007. 7028
Sellitto, P., Del Frate, F., Solimini, D., and Casadio, S.: Tropospheric ozone column retrieval from ESA-Envisat SCIAMACHY nadir UV/VIS radiance measurements by means of a neural net-work algorithm, IEEE T. Geosci. Remote, 50, 998–1011, doi:10.1109/TGRS.2011.2163198,
10
2012a. 7028
Sellitto, P., Noia, A. D., Frate, F. D., Burini, A., Casadio, S., and Solimini, D.: On the role of visible radiation in ozone profile retrieval from nadir UV/VIS satellite measurements: an experiment with neural network algorithms inverting SCIAMACHY data, J. Quant. Spectrosc. Ra., 113, 1429–1436, doi:10.1016/j.jqsrt.2012.04.007, 2012b. 7028
15
Shindell, D. T., Faluvegi, G., Koch, D. M., Schmidt, G. A., Unger, N., and Bauer, S. E.: Improved attribution of climate forcing to emissions, Science, 326, 716–718, doi:10.1126/science.1174760, 2009. 7027
Steck, T. and von Clarmann, T.: Constrained profile retrieval applied to the observation mode of the Michelson interferometer for passive atmospheric sounding, Appl. Optics, 40, 3559–
20
3571, 2000. 7034
Stiller, G. P., von Clarmann, T., Funke, B., Glatthor, N., Hase, F., H ¨opfner, M., and Linden, A.: Sensitivity of trace gas abundances retrievals from infrared limb emission spectra to simpli-fying approximations in radiative transfer modelling, J. Quant. Spectrosc. Ra., 72, 249–280, doi:10.1016/S0022-4073(01)00123-6, 2002. 7031
25
Vautard, R., Honore, C., Beekmann, M., and Rouil, L.: Simulation of ozone during the August 2003 heat wave and emission control scenarios, Atmos. Environ., 39, 3291–3303, 2005. 7028
Wilson, R. C., Fleming, Z. L., Monks, P. S., Clain, G., Henne, S., Konovalov, I. B., Szopa, S., and Menut, L.: Have primary emission reduction measures reduced ozone across Europe?
30
AMTD
5, 7025–7065, 2012LT ozone from IASI-NG
P. Sellitto et al.
Title Page
Abstract Introduction
Conclusions References
Tables Figures
◭ ◮
◭ ◮
Back Close
Full Screen / Esc
Printer-friendly Version Interactive Discussion
Discussion
P
a
per
|
Dis
cussion
P
a
per
|
Discussion
P
a
per
|
Discussio
n
P
a
per
|
WMO: Scientific assessment of ozone depletion: 2002, Executive Summary, Tech. Rep. 47, World Meteorological Organization, Geneva, Switzerland, 2002. 7027
Worden, H. M., Logan, J. A., Worden, J. R., Beer, R., Bowman, K., Clough, S. A., Eldering, A., Fisher, B. M., Gunson, M. R., Herman, R. L., Kulawik, S. S., Lampel, M. C., Luo, M., Magret-skaia, I. A., Osterman, G. B., and Shephard, M. W.: Comparisons of Tropospheric Emission
5
Spectrometer (TES) ozone profiles to ozonesondes: methods and initial results, J. Geophys. Res., 112, D03309, doi:10.1029/2006JD007258, 2007a. 7028
Worden, J., Liu, X., Bowman, K., Chance, K., Beer, R., Eldering, A., Gunson, M., and Wor-den, H.: Improved tropospheric ozone profile retrievals using OMI and TES radiances, Geo-phys. Res. Lett., 34, L01809, doi:10.1029/2006GL027806, 2007b. 7028
10