Crystal structure of
fl
uorite-related
Ln
3
SbO
7
(
Ln
¼
La
–
Dy) ceramics
studied by synchrotron X-ray diffraction and Raman scattering
K.P.F. Siqueira
a, R.M. Borges
a, E. Granado
b, L.M. Malard
c, A.M. de Paula
c,
R.L. Moreira
c, E.M. Bittar
d, A. Dias
a,na
Departamento de Química, Universidade Federal de Ouro Preto, Campus Morro do Cruzeiro, ICEB II, Ouro Preto—MG 35400-000, Brazil
b
Instituto de Física“Gleb Wataghin”, UNICAMP, Campinas—SP 13083-970, Brazil
cDepartamento de Física, ICEx, Universidade Federal de Minas Gerais, C.P. 702, Belo Horizonte
—MG 30123-970, Brazil
dLaboratório Nacional de Luz Síncrotron, C.P. 6192, 13083-970 Campinas, SP, Brazil
a r t i c l e
i n f o
Article history: Received 14 March 2013 Received in revised form 26 April 2013
Accepted 3 May 2013 Available online 13 May 2013
Keywords:
Synchrotron X-ray diffraction SHG
Lanthanide Antimonates Raman scattering
a b s t r a c t
Ln3SbO7(Ln¼La, Pr, Nd, Sm, Eu, Gd, Tb and Dy) ceramics were synthesized by solid-state reaction in optimized conditions of temperature and time to yield single-phase ceramics. The crystal structures of the obtained ceramics were investigated by synchrotron X-ray diffraction, second harmonic generation (SHG) and Raman scattering. All samples exhibitedfluorite-type orthorhombic structures with different oxygen arrangements as a function of the ionic radius of the lanthanide metal. For ceramics with the largest ionic radii (La–Nd), the ceramics crystallized into theCmcmspace group, while the ceramics with
intermediate and smallest ionic radii (Sm–Dy) exhibited a different crystal structure belonging to the
same space group, described under theCcmmsetting. The results from SHG and Raman scattering confirmed these settings and ruled out any possibility for the non-centrosymmetricC2221space group
describing the structure of the small ionic radii ceramics, solving a recent controversy in the literature. Besides, the Raman modes for all samples are reported for thefirst time, showing characteristic features for each group of samples.
&2013 Elsevier Inc. All rights reserved.
1. Introduction
Ceramics of general formulaLn3MO7(whereLn3+
is a lantha-nide element andMis Os5+, Re5+, Ru5+, Mo5+, Ir5+, Sb5+, Nb5+or Ta5+) have been intensively studied because of their interesting photocatalytic activity[1], dielectric[2,3], and magnetic properties
[4–7]. These materials present an ordered, defectivefluorite-type
structure, which was described by Hinatsu et al.[6], as follows: The unit cell for oxides has the general formulaM4þ4 O8, in which the four tetravalent metal ions are replaced by three trivalent ions (Ln) and one pentavalent ion (M), thus creating one oxygen vacancy per fluorite cell. Owing to the significant differences between the ionic radii of the Ln3+
and M5+
, cation ordering occurs on the metal sites and the oxide-vacancy orders on the anion sites.
A variety of crystal structures has been proposed for the Ln3MO7ceramics, as a direct consequence of the great number of chemical combinations that is possible between the lanthanide
ions and the elementM(Ta, Nb, Sb, Mo)[1–7]. Also, the processing conditions can contribute to produce different crystallographic structures; for example, several polymorphic modifications can be achieved through temperature changes[5,6,8,9]. Since the physical properties are strictly dependent on the crystalline phase, it is important to determine the correct crystal structure for the produced ceramics before designing any possible application. Thefirst structure determination for these ceramics was reported by Rossell[10], who proposed theCmcmspace group to describe the La3NbO7 crystal phase. However, thePnmaspace group was later employed by Kahn-Harari et al.[11]to describe the crystal structure of this compound. In the literature, the Cmcm space group has been often used to describe the crystal structure of several members of the Ln3MO7 family: Ln3RuO7 (Ln¼La–Eu)
[6,12–15], Ln3ReO7 (Ln¼Pr, Nd, Sm–Tb)[16,17],Ln3OsO7(Ln¼Pr,
Nd, Sm–Gd)[18–20],Ln3TaO7(Ln¼La–Nd)[5,21],Ln3IrO7(Ln¼Pr, Nd, Sm, Eu) [9,22,23], Pr3NbO7 [21] and Ln3SbO7 (Ln¼La–Nd) ceramics[6,7,21]. For Ln3TaO7 (Ln¼Y, Sm–Ho)[5] and Ln3MoO7 (Ln¼La–Nd, Sm, Eu) ceramics[24,25], theC2221andP212121space groups were previously described, respectively. Besides, theFm3m space group was found forLn3TaO7(Ln¼Ho–Lu)[5,6] andLn3NbO7 (Ln¼Dy–Lu) ceramics [4,6]. The C2221 space group was also employed to describe the structure ofLn3NbO7with intermediate Contents lists available atSciVerse ScienceDirect
journal homepage:www.elsevier.com/locate/jssc
Journal of Solid State Chemistry
0022-4596/$ - see front matter&2013 Elsevier Inc. All rights reserved. http://dx.doi.org/10.1016/j.jssc.2013.05.001
nCorresponding author.
E-mail addresses:[email protected],
ionic radii Ln (Ln¼Sm–Tb), while the Pnma space group was proposed for the larger ionic radii ceramics (Ln¼La, Pr, Nd) [4]—in agreement with previous work by Kahn-Harari et al.[11]. Among allLn3MO7 ceramics reported in the literature, a few studies have been carried out forM¼Sb as pentavalent cation. In a pioneer work in the seventies, a series ofLn3SbO7ceramics with Ln¼Nd, Sm–Yb and Y were reported by Nath as belonging the pyrochlore (Fd3m) structure[26]. Later on, Vente et al. proposed a fluorite relatedCmcmgroup for Pr3SbO7[21]. Then, Fennell et al. [27]proposed theC2221space group for Dy3SbO7and Ho3SbO7. Recently, Hinatsu et al.[7]determined theCmcmspace group for Ln¼La, Pr, Nd and C2221 for Ln¼Nd–Lu. However, Fu and Ijdo reported a critical, detailed study for all these structures and presented an alternative setting of theCmcmspace group, namely Ccmm, instead of C2221, for Ln3SbO7 ceramics containing inter-mediate-sized lanthanides[28]. It can be concluded from this brief review that the proposed crystalline structures ofLn3SbO7 cera-mics are still controversial. Concerning the conflicting structures reported in the literature, the description within theCmcmspace group has also been proposed for other Ln3MO7 ceramics by neutron diffraction[12,13,21], X-ray powder diffraction[4–7,9,17,
18,28], as well as by X-ray single crystal diffraction[29]. In the case
of theC2221space group, only studies using X-ray powder diffra-ction were reported[7].
In this context, the present paper intends to contribute to the elucidation of the possible crystal structure ofLn3SbO7 ceramics (Ln¼La–Dy, exception of Ce and Pm), by reporting on our results of Raman scattering, second harmonic generation and synchrotron X-ray powder diffraction (SXRD). A similar methodology was previously applied by our group to solve structural conflicts for many materials[30–33].
2. Experimental
Ln3SbO7ceramics were synthesized by usingLn2O3(Ln¼La, Nd, Sm, Eu, Gd, and Dy; 499.9% Sigma-Aldrich), Pr6O11, Tb4O7
(499.9% Sigma-Aldrich) and Sb2O5 (499.9% Sigma-Aldrich) as
starting materials through solid-state reaction. All lanthanides used in this work were heat treated at 9001C overnight before
being employed for the synthesis. Stoichiometric amounts were weighed and mixed with a mortar and pestle. For the synthesis of La3SbO7and Dy3SbO7samples, an excess amount of about 200% weight of antimony oxide was added to ensure formation of Ln3SbO7ceramics. For the synthesis of these ceramics, the con-ventional solid-state processing was employed in temperatures ranging from 13001C to 15001C, and times up to 15 h. After
synthesis, diluted nitric acid (0.1 M) was employed to remove unreacted Gd2O3and Tb4O7, which could be present in Gd3SbO7 and Tb3SbO7ceramics, respectively. Then, the resulting products were washed in distilled water followed by drying at 801C.
SXRD measurements were taken in the superconducting wiggler XDS beamline of the Brazilian Synchrotron Laboratory, LNLS, withλ¼0.65319 Å. The optical path of the beam upstream the sample position included a water-cooled Pt-coated vertically collimating mirror, a LN2-cooled double Si(1 1 1) crystal mono-chromator with sagittal focusing and a Pt-coated vertically focusing mirror, yielding a highly monochromatic beam with dimensions of 2.0(H)0.17(V) mm2full width at half maximum (FWHM) at the sample position. The samples were mounted in flat-planeθ/2θgeometry with a spinning axis perpendicular to
the sample surface to optimize grain statistics. The diffraction profiles were taken in the vertical scattering plane using a 0.3 mm slit located 0.80 m away from the sample followed by a highly-oriented pyrolitic graphite analyzer and a high-throughput LaBr3 scintillator detector in the 2θ arm. This
mounting resulted in high-resolution and low-background pow-der diffraction profiles, with typical Bragg peak widths of 0.021 FWHM at low angles, and maximum peak heights of 105 counts against a background level of 102 counts. The measurements were performed in the range 4–9012θ, covering 2000 Bragg reflections, with a step size of 0.00812θ. Rietveld
refinements were performed using the GSAS+EXPGUI program
[34].
Second harmonic generation (SHG) measurements were also performed. SHG is only present in structures lacking inversion symmetry[35], hence this technique can be used to determine the presence of this symmetry operation. We have used a 140 fs Ti– Sapphire oscillator (Coherent Chameleon) with 80 MHz repetition tuned at 800 nm which is directed to a modified Olympus FV300 scanning laser microscope. The backscattered signal is then directed to a dichroic mirror and a thin band pass centered at second harmonic wavelength (400 nm) to completely remove the laser scattered light where the SH signal is detect by a photo-multiplier tube. We have used an alpha-quartz crystal with the laser incidence parallel to the c-axis as a reference for this measurement. The second harmonic emission from alpha-quartz is clearly detectable, although this material posses weak second order susceptibility (0.3 pm/V) compared to other materials[35].
Raman spectra of the as-synthesized samples were collected in backscattering configuration by using two different instruments. An Horiba LABRAM-HR spectrometer was used with the 632.8 nm line of a helium–neon laser as excitation source (effective power of 6 mW at the sample's surface), diffraction gratings of 600 and 1800 grooves/mm, Peltier-cooled charge coupled device (CCD) detector, confocal Olympus microscope (100objective), and experimental resolution typically 1 cm−1 for 10 accumulations of 30 s. Appro-priate interferencefilter for rejecting laser plasma lines, and edge filters for stray light rejection were used. Also, a Horiba T64000 spectrometer (80objective) equipped with the 488 nm line of an Ar+ laser (4 mW at the sample
's surface) and a LN2-cooled CCD detector was used. In this case, the spectral resolution was better than 2 cm−1and the accumulation were equally 10 collections of 30 s. All resulting spectra were corrected by Bose–Einstein thermal factor[36].
3. Results and discussion
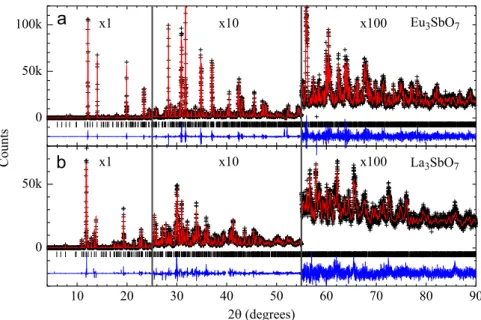
Representative SXRD profiles ofLn3SbO7forLn¼La and Eu are given inFig. 1(b) and (a), respectively. For the large-size lantha-nides (Ln¼La and Pr), a good agreement between observed and calculated diffraction data was obtained using a single orthorhom-bic phase within the Cmcm space group (see Fig. 1(b)), such as reported previously for these ceramics [10]. A relatively large deviation of the unit cell parameters (a,b,c) with respect to the idealized (2ac,√2ac,√2ac) cell derived from the cubic fluorite
structure (ac5.4 Å) was noticed. An alternative structural refi ne-ment forLn¼La under thePnmaspace group with a distinct choice of axes (a√2ac,b2ac,c√2ac), such as reported for La3NbO7[11]
was performed, also yielding a good fit to our diffraction data (χ2¼17.0 and 17.6 for refinements under Cmcm andPnmaspace groups, respectively). However, the extra Bragg reflections expected forPnmaand forbidden by the higher symmetryCmcm space group could not observed, indicating Cmcmis indeed the most suitable space group forLn3SbO7withLn¼La and Pr.
For medium size lanthanides,Ln¼Sm–Dy, another crystalline phase with a much smaller orthorhombic distortion is observed
(see Fig. 1(a) for Ln¼Eu). Following previous studies, we
attempted structural refinements forLn¼Eu using two possible space groups, C2221 [7,27] and Ccmm [28], both with (a2ac,
be found in Ref. [28]. The refinements under both space groups yielded equally good fits to the experimental data and nearly identical residuals [Rwp¼9.94% and χ2¼6.80 for Ccmm and Rwp¼9.89% and χ2¼6.73 for C2221] supporting the proposition by Fu and Ijdo that the more symmetricCcmmspace group is most likely the correct one for the medium size lanthanides[28]. This conclusion is further supported by the absence of SHG signal (which indicates the existence of inversion symmetry center in the crystal structure) and by our Raman scattering (see discussion below). The structure of all the remaining samples with medium sized lanthanides was also successfully refined under the Ccmm space group. Although theCcmm space group for Ln3SbO7 with medium-sized lanthanides is the same as theCmcmused for the large sized lanthanides, the different settings were chosen to preserve the metrics of the unit cell in the complete series, with the longest orthorhombic axis alonga(a2ac,b√2ac,c√2ac)[28].
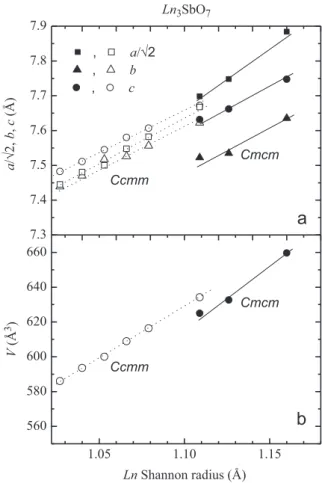
We should mention that, despite presenting the same space group, the crystal structures for the large and medium/small lanthanides are distinct, with the SbO6octahedra being rotated around the long [1 0 0] direction for theCmcmsetting and [0 1 0] for theCcmm setting[28], resulting in largely different diffrac-tion profiles (see Fig. 1(a) and (b)). Finally, at the boundary between those structures, namely forLn¼Nd, both phases were identified in the diffraction profile and successfully refined, with weight fractions of 59% and 41% for the phases described under the Cmcm and Ccmm settings, respectively. Tables 1 and 2 present the refined structural parameters for Ln¼La, Nd, Sm, Eu and Gd, after Rietveld analyses of SXRD data. The samples withLn¼Pr, Tb and Dy were also investigated, but the presence of unidentified minor impurities (other than unreacted oxides) prevented a reliable refinement of atomic positions and Debye– Waller parameters. For such samples, only the lattice parameters were extracted.Fig. 2shows the evolution of the refined lattice parameters ofLn3SbO7as a function ofLn3+Shannon radii[38], summarizing the mainfindings of our SXRD analysis. The unit cell volumes show a discontinuous change from the phase described under theCmcmsetting to the one underCcmm.
Vibrational studies are currently employed by our research group to investigate the behavior of the phonon modes for many electroceramic systems. Raman scattering besides theoretical factor-group analysis are powerful tools to obtain a complete set
of reliable phonon modes, which in turn can help one determining the correct crystal structures. In this work, Raman scattering was used to confirm the results from SXRD and SHG techniques, aiming to show the relationship between crystal structure and vibrational modes, which allowed us to contribute to the debate on the crystalline structure of this class of ceramics. Raman spectra ofLn3SbO7were collected at room-temperature, for all the produ-ced ceramics. The results are displayed inFig. 3(two boards) for decreasing ionic radius (La–Dy). Because of strong electronic transitions that appear under certain conditions different laser lines were used. Thefinal spectra showed inFig. 3represent the
10
20
30
40
50
60
70
80
90
0
50k
0
50k
100k
2
θ
(degrees)
Counts
x100
x100
x10
x10
x1
La
3SbO
7Eu
3SbO
7x1
Fig. 1.SXRD patterns ofLn3SbO7for (a)Ln¼Eu and (b)Ln¼La. The cross symbols and solid lines represent observed and calculated patterns, respectively. The difference curves are shown at the bottom of eachfigure. Vertical bars indicate the expected Bragg peak positions according to the crystal structure models described in the text and refined lattice parameters given inFig. 2.
Table 1
Refined structural parameters forLn3SbO7ceramics (Ln¼La and Nd) with space groupCmcm. RwpandRprefer to background-subtracted values (Ref.[34]).
La3SbO7 Nd3SbO7phase I (59% w.f.)
a(Å) 11.1495(3) 10.8870(2)
b(Å) 7.6356(2) 7.52218(11)
c(Å) 7.7477(2) 7.63180(11)
Ln1 (0,0,0)
B(Å2) 0.62(3) 0.73(3)
Ln2 (x,y,1/4)
X 0.22727(9) 0.22858(8)
Y 0.29716(12) 0.29188(10)
B(Å2) 0.47(2) 0.47(2)
Sb (0,1/2,0)
B(Å2) 0.51(3) 0.59(3)
O1 (x,y,z)
X 0.1283(7) 0.1270(8)
Y 0.3157(10) 0.3155(9)
z −0.0348(10) −0.0326(9)
O2 (x,y,1/4)
x 0.1207(10) 0.1278(11)
y 0.0219(15) 0.0205(13)
O3 (0,y,1/4)
y 0.442(2) 0.428(2)
B-oxygen (Å2) 0.78(12) 0.69(12)
Rwp/Rp(%) 18.2/12.9 11.0/8.4
best obtained results using an excitation blue line (488 nm) for Gd, and a red line (632.8 nm) for La, Pr, Nd, Sm, Eu, Tb and Dy.
Aiming to understand and discuss the results from Raman scattering, group-theory calculations for the main structures related to Ln3SbO7 ceramics are now presented. Table 3 shows Wyckoff positions and phonons distribution at the Brillouin zone center in terms of the irreducible representations, according to the method developed by Rousseau et al.[37]for theLn3SbO7crystal structures within theCmcm,CcmmandC2221space groups. As it can be seen, 27 Raman-active modes are expected in theCmcm space group, as well as in its alternative Ccmm setting. The differences between the group-theory predictions for these two structures come from the different oxygen occupations. In the structure for large sizeLn, described by theCmcmsetting, oxygen atoms occupy 4c, 16h and 8g sites. However, in the Ccmm structure, there are four distinct oxygen ions: O(1) occupies a 16hsite, while the others O(2)–O(4) occupy 4csites. Thus, the site group method of Rousseau et al. [37] leads to the following distribution of the phonon modes at the Brillouin zone center: 8Ag+8B1g+5B2g+6B3g for Cmcm, and 8Ag+8B1g+4B2g+7B3g for
Ccmm. The other possibility for the crystalline structures of Ln3SbO7, as proposed by previous authors and not excluded by our X-ray diffraction analysis for medium sizedLn, would be the non-centrosymmetricC2221 space group. In this case, excluding the acoustic modes, 63 bands are expected in the Raman spectra for this structure (14A+18B1+16B2+15B3).
For all samples, a careful analysis was carried out byfitting the Raman experimental data with Lorentzian curves. The results are presented inFig. 4 for La3SbO7 and Eu3SbO7. This procedure revealed 23 modes for the La, and 24 Raman bands for the Eu ceramics, respectively. As a general trend, the phonon wavenumbers down-shifted, as a consequence of the decreasing tendency of the ionic radii (see also Fig. 3 for a
better visualization of this general trend and the discussion below). We cannot visualize all the 27 bands because some of them could occur at very low frequencies (below 70 cm−1) and others could be relatively weak to be discerned. As a whole, we could see a total of 25 Raman-active bands. These results are in agreement with the predictions for the Cmcm and Ccmm groups (Table 3). Also, the Raman patterns show thatLn3SbO7 ceramics do not show the large number of modes expected for the structure described by the C2221 space group, providing further evidence against a description of the crystal structure of these ceramics under this space group.
Although the materials described under the Cmcm and Ccmm settings exhibited an equal number of Raman-active modes, they present some peculiarities in their Raman pat-terns.Fig. 5shows two different regions of the spectra, where these peculiarities can be clearly seen. In Fig. 5(a) we can observe that the bands around 170 cm−1and 187 cm−1are well-defined for the La and Pr, up-shifting and overlapping for smaller lanthanides. This change of behavior begins exactly for the sample containing Nd, which presents a mixture of the two distinct orthorhombic phases (see above). Likewise, the bands around 440 cm−1can be considered as
fingerprint of the structure described under Ccmm, which presents a larger number of active modes in this region than the structure described underCmcm, as shown inFig. 5(b). Then, by analyz-ing the results from Raman scatteranalyz-ing, we can discern between these two orthorhombic structures. In this way, this method provides a powerful tool for determining the crystal structure Table 2
Refined structural parameters forLn3SbO7(Ln¼Nd, Sm, Eu and Gd) with space groupCcmm. RwpandRprefer to background-subtracted values (Ref.[34]).
Nd3SbO7phase II (41% w.f.)
Sm3SbO7 Eu3SbO7 Gd3SbO7
a(Å) 10.8436(2) 10.72269(11) 10.67411(10) 10.62843(7) b(Å) 7.62229(14) 7.55640(7) 7.52595(7) 7.51729(5) c(Å) 7.67228(13) 7.60704(7) 7.57999(7) 7.54486(5)
Ln1 (0,1/2,0)
B(Å2) 0.32(4) 0.49(2) 0.53(2) 0.49(3)
Ln2 (x,y,1/4)
X 0.23461(10) 0.23484(6) 0.23470(5) 0.23406(7) Y 0.2364(2) 0.23525(8) 0.23500(6) 0.23453(11) B(Å2) 0.35(3) 0.46(1) 0.41(1) 0.34(1)
Sb (0,0,0)
B(Å2) 0.43(5) 0.44(2) 0.32(2) 0.32(2)
O1 (x,y,z)
X 0.1332(13) 0.1254(6) 0.1243(5) 0.1232(9) Y 0.1893(15) 0.1934(8) 0.1934(7) 0.1967(12) Z −0.0264(12) −0.0269(7) −0.0280(7) −0.0349(12)
O2 (x,0,1/4)
X 0.054(2) 0.0551(12) 0.0651(11) 0.056(2) O3 (x,1/2,1/4)
X 0.121(3) 0.1212(12) 0.1271(10) 0.127(2) O4 (x,1/2,1/4)
X −0.126(3) −0.1296(13) −0.1336(10) −0.140(2) B-oxygen (Å2) 0.9(2) 0.52(8) 1.3(2) 0.6(2)
Rwp/Rp(%) 11.0/8.4 10.9/7.1 9.9/7.4 20.3/10.1
χ2 7.0 8.6 6.8 20.6
7.3
7.4
7.5
7.6
7.7
7.8
7.9
1.05
1.10
1.15
560
580
600
620
640
660
,
a
/
√
2
,
b
,
c
Cmcm
a
/
√
2,
b
,
c
(Å)
Ln
3SbO
7Ccmm
Ccmm
V
(Å
3
)
Ln
Shannon radius (Å)
Cmcm
of ternary oxides, along with XRD. Concerning the second phase that is present in samples with smaller ionic radius such as observed by XRD, no extra Raman band was observed, indicating that either this extra phase presents a high-symmetry structure with little or no Raman activity, or the separation between the phonon bands for these structures are significantly smaller than the corresponding band widths.
A final analysis of the Raman modes for all Ln3SbO7 ceramic samples could be accomplished after their adjustment by Lorentzian lines. Due to the proximity between the two structures assumed by the ceramics along the La–Dy series, we could correlate the behavior of the phonon modes, despite the structural change presented. It is clear from Figs. 3–5 that different tendencies can be verified for increasing ionic radii. For the majority of the modes, the wavenum-bers increased for decreasing ionic radii (Figs. 3–5), as expected[39]. This behavior is due to the phenomenon of lanthanide contraction, where the cell volume decreases in lanthanides with higher atomic numbers. Moreover, it was verified that the modes assumed distinct regimes between the two orthorhombic phases, which indicates that this phenomenon acts differently, as a function of the actual crystal structure (CcmmorCmcm).
4. Conclusions
Ln3SbO7(Ln¼La, Pr, Nd, Sm, Eu, Gd, Tb and Dy) ceramics were synthesized in optimized conditions of temperature and time. The produced ceramics were investigated by SXRD, SHG and Raman scattering. All the samples exhibited orthorhombic super-structures of the cubicfluorite-type, but with different arrange-ments as a function of the ionic radius of the lanthanide metal. La3SbO7 and Pr3SbO7 ceramics crystallized in a structure described by the space groupCmcm, while the other ceramics (Sm–Dy) exhibited a distinct crystal structure described under an alternative setting of the same space group, Ccmm. Nd3SbO7 presents roughly an equal mixture of these two phases. The
overall results allowed us to discuss on the controversies pointed out by the literature concerning the crystal structure of these ceramics. The setting for the space groupCcmm instead of the
100 200 300 400 500 600 700 800
Wavenumber (cm-1)
Sm
Nd
Pr
La
Raman Intensity
100 200 300 400 500 600 700 800
Gd
Eu
Raman Intensity
Dy
Tb
Wavenumber (cm-1)
Fig. 3.Room-temperature Raman spectra for allLn3SbO7ceramics. The sequence plotted reproduces the variation (decreasing tendency) in the ionic radius (a) La–Sm; (b) Eu–Dy.
Table 3
Factor-group analysis for crystal structures previously reported by the literature for theLn3SbO7ceramics.
Ion Wyckoff sites Symmetry Irreducible representations
Orthorhombic (Cmcm, #63) Ln+3(1) 4
a Cx
2h No Raman-active mode
Ln+3(2) 8
g Cxy
s 2Ag+2B1g+B2g+B3g Sb+5 4
b Cx
2h No Raman-active mode O−2(1) 4c
Cy
2h Ag+B1g+B3g
O−2(2) 16h C
1 3Ag+3B1g+3B2g+3B3g O−2(3) 8
g Cxy
s 2Ag+2B1g+B2g+B3g ΓRAMAN¼8Ag+8B1g+5B2g+6B3g
Orthorhombic (Ccmm, #63) Ln+3(1) 4
b Cx
2h No Raman-active mode
Ln+3(2) 8
g Cxys 2Ag+2B1 g+B2 g+B3 g Sb+5 4
a Cx2h No Raman-active mode O−2(1) 16
h C1 3Ag+3B1g+3B2g+3B3g O−2(2) 4
c Cy2h Ag+B1g+B3g O−2(3) 4
c Cy2h Ag+B1g+B3g O−2(4) 4
c Cy
2h Ag+B1g+B3g ΓRAMAN¼8Ag+8B1g+4B2g+7B3g
Orthorhombic (C2221, #20) Ln+3(1) 4b
Cy2 A+2B1+B2+2B3
Ln+3(2) 8c C
1 3A+3B1+3B2+3B3 Nb+5 4b
Cy
2 A+2B1+B2+2B3 O−2(1) 8
c C1 3A+3B1+3B2+3B3 O−2(2) 8
c C1 3A+3B1+3B2+3B3 O−2(3) 4
a Cx2 A+2B1+2B2+B3 O−2(4) 4
a Cx2 A+2B1+2B2+B3 O−2(5) 4
a Cx2 A+2B1+2B2+B3
less symmetrical space groupC2221is more appropriate for these ceramics, because of the absence of SHG signals and the large difference between the vibrational modes observed experimen-tally and those predicted by group-theory calculations for each space group. The results from Raman spectroscopy are in perfect agreement with theoretical calculations and corroborate the results from SXRD and SHG.
Acknowledgments
The authors acknowledge the financial support from CAPES, CNPq, FINEP and FAPEMIG. Special thanks to Dr. Cristiano Fantini Leite and Prof. Marcos A. Pimenta (UFMG) for their hospitality during Raman experiments with the T64000 equipment. LNLS is acknowledged for concession of beamtime.
80 120 160 200 240 280
280 320 360 400 440 480
480 560 640 720 800
La3SbO7
Raman Intensity
80 120 160 200 240
280 315 350 385 420
400 480 560 640 720 800
Eu3SbO7
Raman Intensity
Wavenumber (cm
-1)
Wavenumber (cm
-1)
Fig. 4.Micro-Raman spectra of the orthorhombic structures: (a) La3SbO7(Cmcmspace group), and (b) Eu3SbO7(Ccmmspace group). Experimental data are in closed squares, whereas thefitting curves are represented by red lines. Green lines represent the phonon modes adjusted by Lorentzian curves. The Raman spectra were divided in three regions for better visualization. (For interpretation of the references to color in thisfigure legend, the reader is referred to the web version of this article.)
150 165 180 195 210
Wavenumber (cm
-1)
Eu
Sm
Nd
Pr
La
Raman Intensity
400 440 480 520 560 600
Eu
Sm
Nd
Pr
La
Raman Intensity
Wavenumber (cm
-1)
Fig. 5.Raman spectra (zoom) for the samples containing La, Pr, Nd, Sm and Eu: (a) 150–210 cm
−1; (b) 400 –600 cm
−1. Peculiarities in the Raman patterns betweenCmcmand
References
[1] R. Abe, M. Higashi, Z.G. Zou, K. Sayama, Y. Abe, H. Arakawa, J. Phys. Chem. B 108 (2004) 811–814.
[2] L. Cai, J.C. Nino, J. Eur. Ceram. Soc. 27 (2007) 3971–3976. [3] L. Cai, J.C. Nino, J. Eur. Ceram. Soc. 30 (2010) 307–313.
[4] Y. Doi, Y. Harada, Y. Hinatsu, J. Solid State Chem. 182 (2009) 709–715. [5] M. Wakeshima, H. Nishimine, Y. Hinatsu, J. Phys. Condens. Matter 16 (2004)
4103–4120.
[6] M. Wakeshima, Y. Hinatsu, J. Solid State Chem. 183 (2010) 2681–2688. [7] Y. Hinatsu, H. Ebisawa, Y. Doi, J. Solid State Chem. 182 (2009) 1694–1699. [8] L. Cai, S. Denev, V. Gopalan, J.C. Nino, J. Am. Ceram. Soc. 93 (2010) 875–880. [9] Y. Hinatsu, Y. Doi, H. Nishimine, M. Wakeshima, M. Sato, J. Alloys Compd. 488
(2009) 541–545.
[10] H.J. Rossell, J. Solid State Chem. 27 (1979) 115–122.
[11] A. Kahn-Harari, L. Mazerolles, D. Michel, F. Robert, J. Solid State Chem. 116 (1995) 103–106.
[12] P. Khalifah, Q. Huang, J.W. Lynn, R.W. Erwin, R.J. Cava, Mater. Res. Bull. 35 (2000) 1–7.
[13] F. Wiss, N.P. Raju, A.S. Wills, J.E. Greedan, Int. J. Inorg. Mater. 2 (2000) 53–59. [14] D. Harada, Y. Hinatsu, Y. Ishii, J. Phys. Condens. Matter 13 (2001)
10825–10836.
[15] D. Harada, Y. Hinatsu, J. Solid State Chem. 158 (2001) 245–253. [16] R. Lam, T. Langet, J.E. Greedan, J. Solid State Chem. 171 (2002) 317–323. [17] Y. Hinatsu, M. Wakeshima, N. Kawabuchi, N. Taira, J. Alloys Compd.
374 (2004) 79–83.
[18] J.R. Plaisier, R.J. Drost, D.J.W. IJdo, J. Solid State Chem. 169 (2002) 189–198. [19] W.R. Gemmill, M.D. Smith, Y.A. Mozharivsky, G.J. Miller, H.-C. zur Loye, Inorg.
Chem. 44 (2005) 7047–7055.
[20] R. Lam, F. Wiss, J.E. Greedan, J. Solid State Chem. 167 (2002) 182–187. [21] J.F. Vente, R.B. Helmholdt, D.J.W. IJdo, J. Solid State Chem. 108 (1994) 18–23. [22] J.F. Vente, D.J.W. IJdo, Mater. Res. Bull. 26 (1991) 1255–1262.
[23] H. Nishimine, M. Wakeshima, Y. Hinatsu, J. Solid State Chem. 177 (2004) 739–744.
[24] J.E. Greedan, N.P. Raju, A. Wegner, P. Gougeon, J. Padiou, J. Solid State Chem. 129 (1997) 320–327.
[25] H. Nishimine, M. Wakeshima, Y. Hinatsu, J. Solid State Chem. 178 (2005) 1221–1229.
[26] D.K. Nath, Inorg. Chem. 9 (1970) 2714–2718.
[27] T. Fennell, S.T. Bramwell, M.A. Green, Can. J. Phys. 79 (2001) 1415–1419. [28] W.T. Fu, D.J.W. IJdo, J. Solid State Chem. 182 (2009) 2451–2455.
[29] W.R. Gemmill, M.D. Smith, H.-C. zur Loye, Inorg. Chem. 43 (2004) 4254–4261. [30] R.L. Moreira, R.P.S.M. Lobo, G. Subodh, M.T. Sebastian, F.M. Matinaga, A. Dias,
Chem. Mater. 19 (2007) 6548–6554.
[31] A. Dias, R.G. Sá, R.L. Moreira, J. Raman Spectrosc. 39 (2008) 1805–1810. [32] A. Dias, K.P.F. Siqueira, J. Raman Spectrosc. 41 (2010) 93–97.
[33] A. Dias, G. Subodh, M.T. Sebastian, R.L. Moreira, J. Raman Spectrosc. 41 (2010) 702–706.
[34] A.C. Larson,R.B. Von Dreele, Los Alamos National Laboratory Report LAUR 86-748, 2000;
B.H. Toby, J. Appl. Crystallogr. 34 (2001) 210–213.
[35] R.W. Boyd, Non Linear Optics, third ed., Academic Press, Burlington, MA, 2008.
[36] W. Hayes, R. Loudon, Scattering of Light by Crystals, Wiley, New York, 1978. [37] D.L. Rousseau, R.P. Bauman, S.P.S. Porto, J. Raman Spectrosc. 10 (1981)
253–290.