Synchrotron X-ray diffraction and Raman spectroscopy of
Ln
3
NbO
7
(
Ln
¼
La, Pr, Nd, Sm-Lu) ceramics obtained by molten-salt synthesis
K.P.F. Siqueira
a, J.C. Soares
a, E. Granado
b, E.M. Bittar
c, A.M. de Paula
d,
R.L. Moreira
d, A. Dias
a,na
Departamento de Química, Universidade Federal de Ouro Preto, Campus Morro do Cruzeiro, ICEB II, Ouro Preto-MG 35400-000, Brazil b
Instituto de Física“Gleb Wataghin”, UNICAMP, Campinas-SP 13083-970, Brazil cLaboratório Nacional de Luz Síncrotron, C.P. 6192, 13083-970 Campinas-SP, Brazil
dDepartamento de Física, ICEx, Universidade Federal de Minas Gerais, C.P. 702, Belo Horizonte-MG 30123-970, Brazil
a r t i c l e
i n f o
Article history:
Received 11 July 2013 Received in revised form 7 October 2013 Accepted 9 October 2013 Available online 23 October 2013
Keywords:
Synchrotron X-ray diffraction SHG
Rare-earth Niobates
Raman spectroscopy
a b s t r a c t
Ln3NbO7(Ln¼La, Pr, Nd, Sm, Eu, Gd, Tb, Dy, Ho, Er, Tm, Yb, and Lu) ceramics were obtained by molten-salt synthesis and their structures were systematically investigated by synchrotron X-ray diffraction (SXRD), second harmonic generation (SHG) and Raman spectroscopy. It was observed that ceramics with the largest ionic radii (La, Pr, Nd) crystallized into the Pmcnspace group, while the ceramics with intermediate ionic radii (Sm-Gd) exhibited a different crystal structure belonging to theCcmmspace group. For this last group of ceramics, this result was corroborated by SHG and Raman scattering and ruled out any possibility for the non-centrosymmetricC2221space group, solving a recent controversy
in the literature. Finally, according to SXRD, Tb-Lu containing samples exhibited an average defect fluorite structure (Fm3mspace group). Nonetheless, broad scattering at forbidden Bragg reflections indicates the presence of short-range domains with lower symmetry. Vibrational spectroscopy showed the presence of six Raman-active modes, inconsistent with the average cubicfluorite structure, and in line with the existence of lower-symmetry nano-domains immersed in the averagefluorite structure of these ceramics.
&2013 Elsevier Inc. All rights reserved.
1. Introduction
In the last years, lanthanide-based ceramics of general formula Ln3BO7(Lnis a trivalent lanthanide, while B can be Os, Re, Ru, Mo,
Ir, Sb, Nb or Ta pentavalent cations) have attracted much attention because of their interesting dielectric, catalytic and magnetic properties[1–15]. The structure is derived from theweberitegroup (A2B27), an anion-deficient fluorite-related superstructure, as
described by Nino et al. [4]. The crystal structure of Ln3NbO7
compounds is called weberite-type, since it is formed by an arrangement of BO6octahedra andLnO8cubes in layers. However,
theseweberite-like ceramics exhibit a different configuration with seven-fold coordination between the layers [4,7,9]. A variety of crystal structures has been proposed for theLn3BO7ceramics, as a
direct consequence of the great number of chemical combinations that is possible between the lanthanide ions and the element B (Ta, Nb, Sb, Mo) [1–15]. Also, the processing conditions can contribute to produce different crystallographic structures; for
example, several polymorphic modifications can be achieved through temperature changes[2,8,9,16].
Since the physical properties are strictly dependent on the crystalline phase, it is important to determine the correct crystal structure before designing any possible application for these ceramics. The pioneer work in this sense was published by Rossell [3], who proposed theCmcmspace group for the La3NbO7ceramic.
However, the Pnma space group was later employed by Kahn-Harari et al.[17]to describe this phase. In the literature, theCmcm space group is more commonly found to describe the crystal structure of theLn3BO7family:Ln3RuO7(Ln¼La–Eu)[6,7,11,18,19], Ln3ReO7(Ln¼Pr, Nd, Sm–Tb)[20,21],Ln3OsO7(Ln¼Pr, Nd, Sm–Gd) [18–20],Ln3TaO7(Ln¼La–Nd)[22–24],Ln3IrO7(Ln¼Pr, Nd, Sm, Eu) [16,25,26], Pr3NbO7 [27] and Ln3SbO7 (Ln¼La–Nd) ceramics
[11,15,27]. For Ln3TaO7 (Ln¼Y, Sm–Ho)[12]and Ln3MoO7 (Ln¼ La–Nd, Sm, Eu) ceramics [28,29], the C2221 and P212121 space
groups were previously described, respectively. Besides, theFm3m space group was found for Ln3TaO7 (Ln¼Ho–Lu) [11,12] and Ln3NbO7 (Ln¼Dy–Lu) ceramics [10,11]. The C2221 space group
was also employed to describe the structure of Ln3NbO7 with
intermediate ionic radii Ln (Ln¼Sm–Tb), while thePnma space group was proposed for ceramics with larger ionic radii (Ln¼La, Pr, Nd)[10]—in agreement with previous work by Kahn-Harari et al. Contents lists available atScienceDirect
journal homepage:www.elsevier.com/locate/jssc
Journal of Solid State Chemistry
0022-4596/$ - see front matter&2013 Elsevier Inc. All rights reserved. http://dx.doi.org/10.1016/j.jssc.2013.10.015
nCorresponding author. Tel.:
þ55 31 3559 1716.
[17]. Other few studies have been carried out for Sb as pentavalent cation. In a pioneer work in the seventies, a series of Ln3SbO7
ceramics withLn¼Nd, Sm–Yb, and Y were reported by Nath as belonging to the pyrochlore (Fd3m) structure[30]. Later on, Vente et al. proposed afluorite related Cmcm group for Pr3SbO7 [27].
Then, Fennel et al. [31] proposed the C2221 space group for
Dy3SbO7 and Ho3SbO7. Recently, Hinatsu et al. [15] determined
theCmcmspace group forLn¼La, Pr, Nd andC2221forLn¼Nd-Lu.
However, Fu and Ijdo reported a critical, detailed study for all these structures and presented an alternative setting of theCmcm space group, namelyCcmm, instead ofC2221, forLn3SbO7ceramics
containing intermediate-sized lanthanides[32].
In this paper, we report the molten-salt synthesis ofLn3NbO7
ceramics (exception for Ce and Pm) in lower temperatures if compared with those commonly reported in the literature by using conventional solid-state reactions. Following, their crystal structures were deeply investigated by using SXRD, SHG and Raman spectroscopy. In a previous paper, Ln3SbO7 ceramics
(Ln¼La–Dy) were studied by these techniques [33] and their structures determined. In view of that, the same methodology was applied for our Ln3NbO7 ceramics. In the present literature,
only one paper by Kovyazina et al.[34]reports the Raman spectra of La, Nd and Gd-containing ceramics. These authors emphasize the difficulties to obtain reliable data from Raman scattering for these materials because of the strong luminescence that could occur for some lanthanides. Thus, the present paper shows our efforts towards the determination of the crystal structures of Ln3NbO7ceramics synthesized through molten-salt processing by
using three powerful techniques, namely SXRD, Raman scattering and SHG.
2. Experimental
Ln3NbO7materials were synthesized by molten-salt processing
using Ln2O3(Ln¼La, Nd, Sm, Eu, Gd, Dy, Ho, Er, Tm, Yb, Lu,499%
Sigma-Aldrich), Tb4O7 (499.9% Sigma-Aldrich), Pr6O11(499.9%
Sigma-Aldrich), and Nb2O5 (499.9% Sigma-Aldrich) as starting
materials. Stoichiometric amounts of the reactants were mixed and ground thoroughly. An excess amount of 10% weight of lanthanide oxide was added in all mixtures to avoid the formation of LnNbO4 compounds. The mixed powders were calcined in a
molten-saltflux of NaCl (Aldrich) at 11001C for times of 8 h (La, Pr, Nd, Sm, Eu, Gd, Ho, Er, and Lu), 16 h (Tb and Tm), and 24 h (Yb) with intermediate regrinding. Dy3NbO7 was the only one of its
kind ceramic produced at 13001C, for 8 h. After synthesis, the resulting products were washed in hot distilled water and diluted nitric acid (0.1 M) to dissolve and remove the residual NaCl and lanthanide oxides, followed by drying at 801C.
High-resolution synchrotron X-ray diffraction (SXRD) measure-ments were taken in the X-ray diffraction and spectroscopy (XDS) beamline of the Brazilian Synchrotron Laboratory, LNLS, in flat plane geometry, at room temperature, with λ¼0.65319 Å. The measurements were performed in the 2θrange of 4–501(Ln¼Nd, Sm, Gd, Dy, and Yb) or 4–901(Ln¼La and Tm), with a step size of 0.0081. Further details of the experimental setup are given in a previous work[33]. Rietveld refinements were performed using the suite GSASþEXPGUI[35]. Unidentified impurity phases were detected for all investigated samples, with peak intensities less than5% of the main reflections, except for the Dy3NbO7sample, where the impurity peaks are as intense as 20% of the main reflections. Due to the high angular resolution of our experimental setup, the peak overlap between the impurity and main phase reflections are minimized, leading to reliable refined structural parameters for the main phases. ForLn¼Gd–Yb, asymmetries or shoulders at the lower-angle side of the Bragg peaks were
observed, which could be satisfactorily modeled by a second minority crystalline phase with the same space group of the main phase and slightly larger unit cell volume. Although the atomic occupations and positions could not be reliably refined for this minority phase, we suggest that it is a metastable state with slightly different stoichiometry and/or degree of Ln/Nb antisite disorder with respect to the main phase.
Second harmonic generation (SHG) measurements were also performed. SHG is only present in structures lacking inversion symmetry[36], hence this technique can be used to determine the presence of this symmetry operation. We have used a 140 fs Ti-Sapphire oscillator (Coherent Chameleon) with 80 MHz repeti-tion tuned at 800 nm which is directed to a modified Olympus FV300 scanning laser microscope. The backscattered signal is then directed to a dichroic mirror and a thin band pass centered at second harmonic wavelength (400 nm) to completely remove the laser scattered light where the SHG signal is detected by a photomultiplier tube. We have used an alpha-quartz crystal with the laser incidence paralell to thec-axis as a reference for this measurement. The second harmonic emission from alpha-quartz is clearly detectable, although this material posses weak second order susceptibility (0.3 pm/V) compared to other materials[36].
Raman spectra of as-synthesized samples were collected in back-scattering configuration by using three different equipments. The first one was a triple-monochromator Jobin-Yvon T64000 spectrometer with an Olympus confocal microscope (80 objec-tive), exciting lines of 488 and 514.5 nm of an Arþ laser (effective powers from 10 to 50 mW at the sample's surface), and a liquid-N2-cooled charge coupled device (CCD) detector. The frequency
resolution was better than 2 cm 1 and the accumulation times
were typically 10 collections of 30 s. Also, a Dilor XY spectrometer (Olympus confocal microscope, 50objective) equipped with the 568.2 nm line of a Krþ
laser (1 mW at the sample's surface), 600 grooves/mm diffraction gratings and a liquid-N2-cooled charge
coupled device (CCD) detector. The spectral resolution was better than 2 cm 1 and the accumulation times were typically 10
collections of 40 s. Finally, an Horiba/Jobin-Yvon LABRAM-HR spectrometer was used with the 632.8 nm line of a helium–neon laser (effective power of 6 mW at the sample's surface) as excita-tion source, diffracexcita-tion gratings of 600 and 1800 grooves/mm, Peltier-cooled CCD detector, confocal Olympus microscope (100 objective), and experimental resolution of typically 1 cm 1for 10
accumulations of 30 s. All experimental spectra were corrected by the Bose–Einstein thermal factor[37].
3. Results and discussion
SXRD experiments were performed forLn3NbO7with Ln¼La,
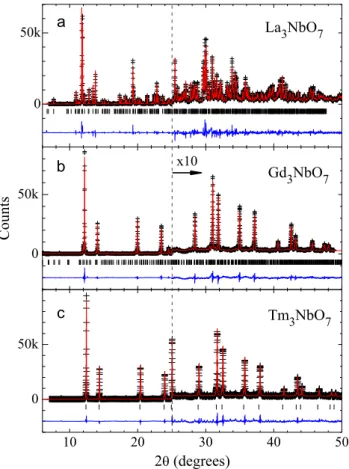
Nd, Sm, Gd, Dy, Tm, and Yb.Fig. 1(a–c) show SXRD profiles for Ln¼La, Gd, and Tm, respectively, which reveal all the representa-tive crystalline phases observed in this series at room temperature. The refined structural data forLn¼Nd, Sm, Dy, and Yb are given as Supplementary materials(Tables 1–4). For the largest lanthanides, Ln¼La and Nd, the structure was successfully refined under the orthorhombicPmcnspace group, which is an alternative setting of thePnma space group, in line with previous reports [10,17,38]. This structure is less symmetrical than that of La3SbO7withCmcm
space group, as revealed by the observation of a number of weak reflections forbidden for aC lattice. The refined structural para-meters forLn¼La are given inTable 1. A noteworthy difference between the structures ofLn3NbO7 and Ln3SbO7 for Ln¼La–Nd
asymmetric bonding, leading in many cases to ferroelectricity in Nb-based compounds.
For medium-sized lanthanides, Ln¼Sm and Gd, the crystal structure was successfully refined under theCcmmspace group, similar toLn3SbO7(Ln¼Sm-Gd)[33]. The less symmetrical space
groupC2221, employed in Ref.[10]for the same compounds, was
also tested. Nonetheless, the goodness offitχ2andfitting residuals Rwpare nearly identical for refinements under both space groups.
A direct evidence against the space groupC2221is the absence,
within our sensitivity (0.05% of the most intense Bragg peak), of the extra reflection (0 2 1) at 2θ¼11.071, predicted for this space group and forbidden forCcmm. This conclusion is further sup-ported by the absence of SHG signal (which indicates the existence of inversion symmetry center in the crystal structure) and by our Raman scattering (see discussion below). Cai et al.[5]observed a non-centrosymmetric structure for the sample containing Gd
(Cm2m, #38) at room temperature, which changed for a Cmcm space group above 340 K. However, the low-symmetry structure withCm2mspace group reported in Ref.[5]is not compatible with our room temperature SXRD data forLn¼Gd. In fact, both SXRD and SHG data indicate that our sample is centrosymmetric at room temperature, probably due to the significant differences between the employed processing routes. Cai et al. [5] produced their samples by sintering at 16001C from solid-state reacted powders, while our samples were obtained directly at 11001C by molten-salt synthesis. The refined structural parameters for our Gd3NbO7
ceramics are given inTable 2. Contrary to theLn3NbO7structure
with largeLn, described underPmcnspace group with off-centered NbO6octahedra rotated around the [1 0 0] axis, the structure for
medium-sizedLnshows centered NbO6octahedra rotated around
the [0 1 0] axis (see also Fu and Ijdo, Ref.[32]).
For small-sized lanthanides (Ln¼Dy, Tm and Yb), a symmetriza-tion of the average structure is observed, and a defect CaF2structure
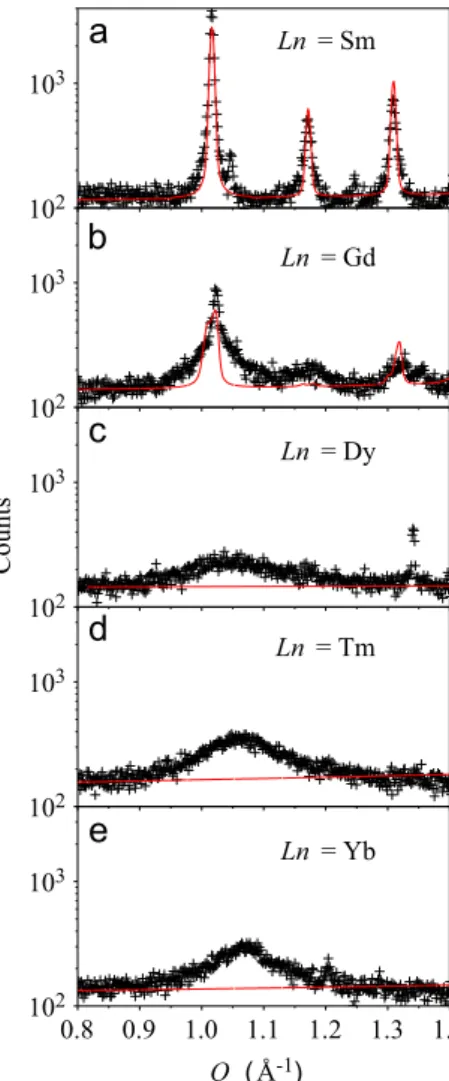
with cubic space groupFm3mwas successfully employed in the refinements, in line with previous reports [1,10]. A pyrochlore structure (Fd3mspace group) with doubled lattice parameter with respect to theFm3mstructure was also attempted to describe the diffraction profiles of such materials. Nonetheless, the extra Bragg peaks expected for the pyrochlore structure were not observed within our sensitivity, indicating that the space group Fm3m describes the symmetry of the average structure of these materials. The refined structural parameters forLn¼Tm are given inTable 3. Fig. 2shows the X-ray scattering signal at the vicinity of the weak 1 1 0 reflection (Ccmmsetting) forLnranging from Sm to Yb. ForLn¼Sm, a sharp 110 reflection atQ¼1.02 Å 1and other minor
peaks consistent with theCcmmspace group are observed, while for Ln¼Gd a sharp reflection appear to coexist with a broad scattering at this position. ForLn¼Dy, Tm and Yb, this reflection is forbidden for the cubic Fm3m structure, although a broad scattering persists at the vicinity of this position. This indicates short-range structural domains that may be related to ordering of Ln/Nb cations and/or oxygen vacancies. This possibility is sup-ported by our Raman scattering data described below and also by recent selected area electron diffraction and high-resolution transmission electron microscopy (HRTEM) in Ln3NbO7 (Ln¼Y,
Er, Yb, and Lu)[39]. From the full width at half maximum of the Fig. 1.SXRD patterns ofLn3NbO7for (a)Ln¼La, (b)Ln¼Gd, and (c)Ln¼Tm with
λ¼0.65319 Å. The cross symbols and solid lines represent observed and calculated
patterns, respectively. The difference curves are shown at the bottom of eachfigure. Vertical bars indicate the expected Bragg peak positions according to the crystal structure models described in the text and refined lattice parameters given in Tables 1–3.
Table 1
Refined structural parameters for La3NbO7.
Atom Site x y z B(Å2)
La(1) 4c 0.25 0.7714(2) 0.0054(4) 0.51(2) La(2) 8d 0.47578(9) 0.44948(12) 0.2501(3) 0.51(2) Nb 4c 0.25 0.2554(5) 0.9949(12) 1.04(6) O(1) 8d 0.8738(12) 0.945(2) 0.962(2) 0.51(11) O(1′) 8d 0.3782(12) 0.417(2) 0.963(2) 0.51(11) O(2) 8d 0.3806(9) 0.7258(12) 0.250(4) 0.51(11) O(3) 4c 0.25 0.306(2) 0.230(3) 0.51(11)
Note: Space groupPmcn,a¼11.1663(3) Å,b¼7.6342(2) Å,c¼7.7555(2) Å,V¼661.12
(4) Å3,R
wp¼16.2%,Rp¼10.7%.
Table 2
Refined structural parameters for Gd3NbO7.
Atom Site x y z B(Å2)
Gd(1) 4b 0 0.5 0 2.35(7)
Gd(2) 8g 0.2464(3) 0.2446(4) 0.25 2.35(7)
Nb 4a 0 0 0 0.7(2)
O(1) 16h 0.118(4) 0.210(2) 0.977(2) 3.3(3) O(2) 4c 0.101(4) 0.5 0.25 3.3(3) O(2′) 4c 0.907(4) 0.5 0.25 3.3(3) O(3) 4c 0.077(4) 0 0.25 3.3(3)
Note: Space group Ccmm, a¼10.6375(4) Å, b¼7.5229(3) Å, c¼7.5417(3) Å,
V¼603.52(4) Å3,Rwp¼15.0%,Rp¼10.6%.
Table 3
Refined structural parameters for Tm3NbO7.
Atom Site occupancy x y z B(Å2)
Tm 4a 0.75 0 0 0 2.35(2)
Nb 4a 0.25 0 0 0 2.35(2)
O 8c 0.875 0.25 0.25 0.25 5.0(2)
Note: Average space groupFm3m, a¼5.2131(2) Å,V¼141.67(2) Å3,Rwp¼15.5%,
broad peaks (Δq0.1–0.15 Å 1), the average size of the ordered domains are estimated as 2π/Δq40–60 Å, which seems to be consistent with reported HRTEM data on the same system[39].
Raman scattering besides theoretical factor-group analysis are currently employed by our research group to investigate the behavior of the phonon modes in electroceramics. In this work, Raman scattering was used for all theLn3NbO7ceramics to confirm
the results from SXRD and SHG techniques, aiming to show the relationship between crystal structure and vibrational modes, which allowed us to contribute to the debate on the crystalline structure of this class of ceramics. For compounds belonging to the cubicfluorite-type structure (Fm3m, #225,O5h),Lnand Nb atoms are in the 4asites (Oh symmetry), and O ions in the 8csites (Td symmetry). Using the site group method of Rousseau et al.[40], the distribution of the phonon modes at the Brillouin zone center can be obtained (Table 4). The results show that only one Raman-active mode is expected (F2g). Cubic pyrochlore structures (Fd3m,
#227,O7h) presentsLnions located in the 16csites (Ohsymmetry), Nb Atoms located in the 16dsites (Ohsymmetry), and two kinds of oxygen atoms located in the 8a(Oh symmetry) and 48fsites (Ohsymmetry). The site group method of Rousseau et al.[40]leads to the following distribution of the phonon modes at the Brillouin zone center: A1gþEgþ4F2g. Thus, six Raman-active modes are
expected for cubicFd3mstructures. For the orthorhombicCcmm space-group (#63,D172h), two kinds of lanthanide atoms and three different oxygen atoms can be found:Ln(1) is located in the 4a sites (Cx
2hsymmetry),Ln(2) is located in the 8gsites (Cxys symme-try), Nb atoms are located in the 4bsites (Cx
2hsymmetry), O(1)-O (3) are respectively in the 4c(Cy
2hsymmetry), 16h(C1symmetry), and 8g(Cxy
s symmetry) sites. The site group method of Rousseau et al.[40]leads to the following distribution of the phonon modes at the Brillouin zone center: 8Agþ8B1gþ5B2gþ6B3g. Thus, 27 Raman-active modes are expected in that Ccmm space-group (Table 4).
The other two possibilities for the crystal structures studied in the present work are presented below. The orthorhombicPmcn space-group (#62,D162h), an alternative setting of thePnmaspace group, contains two kinds of lanthanide atoms and four different oxygen atoms: Ln(1) is located in the 4c sites (Cxz
s symmetry), Ln(2) is located in the 8dsites (C1symmetry), Nb atoms are located
in the 4csites, O(1)–O(3) are in the 8csites, and the O(4) is located in the 4csites. The method of Rousseau et al.[40]was then applied and the following distribution of the phonon modes at the Brillouin zone center can be obtained: 18Agþ15B1gþ18B2gþ15B3g.
For this structure, 66 Raman-active modes are expected. Finally, the orthorhombic C2221 (#20) space-group shows two kinds of
lanthanide ions andfive different oxygen ions in the following crystallographic sites:Ln(1) in the 4asites (Cx
2symmetry),Ln(2) in the 8csites (C1symmetry), Nb ions in the 4bsites (Cy2symmetry), O(1)–O(2) in the 8csites, and O(3)–O(5) in the 4bsites. In this case, the site group method of Rousseau et al.[40]leads to the following Table 4
Factor-group analysis for all crystal structures previously reported by the literature for theLn3NbO7materials. Only the Raman-active irreducible representations at the Brillouin-zone center (Γ) were considered.
Ion Wyckoff
sites
Symmetry Irreducible representations
Cubicfluorite-type (Fm3m,#225)
Lnþ3 4a O
h No Raman-active
Nbþ5 4
a Oh No Raman-active
O 2 8c T
d F2g
ΓRAMAN¼F2g
Cubic pyrochlore (Fd3m,#227)
Lnþ3 16c O
h No Raman-active
Nbþ5 16
d Oh No Raman-active
O 2(1) 48f O
h A1gþEgþ3F2g
O 2(2) 8a O
h F2g
ΓRAMAN¼A1gþEgþ4F2g
Orthorhombic (Ccmm,#63)
Lnþ3(1) 4a
Cx
2h No Raman-active
Lnþ3(2) 8
g Cxy
s 2Agþ2B1gþB2gþB3g
Nbþ5 4
b Cx2h No Raman-active
O 2(1) 4c
Cy
2h AgþB1gþB3g
O 2(2) 16h C
1 3Agþ3B1gþ3B2gþ3B3g
O 2(3) 8
g Cxy
s 2Agþ2B1gþB2gþB3g
ΓRAMAN¼8Agþ8B1gþ5B2gþ6B3g
Orthorhombic (Pmcn,#62)
Lnþ3(1) 4c
Cxz
s 2AgþB1gþ2B2gþB3g
Lnþ3(2) 8
d C1 3Agþ3B1gþ3B2gþ3B3g
Nbþ5 4c
Cxz
s 2AgþB1gþ2B2gþB3g
O 2(1) 8d C
1 3Agþ3B1gþ3B2gþ3B3g
O 2(2) 8
d C1 3Agþ3B1gþ3B2gþ3B3g
O 2(3) 8d C
1 3Agþ3B1gþ3B2gþ3B3g
O 2(4) 4
c Cxz
s 2AgþB1gþ2B2gþB3g
ΓRAMAN¼18Agþ15B1gþ18B2gþ15B3g
Orthorhombic (C2221,#20)
Lnþ3(1) 4b
Cy
2 Aþ2B1þB2þ2B3
Lnþ3(2) 8
c C1 3Aþ3B1þ3B2þ3B3
Nbþ5 4b
Cy
2 Aþ2B1þB2þ2B3
O 2(1) 8
c C1 3Aþ3B1þ3B2þ3B3
O 2(2) 8c C
1 3Aþ3B1þ3B2þ3B3
O 2(3) 4
a Cx
2 Aþ2B1þ2B2þB3
O 2(4) 4
a Cx
2 Aþ2B1þ2B2þB3
O 2(5) 4a
Cx
2 Aþ2B1þ2B2þB3
ΓRAMAN¼14Aþ19B1þ17B2þ16B3
10
210
310
210
310
210
310
210
30.8 0.9 1.0 1.1 1.2 1.3 1.4
10
210
3Ln
= Sm
Ln
= Dy
Ln
= Gd
Counts
Ln
= Tm
Ln
= Yb
Q
(
Å
-1)
distribution of the phonon modes at the Brillouin zone center: 14Aþ19B1þ17B2þ16B3. Excluding the acoustic and silent modes, 63 bands are also expected in the Raman spectra for this structure. Raman spectra were experimentally obtained at room-temperature by using different excitation lines for all samples, in order to avoid strong luminescence and electronic transitions. The
final spectra represent the best results obtained using the blue line (488 nm), for Eu, Gd, and Yb; yellow line (568.2 nm), for Ho and Er; and the red line (632.8 nm), for La, Pr, Nd, Sm, Tb, Dy, Tm, and Lu. The results are displayed inFig. 3(two boards) for decreasing ionic radius (La–Lu). It is well known that it is very difficult to analyze quantitatively the experimental results from Raman scat-tering in crystal structures with high number of predicted bands. Kovyazina et al. [34] studied La3NbO7, Nd3NbO7, Gd3NbO7 and
Y3NbO7materials and emphasized the difficulties to obtain
reli-able spectra.
As it can be noted inFig. 3, the samples exhibited very complex spectra, which could be divided in three distinct groups, as follows. The first group of spectra encompasses La, Pr, and Nd-containing ceramics with similar set of vibrational bands, assumed as belonging to the Pmcn structure, as verified by the SXRD analysis. Particularly, the main features include the NbO6
breath-ing mode at 710–730 cm 1 and a complex group of modes between 85 cm 1and 400 cm 1. The spectrum for the Pr
3NbO7
ceramic presents rather broader bands besides strong down-shifted low-frequency modes (below 150 cm 1), which could be
probably linked to the proximity of a structural phase transition, as
previously observed in CeNbO4 materials [41]. For this set of
ceramics, it was expected 66 Raman-active modes (Table 4). However, no more than 27 bands could be observed (see Table 5 in Supplementary materials). It turns out this is the expected number of modes for the structure with Cmcm space group reported in the early works on similar Ln3SbO7[33]. This
result highlights the similarity between the structures withCmcm andPmcnspace groups, suggesting that the extra modes presum-ably activated by the off-centering of NbO6octahedra in thePmcn
structure show very weak Raman activity and could not be observed within our sensitivity.
The second group of Raman spectra is formed by the samples Sm3NbO7, Eu3NbO7, and Gd3NbO7, which presented a significant
up-shifting of the NbO6 breathing mode if compared with the
same mode for the previous group of ceramics. Also, down-shift of the low-frequency modes below 150 cm 1and strong changes in
the modes ranging from 150 to 450 cm 1can be easily observed.
In this respect, the mode at 380 cm 1appears as a signature or a
fingerprint of the orthorhombic Ccmmstructure, as verified for Ln3SbO7ceramics in a previous paper[33]. The adjustment of the
experimental data throughfitting procedures by Lorentzian curves was conducted for all samples and the results for the Sm3NbO7
ceramics are presented in Fig. 4. As a general trend, the wave-numbers of the bands down-shifted for decreasing ionic radii, as expected[42]. Raman modes obtained afterfitting are presented for Sm, Eu, and Gd ceramics asSupplementary materials (Table 5). It is worthy noticing that 27 bands were depicted for these spectra, in perfect agreement with group theoretical predictions for the Ccmmspace group.
Finally, the last group of ceramics includes Tb, Dy, Ho, Er, Tm, Yb, and Lu. For these materials, it is first observed an additional up-shift in the NbO6 breathing mode. Also, the general Raman
pattern has modified completely, with a large dominating band besides few very intense, discernible modes. Particularly, there are two low-frequency modes at 92–95 cm 1and 1180,123 cm 1, the band around 175–180 cm
1, the mode around 370
–390 cm
1, and
the bands around 765–794 cm 1. Some extra Raman bands (marked by asterisks inFig. 3b) were observed in samples with 150 300 450 600 750 900
Raman Intensity
Gd
Eu
Sm
Nd
Pr
La
Wavenumber (cm-1)
150 300 450 600 750 900
Tb Lu
Tm
Er
Ho Yb
Raman Intensity
Wavenumber (cm-1)
* *
*
Dy
Fig. 3.Room-temperature Raman spectra for allLn3NbO7ceramics: (a) La–Gd, and (b) Tb–Lu. Extra bands are due to electronic artifacts and are indicated by asterisks.
90 105 120 135
175 210 245 280
320 360 400 440
500 600 700 800 900
Sm3NbO7
Raman inte
nsity
Wavenumber (cm
-1)
Ho and Er, for which it is very difficult to obtain spectra free of electronic artifacts. According to SXRD analysis, for an average Fm3mstructure, one would expect only one Raman-active band for this set of ceramics. However, our results showed that six modes are present, which are compatible with a cubic pyrochlore (Fd3m) structure (see alsoTable 5 in Supplementary materials). This is consistent with our SXRD data shown in Fig. 2, which indicates the presence of lower-symmetry structural domains immersed in theFm3mmatrix for this last group of ceramics. In fact, once Raman spectroscopy is sensitive to the atomic structure in the nanometric range, is expected to capture the Raman-active modes of low-symmetry structural domains, explaining the obser-vation of a higher number of observed modes with respect to that expected for the high-symmetry Fm3m structure. Corroborating ourfindings, López-Conesa et al.[39]also observed low-symmetry nano-domains in Ln3NbO7 (Ln¼Y, Er, Yb, and Lu) by
high-resolution transmition electron microscopy.
4. Conclusions
Ln3NbO7(Ln¼La, Pr, Nd, Sm, Eu, Gd, Tb, Dy, Ho, Er, Tm, Yb, and
Lu) ceramics were synthesized by the molten-salt technique at lower temperatures if compared with those currently employed in conventional solid-state processing. The crystal structures of these materials were investigated by SXRD, SHG and Raman scattering. Orthorhombic and cubic structures were observed depending upon of the ionic radii of the lanthanide elements. It was observed that La-Nd based materials belong toPmcnspace group, while Sm-Gd samples belong to the Ccmm structure. For this group of ceramics, the results are in perfect agreement with the group-theory calculations and corroborate the results from SXRD and SHG analyses. According to SXRD, ceramics containing Tb-Lu exhibit an average defectfluoriteFm3mcubic structure with the presence of nano-domais with lower symmetry. The existence of such low-symmetry domains is also indicated by the observation of six Raman-active bands for these ceramics, in contrast to a single mode expected for the averageFm3mstructure.
Acknowledgments
The authors thank thefinancial support from CNPq, FINEP and FAPEMIG. Special thanks to Dr. A. Righi, Dr. C. Fantini Leite, and Dr. M. A. Pimenta (UFMG) for their hospitality during Raman experiments with the Dilor XY and T64000 equipments. LNLS is acknowledged for concession of beamtime.
Appendix A. Supplementary material
Supplementary data associated with this article can be found in the online version athttp://dx.doi.org/10.1016/j.jssc.2013.10.015.
References
[1]H.P. Rooksby, E.A.D. White, J. Am. Ceram. Soc. 47 (1964) 94. [2]J.G. Allpress, H.J. Rossell, J. Solid State Chem. 27 (1979) 105. [3]H.J. Rossell, J. Solid State Chem. 27 (1979) 115.
[4]L. Cai, J.C. Nino, Acta Crystallogr., Sect. B: Struct. Sci. 65 (2009) 269. [5]L. Cai, S. Denev, V. Gopalan, J. Nino, J. Am. Ceram. Soc. 93 (2010) 875. [6]P. Khalifah, Q. Huang, J.W. Lynn, R.W. Erwin, R.J. Cava, Mater. Res. Bull. 35
(2000) 1.
[7]D. Harada, Y. Hinatsu, J. Solid State Chem. 158 (2001) 245. [8]D. Harada, Y. Hinatsu, J. Solid State Chem. 164 (2002) 163.
[9]N. Ishizawa, K. Tateishi, S. Kondo, T. Suwa, Inorg. Chem. 47 (2008) 558. [10]Y. Doi, Y. Harada, Y. Hinatsu, J. Solid State Chem. 182 (2009) 709. [11]M. Wakeshima, Y. Hinatsu, J. Solid State Chem. 183 (2010) 2681.
[12]M. Wakeshima, H. Nishimine, Y. Hinatsu, J. Phys. Condens. Matter 16 (2004) 4103.
[13]R. Abe, M. Higashi, Z. Zou, K. Sayama, Y. Abe, H. Arakawa, J. Phys. Chem. B 108 (2004) 811.
[14]L. Cai, J.C. Nino, J. Eur. Ceram. Soc. 27 (2007) 3971.
[15]Y. Hinatsu, H. Ebisawa, Y. Doi, J. Solid State Chem. 182 (2009) 1694. [16]Y. Hinatsu, Y. Doi, H. Nishimine, M. Wakeshima, M. Sato, J. Alloys Compd. 488
(2009) 541.
[17]A. Kahn-Harari, L. Mazerolles, D. Michel, F. Robert, J. Solid State Chem. 116 (1995) 103.
[18]F. Wiss, N.P. Raju, A.S. Wills, J.E. Greedan, Int. J. Inorg. Mater. 2 (2000) 53–59.
[19]D. Harada, Y. Hinatsu, Y. Ishii, J. Phys. Condens. Matter 13 (2001) 10825–10836.
[20]R. Lam, T. Langet, J.E. Greedan, J. Solid State Chem. 171 (2002) 317–323.
[21]Y. Hinatsu, M. Wakeshima, N. Kawabuchi, N. Taira, J. Alloys Compd. 374 (2004) 79–83.
[22]J.R. Plaisier, R.J. Drost, D.J.W. IJdo, J. Solid State Chem. 169 (2002) 189–198.
[23]W.R. Gemmill, M.D. Smith, Y.A. Mozharivsky, G.J. Miller, H.-C. zur Loye, Inorg. Chem. 44 (2005) 7047–7055.
[24]R. Lam, F. Wiss, J.E. Greedan, J. Solid State Chem. 167 (2002) 182–187.
[25]J.F. Vente, D.J.W. IJdo, Mater. Res. Bull. 26 (1991) 1255–1262.
[26]H. Nishimine, M. Wakeshima, Y. Hinatsu, J. Solid State Chem. 177 (2004) 739–744.
[27]J.F. Vente, R.B. Helmholdt, D.J.W. IJdo, J. Solid State Chem. 108 (1994) 18–23.
[28]J.E. Greedan, N.P. Raju, A. Wegner, P. Gougeon, J. Padiou, J. Solid State Chem. 129 (1997) 320–327.
[29]H. Nishimine, M. Wakeshima, Y. Hinatsu, J. Solid State Chem. 178 (2005) 1221–1229.
[30]D.K. Nath, Inorg. Chem. 9 (1970) 2714–2718.
[31]T. Fennell, S.T. Bramwell, M.A. Green, Can. J. Phys. 79 (2001) 1415–1419.
[32]W.T. Fu, D.J.W. IJdo, J. Solid State Chem. 182 (2009) 2451–2455.
[33]K.P.F. Siqueira, R.M. Borges, E. Granado, L.M. Malard, A.M. de Paula, E.M. Bittar, R.L. Moreira, A. Dias, J. Solid State Chem. 203 (2013) 326–332.
[34]S.A. Kovyazina, L.A. Perelyaeva, I.A. Leonidov, Y.A. Bakhteeva, J. Struct. Chem. 44 (2003) 975.
[35]A.C. Larson, R.B. Von Dreele, Los Alamos National Laboratory Report LAUR 86–
748 (2000);
B.H. Toby, J. Appl. Crystallogr. 34 (2001) 210–213.
[36]R.W. Boyd, Non Linear Optics, third ed., Academic Press, Burlington, MA, 2008. [37]W. Hayes, R. Loudon, Scattering of Light by Crystals, Wiley, New York, 1978. [38]L. Cai, J.C. Nino, J. Solid State Chem. 184 (2011) 2263.