Article
Printed in Brazil - ©2017 Sociedade Brasileira de Química0103 - 5053 $6.00+0.00
*e-mail: [email protected]
Characterization of Acidic Compounds in Brazilian Tar Sand Bitumens by
LTQ Orbitrap XL: Assessing Biodegradation Using Petroleomics
Laercio L. Martins,a Célio Fernando F. Angolini,b Georgiana F. da Cruz*,a and
Anita J. Marsaiolib
aLaboratório de Engenharia e Exploração de Petróleo (LENEP),
Universidade Estadual do Norte Fluminense Darcy Ribeiro (UENF), 27910-970 Macaé-RJ, Brazil
bInstituto de Química, Universidade Estadual de Campinas (UNICAMP),
13084-971 Campinas-SP, Brazil
A set of eight tar sand samples with identical source, from sedimentary facies of the Pirambóia Formation, Paraná Basin, provides an interesting opportunity to assess the biodegradation extent of bitumens using high-resolution mass spectrometry with Orbitrap mass analyzer. The results suggest that acidic compounds have been degraded by microorganisms, since the O2 and O3 classes
were lower to bitumens from dry interdune facies, the most biodegraded. It was also proposed a new parameter to evaluate biodegradation, DBE ratio (ratio between acidic species with the same number of double bond equivalent), that was used together with the already proposed A/C ratio (acyclic to cyclic naphthenic acids), both obtained from O2 class distribution. The bitumens from
dry interdune facies presented the highest DBE ratios and lowest A/C ratios, which suggested that these parameters can be used to assess the extent of bitumen biodegradation in which the DBE ratios increase and the A/C ratios decrease with increasing biodegradation.
Keywords: heavy oil, biodegradation, heteroatom class, sedimentary facies, Paraná Basin
Introduction
It is expected that the production of heavy, biodegraded oil will increase worldwide as lighter conventional oil reserves are depleted.1 This shortage of light oil makes these
less attended energy resources more attractive, especially considering that heavy oils are currently 10 times more abundant than conventional oils.2 Even with the fluctuation
of crude oil prices, unconventional oil probably will gain a considerable market share in the short term, although conventional oil remains as a major source of global oil market in the long term.3 Therefore, these unconventional
oils are potential resources that could be used to fulfill current and future energy requirements. Among these unconventional oils, bitumens from tar sand reservoirs have great potential to assist in meeting the world’s rising energy demand.4,5
The occurrence of tar sand bitumens is common in many basins worldwide, but they are mainly found in shallow reservoirs on the flanks of foreland basins in North
and South America. The largest accumulations are the supergiant deposits of tar sands in the Alberta (Canada) and Eastern Venezuelan (Venezuela) basins.6,7 In Brazil, there
are tar sand bitumen accumulations in the Paraná Basin, mostly occurring in sandstones of the Triassic Pirambóia Formation. These tar sands are restricted to the eastern margin, with approximately 25 known localities spread over two areas in the state of São Paulo. The Anhembi Exudation area is one of the major heavy oil exudations in this area. The oil reservoir was estimated at 5,712,000 barrels based on a mean content of 5.5% weight oil. These bitumen deposits have a high viscosity and medium-to-high sulfur content (2-3% by weight).8
The Paraná Basin is a very large intracratonic basin in which the tar sand accumulations are attributed to the Irati-Pirambóia petroleum system.8,9 In the Pirambóia
energy processes by deposition of the dunes. In contrast, the interdune facies were formed by lower energy processes, with the groundwater elevation level, showing a semi-horizontal stratification.10,11
Tar sand reservoirs are commonly characterized by fluids that have highly variable physical and chemical properties,1
mainly due to differing extents of biodegradation and other post-accumulation alteration processes, such as water washing, in reservoir maturation, and the fractionation of light and heavy ends due to migration.12,13 Some parameters,
such as viscosity, may vary by several orders of magnitude within a single penetrated reservoir section.1
The effects of biodegradation on the hydrocarbon composition and physical properties of crude oil, as well as the geological conditions, types of microorganisms, and their biochemical pathways, are well known.14-18
The oxidation of oil during biodegradation decreases the saturated hydrocarbon content and API gravity (American Petroleum Institute gravity), whereas oil density, metal, polar compound contents, and acidity increase. Thus, biodegraded oil negatively affects oil production and refining operations, reducing oil value.7,19,20
The effects of biodegradation on polar species are much less established than those on hydrocarbons. The analysis of polar compounds, in general, suffers from their thermal instability, low volatility, and ineffective separation and detection by the analytical techniques most commonly used to analyze petroleum composition, such as chromatography and mass spectrometry.21,22 Moreover, analytical systems
often lack the chromatographic resolution and mass resolving power to identify individual compounds, particularly in the case of severely biodegraded oil samples containing noticeable amounts of polar components.23
Recently, some high resolution and high mass accuracy analytical techniques became commercially available, such as Fourier transform ion cyclotron resonance mass spectrometry (FT-ICR MS) and Orbitrap Fourier transform mass spectrometry (Orbitrap FT MS). These techniques are capable of analyzing several hundred thousand polar compounds in a petroleum mixture at once.24 This
application is made possible by coupling the techniques to soft ionization sources, e.g., electrospray ionization (ESI) and atmospheric pressure photoionization (APPI).25,26
Thus, these systems allow the efficient ionization of complex samples and provide sufficient resolving power, mass accuracy, and spectral dynamic range to differentiate between thousands of ions and unambiguously identify their elemental compositions.27,28
Both of the high-resolution mass spectrometers discussed above have emerged as invaluable tools in analyzing the chemical composition of petroleum.29,30
Because each molecule has a distinct elemental composition, e.g., CcHhNnOoSs, has a unique exact mass, sufficiently high
mass-resolving power and mass accuracy make it possible to simultaneously resolve and identify each of the thousands of compounds found in petroleum. Additionally, it is possible to separate and classify petroleum components according to their heteroatom class (NnOoSs), double
bond equivalent (DBE), and carbon number. This characterization of petroleum at the molecular level is called “petroleomics”.31
Petroleomics has been previously used to analyze the composition of acidic compounds and the degree of petroleum biodegradation, including heavy-oil and tar sand reservoirs.22,30,32-36 These studies involved mainly the
O2 species distribution, and some biodegradation indexes
have been suggested. Kim et al.32 suggested that A/C ratio
(acyclic to cyclic naphthenic acids) could be used as a measure of the degree of biodegradation, based on the consistent decrease in acyclic fatty acids and increase in cyclic O2 species with microbial degradation. Other
biodegradation indexes suggested by Vaz et al.33 are a
modification on A/C ratio, which was made to take 4- and 5-ring naphthenic acids into account, calculating the ratio between DBE 1 and DBE 2-6, and saturated acid (SA) index calculated by the sum of relative abundance of DBE 1-6 for the class O2, in which a plot using both modified A/C
and SA indexes was useful to assess biodegradation extent. Angolini et al.30 proposed a biodegradation scale using O
2
compounds, based on the fact that compounds with less complex structures (lower DBE) are more depleted than those with more complex structures (higher DBE).
In this work, the acidic fractions of tar sand bitumens from eolic sedimentary facies of the Pirambóia Formation (Paraná Basin, Brazil) were analyzed by negative-ion ESI LTQ Orbitrap XL to characterize acidic compounds by their heteroatom classes. The LTQ Orbitrap XL presents lower costs relative to typical FT ICR instruments, but it still retains sufficient resolution to assign molecular formulas to individual components present in mixtures, mainly those of relatively high abundance.29,30 In this context, the influence
of biodegradation on the acidic species composition was explored by O2 species distribution, DBEs, and A/C ratios.
Experimental
Samples and pretreatment
according to their eolic sedimentary facies.11 The samples
were from four different localities in the state of São Paulo, Brazil: Mina Farm; Betumita Farm; Bofete Farm; and Guareí.37,38 Eight samples were selected, two of each
sedimentary facies: dry interdune (S12 and S14, from Mina Farm); dune foreset (S26 and S28, from Betumita Farm); wet interdune (S03 and S04, from Bofete Farm); and dune bottomset (S27 and S33, from Betumita Farm).
The rock samples were all crushed and pulverized before bitumen extraction with dichloromethane (chromatographic grade from Sigma-Aldrich) using a Soxhlet system for 72 hours. For analysis by negative-ion ESI LTQ Orbitrap XL, the acid fraction was obtained by KOH modified silica gel column chromatography. The bitumens were first eluted with ether to obtain the neutral fraction and then eluted with ether:formic acid (20%) to obtain the acidic fraction.39 The ether:formic acid mixture
was evaporated under vacuum. These acidic fractions were typically dissolved at concentrations of 0.5 mg mL-1
in toluene:methanol (1:1 v/v) with 0.5% of NH4OH. The
solvents are HPLC grade from Merck or JTbaker.
LTQ Orbitrap XL analysis
A ThermoFisher Scientific LTQ Orbitrap XL mass spectrometer, equipped with an external ESI source was used in the negative ion mode to analyze the acidic fraction. A spray voltage of 3.6 kV was applied to the tip. The capillary voltage and capillary temperature were kept constant at 48 V and 275 °C, respectively. Mass spectra were acquired in a mass range of m/z 200-1000. A resolution of 100 000 at m/z 400 was used in all experiments. A syringe pump was used for direct infusion.
Data acquisition and processing were performed by Xcalibur, which attributed the molecular formula with elemental composition restricted to C10013C2H200O4N2,
accepting only formulas with errors below 3 ppm. Post-acquisition mass spectra recalibration procedure was applied, using RecalOffline, a tool from Xcalibur software. Microsoft Excel 2007 was used to data reorganization and to build the distribution of heteroatom classes. Origin® 8
was used to do the iso-abundance plots of DBE versus
carbon number for O2 class species.
Results and Discussion
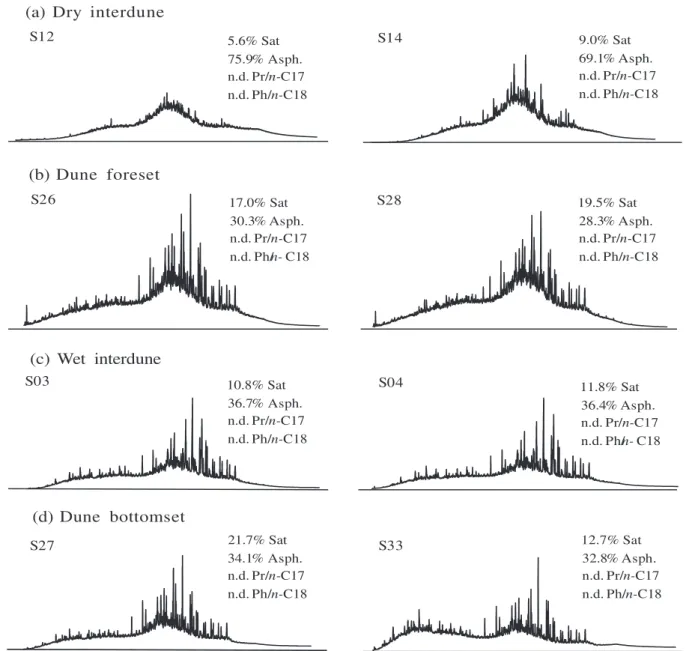
The bitumen samples used in this work were already analyzed by gas chromatography with flame ionization detector (GC-FID) to assess the extent of biodegradation.37,38
The chromatograms obtained by GC-FID analysis (usually called fingerprints) are given in Figure 1.
Martins et al.37 showed that the chromatograms obtained
for all bitumen samples (Figure 1) reveal absence of
n-alkanes and the isoprenoids pristane (Pr) and phytane (Ph). This result suggests a heavy level of biodegradation in Peters and Moldowan (PM) biodegradation scale (more than 5 PM).40 However, it was observed a lower abundance
of hydrocarbons to the bitumens from dry interdune facies, mainly to sample S12. Furthermore, the bitumens from this facies show a higher content of asphaltenes (%Asph) and lower content of saturated hydrocarbons (%Sat) than bitumens from the other facies, which suggested highest biodegradation extent for the dry interdune facies (S12 and S14).11
In this work, we present another technique to assess biodegradation in bitumens, evaluating the acidic composition by ESI LTQ Orbitrap XL. Pomerantz et al.29 have already
used this alternative technique to analyze whole oil, proposing the Orbitrap as method for routine analysis of the composition of the more abundant compounds in the polar fraction of petroleum. However, the analysis of acidic fraction instead the whole oil improves the MS analysis by avoiding unresolved compounds due to limited resolution of standard Orbitrap. Angolini et al.30 have already used this
technique in the same way to evaluate biodegradation of a set of oil with different levels of biodegradation (slight to severe levels), and they proposed a new biodegradation scale using O2 compounds. Besides, Kim et al.32 and Hughey et al.34
have previously presented FT-ICR MS results showing how biodegradation can affect the composition of polar compounds. Smith et al.35 used the same high-resolution
mass accuracy technique to characterize the acidic species in Canadian bitumen (Athabasca oil sands), and Liao et al.22
used this technique to analyze bitumens from the Liaohe Basin of Northeast China, studying the change in oil composition or compound class distribution based on the degree of biodegradation severity.
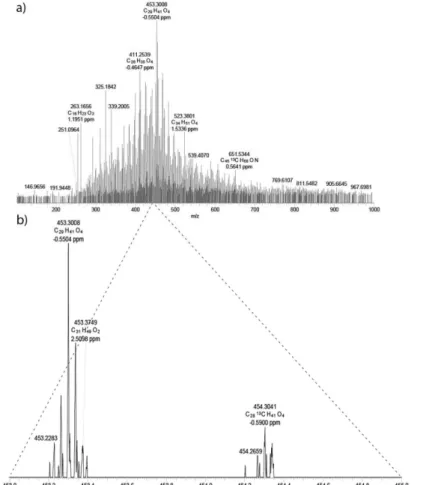
Figure 2 shows the broadband negative ion LTQ Orbitrap XL mass spectra of the acidic fractions separated from tar sand bitumens of sedimentary facies of the Pirambóia Formation. The number of components and the average molecular weight of the polar compounds are distinct to bitumens from the dry interdune facies in comparison with the other facies. These most biodegraded bitumens contain the largest number of peaks, as can be clearly observed in Figure 2. The S12 and S14 bitumen samples analyzed in this work have a Peters and Moldowan (PM)40 level greater
selective degradation process as complex as those that affect hydrocarbons.32,41 For instance, acyclic acids, which can be
products from the biodegradation of acyclic hydrocarbons,30
have greatest susceptibility among O2 species to microbial
degradation, as showed by Kim et al.32
Figure 3 shows the expanded view from m/z 453 to 455, showing attributed classes with errors below 3 ppm. In fact, the analysis of acidic fraction instead of crude oil improved the MS analyses by avoiding unresolved compounds due to limited resolution of Orbitrap (100 000 at m/z 400).30
Compound class distribution
The relative abundances of compound classes in the acidic fractions can be found in Figure 4. The compound classes
identified are characterized by the type and the number of heteroatoms. N1, N2, N1O1, N1O2, N1O3, N1O4, N2O1, N2O2,
N2O3, N2O4, O1, O2, O3, and O4 classes were found to be
present in the acidic fractions. Relative abundance of each class was calculated by normalizing the peak abundance to the total abundance (all the assigned peaks). In the presented compound class distribution of bitumen acidic fractions, the greatest relative abundances were observed for O2, O3, and
O4 classes that mainly represent carboxylic acids (e.g., O2
and O4 species are, presumably, carboxylic and dicarboxylic
acids, respectively), and the least relative abundances were observed for the other classes, which represent acidic nitrogen compounds.
Among the Oo classes (Figure 4), the O1 class showed
the lowest abundance. This class is dominated by alcohols
Figure 2. Negative-ion ESI LTQ Orbitrap XL mass spectra of the acidic fractions separated from tar sand bitumen samples from the Pirambóia Formation: S12 and S14 from dry interdune facies; S26 and S28 from dune foreset facies; S03 and S04 from wet interdune facies; S27 and S33 from dune bottomset facies.
Figure 4. Distribution of heteroatom classes determined by negative-ion ESI LTQ Orbitrap XL mass spectra for acidic fractions of bitumen samples: S12 and S14 from dry interdune facies; S26 and S28 from dune foreset facies; S03 and S04 from wet interdune facies; S27 and S33 from dune bottomset facies.
and other compounds that are considered intermediates in a number of petroleum component biodegradation pathways.22,42 Because these bitumen samples are severely
biodegraded, these intermediates compounds may be almost completely consumed during further biodegradation under aerobic and anaerobic conditions, as was shown by Harwood et al.41
The relative abundance of O2 andO3 classes in general
is lower in the acidic fraction of bitumens from the dry interdune facies (S12 and S14). These are the most biodegraded bitumens, so their low abundance is an indication that the acidic compounds have been degraded by microorganisms. The GC-MS analyses showed the absence of most hopanes in these samples (data not shown), which may indicate that with the almost complete depletion of these hydrocarbons, the degradation of the carboxylic acids, such as hopanoic acids formed by the oxidation of corresponding hopanes, becomes more intense. However, the relative abundances of the N1O1,
N1O2, N1O3, and N1O4 classes are higher in the most
biodegraded samples. This result is in agreement with the fact that N1O2 compounds appear to be biodegradation
products of N-containing compounds, being formed by the ring opening of hydroxyl dibenzocarbazoles with the addition of carboxyl group.22
The distribution of O2 species
The O2 species in petroleum and bitumen are presumably
carboxylic acids (“naphthenic”). Mapolelo et al.36 showed
that the high relative abundance of O2 species in Angola
crude oil and Athabasca bitumen suggests extensive biodegradation.
Other works have performed detailed analyses of naphthenic acids in crude oils.19,32 According to
Watson et al.,43 carboxylic acids in crude oil could have
three possible sources: primary acids from the source rock, oil biodegradation products, and acids biosynthesized
by microorganisms. The carboxylic acids in crude oil may be continuously removed by post-accumulation process, such as further biodegradation, water washing, and thermal alteration.41 In this work, we suggest that the
O2 species were formed by the chemical and biochemical
oxidation of crude oil after migration into the reservoir, but with further biodegradation, the O2 species began to
degrade. Kim et al.32 showed that polar components are not
bioresistant, as once believed, and that these compounds undergo selective degradation processes as complex as those that affect hydrocarbons.
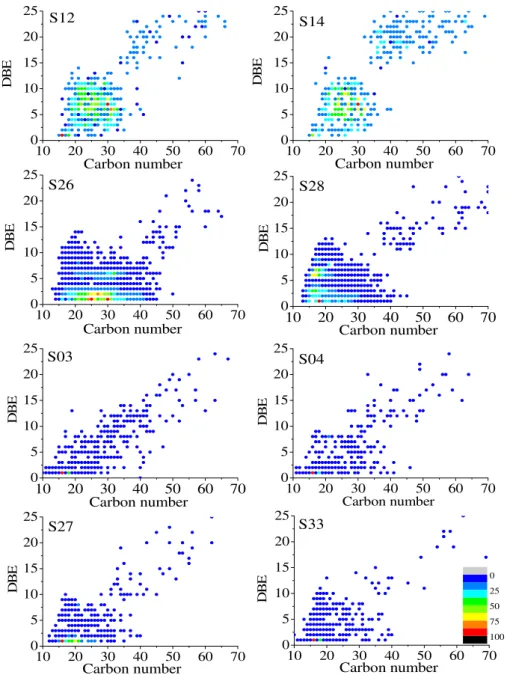
Figure 5 shows the abundance plots of DBE versus
carbon number for the O2 class in the acidic fractions of
the eight bitumen samples. It can be observed that the O2
class distribution is very similar to that of bitumens from the same sedimentary facies, but this distribution differs among the different facies. Bitumens S12 and S14 (dry interdune facies) have less fatty acids and isoprenoid acids (DBE = 1) than the others because fatty acids have the greatest susceptibility to biodegradation among the O2 compounds.22,30,32 Furthermore, these samples have the
least number of O2 species when compared to the other
samples, with a narrower carbon number range and almost no species below 20 carbons. These results are in agreement with the highest level of biodegradation in bitumens from the dry interdune, resulting in the consumption of acidic compounds as reported by Angolini et al.30
The O2 species with DBE values from 2 to 7 are
naphthenic acids of 1-6 rings.44 Watson et al.43 showed that
hopanoic acids (species with DBE 6) could be formed by the oxidation of corresponding hopanes during aerobic biodegradation of crude oils by side chain oxidation. Species with DBE > 7 are likely multi-ring naphthenic acids and aromatic acids.41
DBE ratios
The following DBE ratios were calculated based on O2 class distribution: DBE 4/DBE 3, DBE 6/DBE 3, and
DBE 8/DBE 3. These ratios were calculated by the sum of the abundances of acidic species with the same number of double bond equivalent (DBEs). The O2 class species
with DBE 3, DBE 4, DBE 6, and DBE 8 mainly include bicyclic, tricyclic terpanoic, hopanoic, and naphthalenic acids, respectively. We are proposing these biodegradation ratios based on the fact that biodegradation of O-containing compounds follow a preferential order, in which compounds with less complex structures (lower DBE) are more depleted
than those with more complex structures (higher DBE), as it was showed by Angolini et al.30 Besides, the DBE 3
was chosen in the ratios denominator due to the higher abundance of bicyclic terpanoic acids in biodegraded oils with PM level lower than 6, which begins to be degraded in higher levels of biodegradation.30,32 Figure 6 shows these
DBE ratio distributions in the eight bitumen samples. It can be observed in Figure 6 that the samples from dry interdune facies (S12 and S14), the most biodegraded bitumens, have the highest DBE ratio values. Typically, biodegradation occurs by readily depletion of the less complex compounds in petroleum (hydrocarbon compounds with lower molecular masses),30,40 shifting
Figure 5. Iso-abundance plots of DBE versus carbon number for O2 class species in acidic fractions. Data derived from negative-ion ESI LTQ Orbitrap
Figure 6. DBE ratios distribution to bitumen samples from the sedimentary facies of Piramboia Formation, Paraná Basin, Brazil.
the maximum of the O2 class to lower levels of DBE.
Thus, it could be expected a general decreasing trend in these ratios with increasing biodegradation intensity, since the abundance of compounds with DBE 3 would increase.However, in this work, we found that these ratios exhibit an increasing trend with increasing biodegradation intensity. This result can be explained by the fact that the samples analyzed in this work show evidence of a greater degree of biodegradation (bitumens with a heavy level of biodegradation),38 and compounds with less complex
structures (DBE 3) were more depleted than those with more complex structures (DBE 4, DBE 6 and DBE 8), as it was already showed by Angolini et al.30 This level of
biodegradation reached by the samples shows evidence of significant acidic compound biodegradation.
The samples from the other sedimentary facies (S26, S28, S03, S04, S27, and S33) have lowest DBE ratio values. This result suggests a distinct degree of biodegradation between the bitumens from these facies and from dry interdune. Thus, these ratios may be used to evaluate the degree of biodegradation in heavy-oil and tar sand bitumens.
A/C ratio
Kim et al.32 suggested a biodegradation index to
be used for estimating the degree of biodegradation by petroleomics. This index is based on the ratio of acyclic to cyclic naphthenic acids (A/C ratio), in which there is
a consistent decrease in acyclic fatty acids and increase in cyclic O2 species with biodegradation. Hughey et al.34
tested the robustness of this proposed index and suggested that this biodegradation index is useful in monitoring the biodegradation of a single oil or a suite of genetically related oil, such as the bitumen samples examined in this work. Thus, A/C ratios were calculated for the eight bitumen samples, and the results are shown in Figure 7.
It can be observed in Figure 7 that the bitumen samples from different sedimentary facies have different A/C ratios. This index is the lowest for bitumens from the dry interdune facies (S12 and S14), the most biodegraded samples, in agreement with the results obtained from the DBE ratios. Therefore, this index is also suitable for assessing the degree of biodegradation in tar sand bitumens, with the lowest values indicating the highest extent of biodegradation.
Conclusions
The analysis of acidic compounds found in bitumens by negative-ion ESI LTQ Orbitrap XL provides significant analytical results. Because biodegraded oils dominate the world petroleum inventory, and the production of very heavy-oil is likely to increase worldwide as light conventional oil resources are depleted, the importance of polar compound analysis (e.g., petroleomics) for heavy-oils and bitumens increases.
The LTQ Orbitrap XL results based on eight tar sand bitumen samples from the Pirambóia Formation (Paraná Basin, Brazil) show that the acidic species composition (mainly O2 class) is distinct for bitumens from different
sedimentary facies, most likely due to the different extents of biodegradation in each facies. The bitumens from the dry interdune facies have the most distinct acidic composition, with the lowest number of acidic species in the O2 and
Figure 7. A/C ratios for bitumen samples (S12 and S14 from dry interdune; S26 and S28 from dune foreset; S03 and S04 from wet interdune; S27 and S33 from dune bottomset), calculated from the sum of abundance of acyclic (DBE = 1) O2 species divided by the sum of magnitudes of the
O3 classes (mainly in the O2 class), most likely due to
depletion of these species with the further biodegradation. However, the relative abundance of the N1Oo classes is
higher in the samples that exhibit evidence of the highest degree of biodegradation, which contain biodegradation products of N-containing compounds. Moreover, the dry interdune facies presents the highest DBE ratios, a new biodegradation parameters proposed in this work, and lowest A/C ratios. These results are in agreement with results supporting the highest degree of biodegradation in the bitumens from this facies and indicate that these petroleomics parameters can be used to assess the degree of biodegradation in other bitumen samples, in which the DBE 4/DBE3, DBE 6/DBE 3, and DBE 8/DBE 3 ratios increase and the A/C ratio decreases with increasing biodegradation extent.
Acknowledgments
This work was supported by the Laboratory of Petroleum Engineering and Exploration of the North Fluminense State University (LENEP/UENF) and by the Chemistry Institute, University of Campinas (UNICAMP). Petrobras/Rede de Geoquímica also provided the necessary infrastructure to conduct this research, which was funded by ANP, Capes, and FAPERJ.
References
1. Koopmans, M. P.; Larter, S. R.; Zhang, C.; Mei, B.; Wu, T.; Chen, Y.; AAPG Bull.2002, 86, 1833.
2. Wu, Y.; Xia, Y.; Wang, Y.; Lei, T.; Chang, J.; Wang, Y.; J. Pet. Sci. Eng.2013, 103, 97.
3. Hosseini, S. H.; Shakouri, G. H.; Energy Policy2016, 91, 64. 4. Flego, C.; Carati, C.; Gaudio, L. D.; Zannoni, C.; Fuel2013,
111, 357.
5. Hein, F. J.; Leckie, D.; Larter, S.; Suter, J. R. In Heavy-Oil and
Oil-Sand Petroleum Systems in Alberta and Beyond; AAPG:
Tulsa, USA, 2013.
6. Demaison, G. J.; AAPG Bull.1977, 61, 1950.
7. Head, I. M.; Jones, D. M.; Larter, S. R.; Nature2003, 426, 344. 8. Thomaz Filho, A.; Mizusaki, M. P.; Antonioli, L.; Mar. Pet.
Geol.2008, 25, 143.
9. Araújo, C. C.; Yamamoto, J. K.; Rostirolla, S. P.; Madrucci, V.; Tankard, A.; Mar. Pet. Geol.2005, 22, 671.
10. Caetano-Chang, M. R.; Wu, F. T.; Geociências2003, 22, 33. 11. Garcia, M. A.; Ribeiro, H. J. P. S.; Souza, E. S.; Triguis, J. A.;
Geociências2011, 30, 357.
12. Palmer, S. E. In Effect of Biodegradation and Water Washing on Crude Oil Composition; Macko, S. A.; Engel, M. H., eds.; Plenum Press: New York, USA, 1993.
13. Jones, D. M.; Head, I. M.; Gray, N. D.; Adams, J. J.; Rowan, A. K.; Aitken, C. M.; Bennett, B.; Huang, H.; Brown, A.; Bowler, B. F. J.; Oldenburg, T.; Erdmann, M.; Larter, S. R.; Science 2008, 451, 176.
14. Aitken, C. M.; Jones, D. M.; Larter, S. R.; Nature2004, 8, 291. 15. Da Cruz, G. F.; Santos Neto, E. V.; Marsaioli, A. J.; Org.
Geochem.2008, 39, 1204.
16. Vasconcellos, S. P.; Crespim, E.; Cruz, G. F.; Senatore, D. B.; Simioni, K. C. M.; Santos Neto, E. V.; Marsaioli, A. J.; Oliveira, V. M.; Org. Geochem.2009, 40, 574.
17. Da Cruz, G. F.; Vasconcellos, S. P.; Angolini, C. F. F.; Dellagnezze, B. M.; Garcia, I. N. S.; De Oliveira, V. M.; Santos Neto, E. V.; Marsaioli, A. J.; AMB Express2011, 1, article 47.
18. Jones, D. M.; Head, I. M.; Gray, N. D.; Adams, J. J.; Rowa, A. K.; Aitken, C. M.; Bennett, B.; Huang, H.; Brown, A.; Bowler, B. F. J.; Nature2007, 451, 176.
19. Connan, J.; In Advances in Petroleum Geochemistry, vol. 1; Brooks, J.; Welte, D. H., eds.; Academic: London, UK, 1984. 20. Meredith, W.; Kelland, S. J.; Jones, D. M.; Org. Geochem. 2000,
31, 1059.
21. Hsu, C. S.; Drinkwater, D.; In Current Practice of Gas
Chromatography-Mass Spectrometry; Niessen, W. M. A., ed.;
Marcel Dekker: New York, USA, 2001.
22. Liao, Y.; Shi, Q.; Hsu, C. S.; Pan, Y.; Zhang, Y.; Org. Geochem.
2012, 47, 51.
23. Hughey, C. A.; Hendrickson, C. L.; Rodgers, R. P.; Marshall, A. G.; Anal. Chem. 2001, 73, 4676.
24. Marshall, A. G.; Hendrickson, C. L.; Annu. Rev. Anal. Chem. 2008, 1, 578.
25. Fenn, J. B.; Mann, M.; Meng, C. K.; Wong, S. F.; Whitehouse, C. M.; Science1989, 246, 64.
26. Robb, D. B.; Covey, T. R.; Bruins, A. P.; Anal. Chem.2000, 72, 3653.
27. Hsu, C. S.; Hendrickson, C. L.; Rodgers, R. P.; McKennam, A. M.; Marshall, A. G.; J.Mass Spectrom. 2011, 46, 337. 28. Kaiser, N. K.; McKenna, A. M.; Savory, J. J.; Hendrickson,
C. L.; Marshall, A. G.; Anal. Chem.2013, 85, 265.
29. Pomerantz, A. E.; Mullins, O. C.; Paul, G.; Ruzicka, J.; Sanders, M.; Energy Fuel2011, 25, 3077.
30. Angolini, C. F. F.; Capilla, R.; Marsaioli, A. J.; Energy Fuel 2015, 29, 4886.
31. Marshall, A. G.; Rodgers, R. P.; PNAS2008, 105, 18090. 32. Kim, S.; Stanford, L. A.; Rodgers, R. P.; Marshall, A. G.;
Walters, C. C.; Qian, K.; Wenger, L. M.; Mankiewicz, P.; Org. Geochem.2005, 36, 1117.
33. Vaz, B. G.; Silva, R. C.; Klitzke, C. F.; Simas, R. C.; Nascimento, H. D. L.; Pereira, R. C. L.; Garcia, D. F.; Eberlin, M. N.; Azevedo, D. A.; Energy Fuel 2013, 27, 1277.
35. Smith, D. F.; Schaub, T. M.; Kim, S.; Rodgers, R. P.; Rahimi, P.; Teclemariam, A.; Marshall, A. G.; Energy Fuel2008, 22, 2372.
36. Mapolelo, M. M.; Rodgers, R. P.; Blakney, G. T.; Yen, A. T.; Asomaning, S.; Marshall, A. G.; Int. J. Mass Spectrom.2011,
300, 149.
37. Martins, L. L.; Franklin, G. C.; Souza, E. S.; da Cruz, G. F.;
Quim. Nova 2014, 37, 1263.
38. Martins, L. L.; da Cruz, G. F.; Souza, E. S.; Ribeiro, H. J. P. S.;
Geochim. Bras.2015, 29, 154.
39. Koike, L.; Rebouças, L. M. C.; Reis, F. A. M.; Marsaioli, A. J.; Richnow, H. H.; Michaelis, W.; Org. Geochem.1992, 18, 851. 40. Peters, K. E.; Moldowan, J. M.; The Biomarker Guide, 1st ed.;
Prentice Hall: New York, USA, 1993.
41. Harwood, C. S.; Burchhardt, G.; Herrman, H.; Fuchs, G.; FEMS Microbiol. Rev.1998, 22, 439.
42. Wentzel, A.; Ellingsen, T. E.; Kotlar, H. K.; Zotchev, S. B.; Holst, M. T.; Appl. Microbiol. Biotechnol.2007, 76, 1209. 43. Watson, J. S.; Jones, D. M.; Swannell, R. P. J.; Van Duin,
A. C. T.; Org. Geochem. 2002, 33, 1153.
44. Shi, Q.; Zhao, S.; Xu, Z.; Chung, K. H.; Zhang, Y.; Xu, C.;
Energy Fuel2010, 24, 4005.
Submitted: March 28, 2016
Published online: August 16, 2016