ISSN 0101-8205 www.scielo.br/cam
On a discrete West Nile epidemic model
SOPHIA R.-J. JANG
Department of Mathematics, University of Louisiana at Lafayette Lafayette, LA 70504-1010 U.S.A.
E-mail: [email protected]
Abstract. A West Nile epidemic model in discrete-time is proposed. The model consists of two interacting populations, the vector and the avian populations. The avian population is
classified into susceptible, infective, and recovered classes while an individual vector is either
susceptible or infective. The transmission of the disease is assumed only by mosquitoes bites
and vertical transmission in the vector population. The model behavior depends on a lumped
parameter R0. The disease-free equilibrium is locally asymptotically stable if R0 < 1. The
system is uniformly persistent and possesses a unique endemic equilibrium if R0 >1.
Conse-quently, the disease can persist in the populations ifR0>1.
Mathematical subject classification: 92D25, 92D40, 39A11.
Key words: West Nile virus, uniform persistence, Liapunov function.
1 Introduction
West Nile virus (WNV) is a kind of arthropod-borne virus that are maintained in nature through biological transmission between susceptible vertebrate hosts and blood-feeding arthropods such as mosquitoes. Vertebrates can become in-fected when an inin-fected arthropod bites them to take a blood meal. The suscep-tible vectors then become infected once feed on an infected host.
WNV was first isolated from a woman in the West Nile District of Uganda in 1937 and has emerged in recent years in many regions of the United States and Canada. The disease presents a threat and challenge to public and ani-mal health. West Nile virus has been detected in dead birds of at least 138
species. Although birds, particularly crows and jays, infected with the virus can die or become ill, most infected birds do survive. We refer the reader to www.cdc.gov/ncidod/dvbid/westnile for more information about the virus his-tory and its ecology.
Since data collected for the West Nile virus are usually discrete, we develop a discrete-time West-Nile model to investigate evolution of the disease between mosquitoes and bird reservoir hosts. Discrete time West Nile models have been studied in [15, 17]. However, our modeling assumptions are different from that given in [15, 17]. In [15] the vector population is partitioned into larval, susceptible, exposed, and infective classes, and all the newborns are in the larval class, while in [17] the vector population also has an exposed compartment and there is no vertical transmission. Moreover, our incidence rate is different from that studied in [15, 17]. Our model derivation is based on a recent continuous-time model proposed by Cruz-Pacheco et al. [5]. Although other vertebrates such as horses and humans do become infected, these populations are not modeled here.
The resulting epidemic model is a four-dimensional system of difference equa-tions. Sufficient conditions for which solutions remain nonnegative are derived. It is shown that the disease-free equilibrium always exists. Its stability depends on a thresholdR0. The disease-free equilibrium is locally asymptotically stable ifR0<1 and unstable ifR0>1. There exists a unique endemic equilibrium and the system is uniformly persistent when R0 >1. Consequently, the WNV can persist if R0 >1. When there is no disease related death for the avian popula-tion, it can be shown that the disease-free equilibrium is globally asymptotically stable for R0≤1.
In the following section, model derivation will be presented. Section 3 provides stability analysis of the model. Numerical simulations and a brief summary are given in the last section.
2 Model derivation
pop-ulations at timet, respectively for t =0,1, . . .. We assume that the mosquito population under the period of study is a constant, Nv, and the bird population
has a constant recruitment ratea per unit time due to birth and immigration.
However, the new arrival birds are all susceptible. The death rates of avian and vector populations are denoted byµaandµv, respectively.
For simplicity, the birth rate of the vector population isµvwhich is the same
as its death rate. That is, µv is the number of births per individual per unit
time for the mosquito population. It is also assumed that the bird population in the absence of the disease is governed by the difference equation Na(t+1) = a+(1−µa)Na(t).As a result, the bird population in the absence of the disease
will always stabilize at the level(a)/(µa).
Similar to the idea used by Kermack and McKendrick [12] for modeling epi-demics, the avian population at time t is separated into three compartments: susceptibleSa(t), the healthy susceptible individuals who can contract the dis-ease, infectives Ia(t), the individuals who are infected and are infectious, and recovered Ra(t), who are cured. That is, Na(t) = Sa(t)+ Ia(t)+ Ra(t) for
t ≥0. Since mosquitos have short life span, the vector population at any given timetis only classified into susceptible,Sv(t), and infectives,Iv(t). There is no
recovered class for the vector population andSv(t)+Iv(t)=Nv>0 fort≥0.
Letbbe the average number of bites per mosquito per unit time. The trans-mission probability from vectors to birds and from birds to vectors are constants and denoted byβa andβv, respectively. Hence a bird receives on averagebNNva
bites per unit time. Therefore the infection rate per susceptible bird is
bβa Nv
Na Iv
Nv =
bβa Iv
Na,
and the infection rate per susceptible mosquito is
bβv
Ia Na.
We assume that the infected birds are recovered at a constant rate γa, and let αabe the disease related death rate for the avian population. From the data given
in [13, 16] (cf. [5]) it is reasonable to assume that
We remark that assumption (H1) may not be satisfied for some spices of birds such as American crow and blue jay. However, many other species of birds such as common grackle, house sparrow, European starling etc. do have small WNV mortality ([13]), and consequently (H1) will fit in to these particular species of birds.
Notice the average infectious period for an infected bird is
1
γa+µa+αa .
Furthermore, it is assumed that all these parametersa, µa, µv,b, βa, βv,Nv, γa
andαaare positive. Since vertical transmission of the vector population has been
found as an important mechanism in maintaining the virus in natural populations [3, 7, 10], we assume a constant fraction p, 0 ≤ p ≤ 1, of the offspring of the infectious vectors is infectious. Under these biological assumptions, the interaction between vector and avian populations are given below:
Sa(t+1) = a+(1−µa)Sa(t)− bβa
Na(t)Iv(t)Sa(t)
Ia(t+1) = bβa
Na(t)Iv(t)Sa(t)+(1−γa−µa−αa)Ia(t)
Ra(t+1) = (1−µa)Ra(t)+γaIa(t)
Na(t+1) = a+(1−µa)Na(t)−αaIa(t)
Sv(t+1) = Sv(t)+(1− p)µvIv(t)−
bβv
Na(t)Ia(t)Sv(t)
Iv(t+1) = (1−µv)Iv(t)+ pµvIv(t)+
bβv
Na(t)Ia(t)Sv(t)
Sa(0),Ia(0),Ra(0),Sv(0),Iv(0)≥0,Na(0) >0.
(2.1)
Notice as the birth and death rates of the vector population are the same and offsprings of susceptible mosquitoes are born susceptible, the equation for Sv
has the above form.
and nonnegativity of the solutions are derived using the quantitytand model parameters. Since data for the West Nile epidemics given in the literature [3, 5, 7, 10, 16] are in terms of days, our time unit is taken to be a day and model (2.1) does not involve time unitt as in [1, 2]. We now impose the following conditions on the parameters so that solutions of (2.1) will remain nonnegative as shown in Proposition 2.1.
(H2) bβaNv≤a,γa+µa+αa≤1,bβv≤1, and µv≤1.
We remark that the first three conditions in (H2) imposed on the parameters are reasonable restrictions. For example, since the time unit is taken to be one day, then according to the data given in [5, 16], we haveβa =1,b =0.75, and the
maximum values ofβvis 0.68, ofγais 0.36, ofαais 0.19, ofµais 0.0004, and
ofµv is 0.06 for a variety of bird species such as blue jay, common grackle,
American crow, house sparrow, American robin, rock dove etc. and different species of mosquitos. Therefore the first three conditions in (H2) are easily satisfied. However, we would need the total population of vector to be small or the new arrival of birds to be large in our study for the last inequality in (H2) to be true.
Proposition 2.1. Solutions of system (2.1) remain nonnegative and are bounded.
Proof. Let(Sa(t),Ia(t),Ra(t),Na(t),Sv(t),Iv(t))be a solution of (2.1) with
Sa(0),Ia(0),Ra(0),Sv(0),Iv(0) ≥ 0 and Na(0) > 0. It is sufficient to prove
nonnegativity for t = 1. Since Sa(0)+ Ia(0)+ Ra(0) = Na(0) > 0 and
Sv(0)+ Iv(0) = Nv > 0, Sa(1) ≥ a+(1−µa)Sa(0)−bβaIv(0) ≥ v+
(1−µa)Sa(0)−bβaNv ≥ (1−µa)Sa(0) ≥ 0 by (H2) and (H3). It is clear
thatIa(1),Ra(1) ≥ 0 by (H3). Moreover,Sv(1) ≥ Sv(0)+(1−p)µvIv(0)−
bβvSv(0) ≥ 0 by (H4). Similarly, Na(1) ≥ a+(1−µa−αa)Na(0) ≥ a
and Iv(1) ≥ 0 by (H3) and (H5), respectively. Therefore, solutions of (2.1)
remain nonnegative by induction.
NoticeNa(t+1)≤a+(1−µa)Na(t)fort≥0 implies
lim sup
t→∞
AsSa(t),Ia(t),Ra(t)are nonnegative and satisfySa(t)+Ia(t)+Ra(t)=Na(t)
fort ≥0, we have
lim sup
t→∞
Sa(t)≤ a µa
, lim sup
t→∞
Ia(t)≤ a µa
, and lim sup
t→∞
Ra(t)≤ a µa .
Moreover, since Sv(t+1)+ Iv(t +1) = Nv fort ≥ 0 and solutions remain
nonnegative, Sv(t),Iv(t) ≤ Nv for t ≥ 0. Therefore, solutions of (2.1) are
bounded.
It follows from the proof of Proposition 2.1 that Na(t) ≥ a for t ≥ 1
if Na(0) > 0. Therefore system (2.1) is well-defined. Furthermore, since
Ia(t)+Sa(t)+Ra(t)= Na(t)andSv(t)+Iv(t)=Nvfort≥0 from modeling
assumptions, we are able to reduce the dimension of system (2.1) so that sys-tem (2.1) is equivalent to the following four-dimensional syssys-tem of difference equations
Sa(t+1) = a+(1−µa)Sa(t)− bβa
Na(t)Iv(t)Sa(t)
Ia(t+1) = bβa
Na(t)Iv(t)Sa(t)+(1−γa−µa−αa)Ia(t)
Na(t+1) = a+(1−µa)Na(t)−αaIa(t)
Iv(t+1) = (1−µv)Iv(t)+pµvIv(t)+
bβv
Na(t)Ia(t)(Nv−Iv(t))
Sa(0),Ia(0),Iv(0)≥0,Na(0) >0.
(2.2)
3 Mathematical analysis
We first study the existence of steady state solutions of (2.2). Clearly there always exists a trivial steady state E0 = a
µa,0,
a
µa,0
, the disease-free equilibrium. The Jacobian matrix of (2.2) evaluated at E0has the following form
J(E0)=
1−µa 0 0 −bβa
0 1−γa−µa−αa 0 bβa
0 −αa 1−µa 0
0 µabβvNv/a 0 1−(1−p)µv
LetJ1be the lower 3×3 submatrix of J(E0). ThenJ1is similar to
1−γa−µa−αa bβa 0
µabβvNv/a 1−(1−p)µv 0
−αa 0 1−µa
. (3.2)
Therefore eigenvalues of J(E0)are 1−µaof multiplicity 2 and eigenvalues of
J2=
1−γa−µa−αa bβa µabβvNv/a 1−(1−p)µv
. (3.3)
Notice
trJ2=2−γa−µa−αa−(1−p)µv
and
detJ2=(1−γa−µa−αa)[1−(1−p)µv] −
b2µ
aNvβvβa a
.
Jury conditions imply that eigenvalues λ of J2 satisfy|λ| < 1 if and only if |trJ2|< 1+detJ2 <2 [8]. It follows from (H2) that trJ2 > 0 and thus we need to verify trJ2<1+detJ2<2 for the local stability ofE0.
Notice detJ2 < 1 is trivially true and thus 1+detJ2 < 2 holds. To verify trJ2 <1+detJ2we shall separate our discussion into two cases: 0 ≤ p < 1 and p=1. When 0≤ p<1, a simple computation yields
trJ2<1+detJ2if and only if b
2µ
aNvβaβv
aµv(1− p)(γa+µa+αa) <1.
Let
R0 = b
2µ
aNvβaβv
aµv(1−p)(γa+µa+αa)
. (3.4)
It follows that E0 is locally asymptotically stable if R0 < 1, and unstable if
R0>1. When p=1,
trJ2=2−γa−µa−αa and detJ2=1−γa−µa−αa−
b2µaNvβvβa a
.
Therefore trJ2<1+detJ2if and only if
2−γa−µa−αa <2−γa−µa−αa− b2µ
aNvβvβa a
The above inequality is never valid. ThereforeE0is always unstable whenp=1. Observe that bµaNvβv
a(γa+µa+αa) can be interpreted as the number of infections
pro-duced by a single infected bird during its infectious period in a susceptible mosquito population when the avian population is stabilized at the population levela/µa. Similarly,(1−bβpa)µ
v is the number of infections produced by a single
infectious mosquito during its lifetime in a susceptible avian population. There-fore,√R0, the geometric mean of these two quantities, may be regarded as the basic reproductive number of the disease.
We proceed to examine the existence of an interior steady state. An interior steady state(Sa¯ ,Ia¯ ,Na¯ ,I¯v)must satisfy
a−µaSa¯ − bβa
¯
Na I¯vSa¯ = 0 bβa
¯
Na I¯vSa¯ −(γa+µa+αa)Ia¯ = 0
a−µaNa¯ −αaIa¯ = 0
−µvI¯v+ pµvI¯v+
bβv
¯
Na Ia¯ (Nv− ¯Iv) = 0.
(3.5)
Adding the first two equations of (3.5) resulting
a−µaSa¯ −(γa+µa+αa)Ia¯ =0.
Let
A=γa+µa+αa.
Then
¯
Sa= a−AIa¯ µa
,
andSa¯ >0 if and only ifIa¯ < a
A . The third and fourth equilibrium equations
imply
¯
Na= a−αaIa¯ µa
,
and
¯
Iv=
bβvµaNvIa¯
(a−αaIa¯ )(1−p)µv+µabβvIa¯
Substituting these into the second equilibrium equation we have for 0≤ p<1, ¯
Ia>0 must satisfy
ˆ
Ax2+ ˆBx+ ˆC = 0, (3.6)
where
ˆ
A = αa
bµaβv−(1− p)αaµv
,
ˆ
B = 2a(1−p)µvαa−baµaβv−(1−p)AaµvR0, and
ˆ
C =a2µv(1− p)(R0−1).
Let
f(x)= ˆAx2+ ˆBx+ ˆC.
Notice
f(0)= ˆC
and since A=αa+γa+µa,
f
a A
= 1
A2
b2aµaβv(αa−A)−(1−p)2aµv(A−αa)2
<0.
When R0 <1,Cˆ <0 and hence for f(x)to have at least one positive root in
(0, a/A)it is necessary that
ˆ
A<0< − ˆB
2Aˆ < a
A and Bˆ 2
−4AˆCˆ >0.
Notice that the last inequality is equivalent to − ˆB 2Aˆ >
−2Cˆ
ˆ
B , and
−2Cˆ
ˆ
B > a
A
if and only if
bµaβv−Aµv(1− p)R0+2(µa+γa)µv(1−p) >0.
for (3.6) in(0, a/A)if 0 ≤ p < 1 and R0 < 1. Consequently, system (2.2)
has no interior steady state if 0≤ p<1 andR0<1.
On the other hand if R0 > 1 then since Cˆ > 0 and f(a/A) < 0, it is
clear that (3.6) has a unique solution Ia¯ ∈(0, a/A). As a result, system (2.2)
has a unique endemic equilibrium E1 = (Sa¯ ,Ia¯,Na¯ ,I¯v) if 0 ≤ p < 1 and
R0 >1. If 0 ≤ p <1 and R0 =1, thenCˆ =0 and f(x)= 0 has solutions 0 and− ˆB/Aˆ. NoticeBˆ =a(1−p)µvαa−(1−p)(µa+γa)aµv−baµaβv<0
by (H1). If Aˆ >0 then it is straightforward to show that− ˆB/Aˆ > a/A, and
if Aˆ <0 then it is trivial that− ˆB/Aˆ <0. Therefore if 0≤ p<1 andR0=1, there is no feasibleIa¯. We conclude that system (2.2) has no interior steady state if 0≤ p<1 and R0≤1, and has a unique endemic equilibrium ifR0>1.
When p = 1, the threshold R0in (3.4) is not defined and the Ia-component, ¯
Ia>0, of an interior steady state must satisfy (3.6) with
ˆ
A=αabµaβv,Cˆ =
b2βaβvµaNva A
and
ˆ
B = −baµaβv−b2βaβvµaNv.
Since Aˆ > 0, Cˆ > 0 and f(a/A) < 0, f(x) = 0 has a unique solution
¯
Ia in(0, a/A). Consequently, (2.2) has a unique endemic equilibrium E1 = (Sa¯ ,Ia¯ ,Na¯ ,I¯v)when p=1. Recall in this case that the disease-free equilibrium
E0 = (a/µa,0, a/µa,0)is unstable. The above discussion is summarized
below.
Proposition 3.1. If0≤ p <1andR0≤1, thenE0=(a/µa,0, a/µa,0)
is the only equilibrium and E0 is locally asymptotically stable if R0 < 1. If 0 ≤ p < 1 and R0 > 1, then E0 is unstable and system(2.2)has a unique interior steady stateE1=(Sa¯ ,Ia¯ ,Na¯ ,I¯v). Ifp=1, thenE0is unstable andE1
exists for(2.2).
Our next goal is to determine local stability of the steady state E1. When
system (2.2) evaluated atE1has the following form
J(E1)=
1−µa−bβaNv/Na¯ 0 bβaNvSa¯ /N¯a2 −bβaSa¯ /Na¯ bβaNv/Na¯ 1−A −bβaNvSa¯ /N¯a2 bβaSa¯ /Na¯
0 −αa 1−µa 0
0 0 0 1−bβvIa¯ /Na¯
.
Clearly 1−bβvIa¯/Na¯ is an eigenvalue of J(E1)which is less than 1 but greater
than zero by (H4). The upper 3×3 submatrix of J(E1)−λI is similar to the following matrix
ˆ
J =
1−µa−λ 1− A−λ 0
bβaNv/Na¯ 1− A−λ −bβaNvSa¯ /N¯a2
0 −αa 1−µa−λ
.
Using the third row expansion we see that 1−µais another eigenvalue and the
rest of the two eigenvalues satisfy
λ2+trJ¯λ+detJ¯=0,
where
trJ¯=bβaNv/Na¯ −2+µa+A
and
detJ¯=(1−A)(1−µa)−bαaβaNvSa¯ /N¯a2−(1−A)bβaNv/Na¯ .
Since detJˆ<1, applying the Jury conditions, we need to very that−1−detJ¯<
trJ¯ <1+detJ¯. A straightforward calculation yields trJ¯ < 1+detJ¯if and only if
Aµa+
AbβaNv
¯
Na −
bαaβaSa¯ Nv
¯
N2 a
>0.
Since Sa¯ < Na¯ and A > αa, the above inequality is clearly true. Moreover,
−1−detJ¯<trJ¯if and only if
−µaA+(1−A) bβaNv
¯
Na +
bαaβaNvSa¯
¯
N2 a
< bβaNv
¯
Na .
This inequality also holds as A > αa and Sa¯ < Na¯ . We now summarize our
Proposition 3.2. System (2.2)has steady states E0 = (a/µa,0, a/µa,0)
andE1 =(Sa¯ ,Ia¯,Na¯ ,I¯v)when p =1, where E0is unstable and E1is locally
asymptotically stable.
It is not easy to verify whether the endemic-equilibrium E1is locally asymp-totically stable when 0 ≤ p < 1 and R0 > 1. We show that the disease can persist by showing that the system is uniformly persistent. We first briefly dis-cuss terminology used in Hofbauer and So [11] which will be adopted for our analysis. Let(X,d)be a metric space and h : X → X be continuous with a closed subspaceYsuch thatX\Yis forward invariant underh. It is assumed that
X has a global attractorA. Let M be the maximal compact invariant set inY.
Thenh is uniformly persistent (with respect toY) i.e., there existsm >0 such that lim inft→∞d(ht(x),Y) >mfor allx ∈ X\Y if and only if Mis isolated inAandWs(M)= {x ∈ X :ht(x)→Mast → ∞} ⊂Y [11, Theorem 4.1].
Theorem 3.3. System (2.2) is uniformly persistent if either0 ≤ p < 1and
R0>1or if p=1.
Proof. Let X = R4
+ andY = ∂R4+, the boundary of X. Let H denote the map induced by system (2.2). It follows from the proof of Proposition 2.1 thatSa(t),Ia(t),Na(t),Iv(t) > 0 fort ≥ 1 if the initial condition is positive.
Therefore X \Y is positively invariant for system (2.2). Clearly system (2.2) has a global attractor and the only invariant set inY is{E0}, which is moreover isolated in{(Sa,Ia,Na,Iv)∈R4+:Sa+Ia≤a/µa,Na ≤a/µa,Iv ≤ Nv}.
To showWs({E0}) ⊂ Y, suppose on the contrary that there exists a solution
(Sa(t),Ia(t),Na(t),Iv(t))withSa(0) >0,Ia(0) > 0,Na(0) >0, and Iv(0) >
0 such that limt→∞Sa(t) = limt→∞Na(t) = a/µa and limt→∞Ia(t) = limt→∞Iv(t)=0. Then for anyǫ >0 there existst0>0 such that
1−ǫ < Sa(t)
Na(t) <1+ǫ,0< Ia(t),Iv(t) < ǫ, andNa(t) < a/µa+ǫ
for t ≥ t0. We first consider the case when 0 ≤ p < 1 and R0 > 1. Since
R0>1, we can chooseǫ >0 such that
b2µaβaβv(Nv−ǫ)(1−ǫ)
(a+ǫµa)µv(1−p)(γa+µa+αa)
We have by system (2.2) that
Ia(t+1)≥bβa(1−ǫ)Iv(t)+(1−γa−µa−αa)Ia(t)
Iv(t+1)≥
bβv
a/µa+ǫ
(Nv−ǫ)Ia(t)+ [1−(1−p)µv]Iv(t)
fort ≥t0. Consider the following linear system
x(t+1)=(1−γa−µa−αa)x(t)+bβa(1−ǫ)y(t)
y(t+1)= bβvµa a+ǫµa
(Nv−ǫ)x(t)+ [1−(1−p)µv]y(t)
x(t0)= Ia(t0),y(t0)=Iv(t0).
(3.8)
LetAdenote the map induced by system (3.8). Notice each entry ofAis positive and it follows from (3.7) that the spectral radius ofAis larger than unity. Since
x(t0) = Ia(t0) > 0 and y(t0) = Iv(t0) > 0, solutions of (3.8) are unbounded.
As a result,Ia(t)andIv(t)also become unbounded large ast→ ∞. We obtain
a contradiction and conclude that Ws({E0}) ⊂ Y. Therefore, system (2.2) is
uniformly persistent with respect toYby [11, Theorem 4.1], i.e., there existsm>
0 such that lim inft→∞Sa(t) ≥ m, lim inft→∞Ia(t) ≥ m, lim inft→∞Na(t)≥ m and lim inft→∞Iv(t) ≥ m for any solution (Sa(t),Ia(t),Na(t),Iv(t)) with
positive initial condition. The case when p = 1 can be shown similarly using instability ofE0.
Although it is known that the crow family of birds have very high WNV mortality rate, the mortality rate of some other species of birds such as house barrow and common grackle are usually very small. In particular, European starling, rock dove, American robin, and several other species of birds have zero WNV mortality rate as shown in an experimental study by Komar [13]. Therefore, it is reasonable to consider the special case when there is no WNV related mortality for the avian population. In this situation limt→∞Na(t) =
a/µaand (2.2) has the following three-dimensional limiting system
Sa(t+1) = a+(1−µa)Sa(t)− bβaµa
a
Iv(t)Sa(t)
Ia(t+1) = bβaµa a
Iv(t)Sa(t)+(1−γa−µa)Ia(t)
Iv(t+1) = (1−µv)Iv(t)+pµvIv(t)+
bβvµa a
Ia(t)(Nv−Iv(t))
Sa(0),Ia(0),Iv(0)≥0.
NoticeR0becomes
R0= b
2µ
aNvβaβv
aµv(1−p)(γa+µa) .
We show that the disease-free equilibrium (a/µa,0, a/µa,0) is globally
asymptotically stable for (2.2) if 0≤ p<1 andR0≤1.
Theorem 3.4. The disease-free equilibriumE0=(a/µa,0, a/µa,0)is the
only equilibrium which is moreover globally asymptotically stable for system (2.2)ifαa=0,0≤ p<1, and R0≤1.
Proof. It is clear that (2.2) has only the disease-free equilibrium. SinceSa(t)+ Ia(t)≤a/µaandIv(t)≤ Nvfort ≥0, we let
=
(x,y,z)∈R3+:x+y ≤ a µa
,z ≤ Nv
.
We construct a Liapunov functionV
V :→R+byV(Sa,Ia,Iv)= ˜A
a µa −
Sa
+ ˜B Ia+ ˜C Iv,
where nonnegative A˜,B˜ andC˜ will be determined later. LetGdenote the map induced by system (3.9). ThenV ≥0 onand
V(G(Sa,Ia,Iv)) ≤ ˜A(1−µa) a µa +
˜
B(1−γa−µa)+ ˜C bβvµa
a Nv
Ia
+ ˜
Abβa+ ˜Bbβa+ ˜C(1−µv)+ ˜C pµv
Iv.
We choose A˜ =0. ThenB˜ andC˜ must satisfy
˜
B(1−γa−µa)+ ˜C bβvµa
a
Nv≤ ˜B and Bb˜ βa+ ˜C(1−µv+pµv)≤ ˜C.
We now let
˜
C =1 and B˜ = bβvµaNv a(γa+µa)
.
LetM = {(Sa,Ia,Iv)∈ :V(G(Sa,Ia,Iv)) = V(Sa,Ia,Iv)}. ThenM =
{(Sa,Ia,Iv)∈:Ia =Iv=0}and the only invariant set inMis(a/µa,0,0).
Therefore,(a/µa,0,0)is globally asymptotically stable for system (3.9) by
the LaSalle’s invariance principle [8, 14]. Since the limiting system (3.9) has only one equilibrium which is moreover globally asymptotically stable when
R0 ≤1, applying [6], we conclude that the disease-free equilibrium is globally asymptotically stable for system (2.2) whenαa=0, 0≤ p<1, and R0≤1.
4 Discussion
It is showed in the previous section that the West Nile virus can be wiped out when R0 ≤ 1 andµa = 0, and the disease can persist within the populations
whenR0>1. Although it is proved that the disease-free equilibrium is globally asymptotically stable ifµa = 0, 0 ≤ p < 1 and R0 ≤ 1, it is suspected that
the disease-free equilibrium is globally asymptotically when R0 < 1,µa >0,
and 0≤ p<1. Since stability analysis does not provide any information about the transient behavior of the model which may be very important in terms of eradication and management plans, we next use simple numerical methods to study (2.2).
To simulate model (2.2), we adopt the following parameter values: a =140, γa = 0.1, αa = 0.1,µa = 0.02,b = 0.7, βa = 1.0, βv = 0.38, µv = 0.06,
Nv = 200 and p = 0.2. Initial conditions are chosen to be Sa(0) = 1000,
Ia(0) = 0, Na(0) = 1000 and Iv(0) = 100 for all simulations presented.
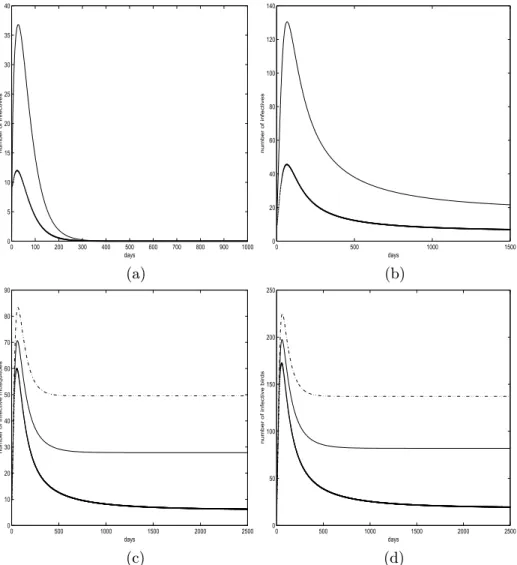
Notice in this case thatR0=0.5038<1 and system (2.2) has only the disease-free equilibrium. Simulations for this set of parameter values are plotted in Figure 1(a). Both infected populations go to a peak at approximately the same time before they are diminished. Therefore there is a serge of the disease for a short period of time even when R0<1.
We next keep the same parameter values but change βv from 0.38 to 0.78.
Then R0 = 1.0341 > 1 and system (2.2) has a unique endemic equilibrium according to Theorem 3.3. The time evolution of the infected populations are plotted in Figure 1(b). It can be seen that both infected populations also in-crease before they dein-crease to the equilibrium levels for initial conditions with
to equilibrium levels with increasing time. It is known that vertical transmis-sion of virus in the vector population is an important factor for contributing the spread of the disease [3, 7, 10]. We shall investigate this factor using our built model. We vary the parameter value p with the above fixed parameter values so that R0 >1. When p =0.2, it is calculated R0 = 1.0341, when p = 0.3,
R0 =1.1818, andR0=1.3788 when p=0.4. The resulting time series of the infected mosquitoes and birds are plotted in Figure 1 (c) and (d) respectively. We see from these two plots that increasing the vertical transmission rate p in-creases the equilibrium levels and hence inin-creases severity of the epidemics as the peaks of infectives increase with increasing p. However, the time that these peaks occurred is approximately independent of p.
In this manuscript, a simple West Nile epidemic model in discrete-time is pro-posed and analyzed. Our modeling assumptions are based on a continuous-time model developed by Cruz-Pacheco et al. [5]. In particular, the avian population in the absence of the disease is stabilized in a constant population level and the transmission of the virus is either through infected mosquito bites or natural birth of infected vectors. The dynamics of the epidemics depend on a lumped param-eter R0. The disease-free equilibrium E0is the only equilibrium and is locally asymptotically stable if R0 <1. It is proved thatE0is globally asymptotically stable when there is no disease related mortality for the avian population and
this situation there will be a severe outbreak of the disease in the beginning of the epidemic.
0 100 200 300 400 500 600 700 800 900 1000
0 5 10 15 20 25 30 35 40 days n u mb e r o f in fe ct ive s
0 500 1000 1500
0 20 40 60 80 100 120 140 days n u mb e r o f in fe ct ive s (a) (b)
0 500 1000 1500 2000 2500
0 10 20 30 40 50 60 70 80 90 days n u mb e r o f in fe ct ive mo sq u it o e s
0 500 1000 1500 2000 2500
0 50 100 150 200 250 days n u mb e r o f in fe ct ive b ird s (c) (d)
Figure 1 – (a) and (b) plot infective populations whenR0<1 andR0>1, respectively.
The solid lines are for the mosquito population and the dotted lines are for the bird
population. (c) and (d) plot number of infective mosquitoes and birds versus time for different values of p, respectively. Solid lines are for p = 0.2, dotted lines are for
REFERENCES
[1] L. Allen,Some discrete-time SI, SIR and SIS epidemic models. Math. Biosci.,124(1994), 83–97.
[2] L. Allen,Comparison of deterministic and stochastic SIS and SIR models in discrete time. Math. Biosci.,163(2000), 1–33.
[3] S. Baqar, C. Hayes, J. Murphy and D. Watts,Vertical transmission of West Nile Virus by Culex and Aedes species mosquitoes. Am. J. Trop. Med. Hyg.,48(2002), 757–762.
[4] http://www.cdc.gov/ncidod/dvbid/westnile
[5] G. Cruz-Pacheco, L. Esteva, J. Montano-Hirose and C. Vargas,Modelling the dynamics of West Nile virus. Bull. Math. Biol.,67(2005), 1157–1172.
[6] J.M. Cushing,A strong ergodic theorem for some nonlinear matrix models for the dynamics of structured population. Natural Resources Modeling,3(1989), 331–357.
[7] D. Dohm, M. Sardelis and M. Turell,Experimental vertical transmission of West Nile Virus by Culex pipiens. J. Med. Entomol.,39(2002), 640–644.
[8] S. Elaydi,An Introduction to Difference Equations. Second Edition, Springer, New York, 1999.
[9] J. Franke and A. Yakubu,Discrete-time SIS epidemic models in a seasonal environment. SIAM Appl. Math.,66(2006), 1563–1587.
[10] L. Goddard, A. Roth, W. Reisen and T. Scott,Vertical transmission of West Nile Virus by three California Culex species. J. Med. Entomol.,40(2003), 743–746.
[11] J. Hofbauer and J. So,Uniform persistence and repellors for maps. Proc. Am. Math. Soc.,
107(1989), 1129–1142.
[12] W.O. Kermack and A.G. McKendrick,A contribution to the mathematical theory of epi-demics. Proc. Roy. Soc. London Ser. A,115(1927), 700–721.
[13] N. Komar, WNV vertebrate ecology and biology-birds, 2003. www.cdc.gov/ncidod/dvbid/ westnile/conf/pdf/Komar4th03.pdf.
[14] J.P. LaSalle,The Stability of Dynamical Systems. SIAM, 1976.
[15] M.A. Lewis, J. Renclawowicz, P. van Den Driessche and W. Marjorie,A comparison of continuous and discrete time West Nile virus models. Bull. Math. Bio.,68(2006), 491–509.
[16] http://www.animaldiversity.ummz.umich.edu. The University of Michigan Museum of Zoology.