CLINICAL SCIENCE
Effects of arterial oxygen tension and cardiac output
on venous saturation: a mathematical modeling
approach
Fernando Godinho Zampieri,I,IIMarcelo Park,I,IIILuciano Ce´sar Pontes Azevedo,I,IIIMarcelo Britto Passos Amato,IVEduardo Leite Vieira CostaIII,IV
IHospital das Clı´nicas da Faculdade de Medicina da Universidade de Sa˜o Paulo, Emergency Medicine Discipline, Intensive Care Unit, Sa˜o Paulo/SP, Brazil.
IIHospital Alema˜o Oswaldo Cruz, Sa˜o Paulo/SP, Brazil.IIIHospital Sı´rio-Libaneˆs, Research and Education Institute, Sa˜o Paulo, Brazil.IVHospital das Clı´nicas
da Faculdade de Medicina da Universidade de Sa˜o Paulo, Cardio-Pulmonary Department, Pulmonary Divison, Respiratory Intensive Care Unit, Sa˜o Paulo/ SP, Brazil.
OBJECTIVES: Hemodynamic support is aimed at providing adequate O2delivery to the tissues; most interventions
target O2delivery increase. Mixed venous O2saturation is a frequently used parameter to evaluate the adequacy of
O2delivery.
METHODS:We describe a mathematical model to compare the effects of increasing O2delivery on venous oxygen
saturation through increases in the inspired O2fraction versus increases in cardiac output. The model was created
based on the lungs, which were divided into shunted and non-shunted areas, and on seven peripheral compartments, each with normal values of perfusion, optimal oxygen consumption, and critical O2 extraction
rate. O2delivery was increased by changing the inspired fraction of oxygen from 0.21 to 1.0 in steps of 0.1 under
conditions of low (2.0 L.min-1) or normal (6.5 L.min-1) cardiac output. The same O
2 delivery values were also
obtained by maintaining a fixed O2inspired fraction value of 0.21 while changing cardiac output.
RESULTS: Venous oxygen saturation was higher when produced through increases in inspired O2fraction versus
increases in cardiac output, even at the same O2delivery and consumption values. Specifically, at high inspired O2
fractions, the measured O2saturation values failed to detect conditions of low oxygen supply.
CONCLUSIONS:The mode of O2delivery optimization, specifically increases in the fraction of inspired oxygen versus
increases in cardiac output, can compromise the capability of the ‘‘venous O2saturation’’ parameter to measure the
adequacy of oxygen supply. Consequently, venous saturation at high inspired O2fractions should be interpreted
with caution.
KEYWORDS: Mathematical Modeling; Central Venous Saturation, Cardiac Output.
Zampieri FG, Park M, Azevedo LC, Amato MB, Costa EL. Effects of arterial oxygen tension and cardiac output on venous saturation: a mathematical modeling approach. Clinics. 2012;67(8):897-900.
Received for publication onFebruary 27, 2012;First review completed onMarch 22, 2012;Accepted for publication onApril 8, 2012
E-mail: [email protected]
Tel.: 55 11 2661-6457
INTRODUCTION
The ultimate goal of hemodynamic support is to provide enough oxygen delivery (DO2) to guarantee tissue oxygen
needs and avoid organ dysfunction (1,2). Under normal conditions, DO2exceeds oxygen consumption (VO2) to an
extent that makes consumption independent of delivery (3,4). However, during regional low delivery, oxygen consumption becomes supply dependent (3-5). Oxygen delivery depends on the hemoglobin concentration (Hb),
hemoglobin oxygen affinity, arterial partial pressure of oxygen (PaO2), and cardiac output (CO). It is possible to
achieve comparable changes in DO2by manipulating these
variables within physiological limits, although the impact on VO2might depend on what parameter is modified (6).
Measuring oxygen consumption at the bedside is com-plex. Therefore, surrogates of the adequacy of oxygen delivery, such as lactate concentration, venous partial pressure of oxygen (PvO2), and mixed (SvO2) or central
venous oxygen saturation, are commonly used during routine patient care (1,5,7). Venous oxygen saturation is part of the current guidelines for early resuscitation during sepsis (7). Nevertheless, SvO2 can respond differently to
changes in DO2if the changes are obtained through changes
in different component of the DO2equation (8), even when
these changes lead to similar VO2values. In this paper, we
developed a mathematical model to investigate whether the
Copyrightß2012CLINICS– This is an Open Access article distributed under the terms of the Creative Commons Attribution Non-Commercial License (http:// creativecommons.org/licenses/by-nc/3.0/) which permits unrestricted non-commercial use, distribution, and reproduction in any medium, provided the original work is properly cited.
No potential conflict of interest was reported.
CLINICS 2012;67(8):897-900 DOI:10.6061/clinics/2012(08)07
type of DO2 optimization, specifically increases in the
arterial partial pressure of oxygen versus increases in cardiac output, would have different effects on SvO2.
METHODS
The mathematical model was created based on the lungs and on seven peripheral compartments. Lung blood flow was divided into shunted and non-shunted areas. The peripheral compartments, each with its own perfusion, optimal VO2, and critical oxygen extraction rate, were
created to simulate the behavior of the flow to organs. Having multiple peripheral compartments in the model was important to simulate the heterogeneity of the oxygen supply/demand in different organs and tissues to repro-duce the complex relationship between mixed venous oxygen saturation and oxygen delivery.
In all of the following notations, ‘‘x’’ represents venous (‘‘v’’), lung capillary (‘‘c’’) or arterial blood (‘‘a’’).
Hemoglobin oxygen saturation (SxO2) was calculated
according to equation 1 (9):
SxO2~ PxO32z150:PxO2
{1
:23,400
h i
z1
n o{1
ð1Þ
Blood oxygen content (CxO2) was calculated according to
a standard formula (equation 2) (9):
CxO2~1:36|Hb|SxO2z0:0031|PxO2 ð2Þ
Lungs: The alveolar partial pressure of oxygen was calculated using the alveolar gas equation (equation 3) and used as an approximation of the capillary partial pressure of oxygen (10):
PcO2~ð760{47Þ:FiO2{PaCO2 ð3Þ
As mentioned, the lungs were composed of shunted and non-shunted areas. Solving Berggren’s shunt equation for CaO2 gives the following equation (where Fshunt is the
pulmonary shunt fraction):
CaO2~CcO2:ð1{FshuntÞzCvO2:Fshunt ð4Þ
DO2 and VO2 in the peripheral compartments: We used
seven compartments to simulate blood flow to the brain, heart, kidneys, muscles, splanchnic (liver), skin, and ‘others’, each with normal values of perfusion fraction, extraction rate, and optimal oxygen consumption (VO2optimal) (11). Because
the arterial oxygen content was the same for all compart-ments, differences in oxygen supply from one compartment to the other occurred through differences in regional perfusion. For each compartment, the oxygen consumption was calculated according to equation 5:
VO2~DO2
:ER if DO2:ERvVO2optimal VO2~VO2optimal if DO2
:ER§VO2optimal
n
ð5Þ
The mathematical model:The input variables for the model included global values of cardiac output, pulmonary shunt fraction, pH, arterial carbon dioxide tension, Hb, and fraction of inspired oxygen. Additionally, we supplied hemo-dynamic variables for each compartment, including its
perfusion fraction, its critical oxygen extraction rate and optimal VO2.
In the first run of the model, mixed venous oxygen saturation and mixed venous content were calculated according to equation 1 using an arbitrary initial mixed venous oxygen partial pressure of 40 mmHg. Pulmonary capillary oxygen content was obtained through equations 2 and 3, and arterial oxygen content was estimated according to the pulmonary shunt fraction (equation 4). Oxygen delivery to each compartment was subsequently calculated by multiplying the compartment perfusion fraction by the global oxygen delivery.
A new venous oxygen content value for each compart-ment was then calculated using equation 6, and the global mixed venous oxygen content was obtained from a perfusion-weighted average of the local venous contents (equation 7).
CvO2(n)~
DO2(n){VO2(n)
Q(n):CO
ð6Þ
CvO2~
X7
n~1
CvO2(n):Q(n) ð7Þ
The mixed venous partial pressure of oxygen was determined from the mixed venous oxygen content by solving equations 1 and 2 to an acceptable error of 1:1,000 using the Newton-Raphson method. The new calculated value of the mixed venous partial pressure of oxygen was then reentered into the model, replacing the initial guess. We repeated these calculations until the difference between successive approximations of the mixed venous partial pressure of oxygen values was less than 1:1,000 of the previous value. The model outputted compartment and global final values of both the arterial and venous partial pressures of oxygen and saturation values.
The model was designed using The R Project for Statis-tical Computing (www.r-project.org) with the rootsolve package.
RESULTS
In all simulations, we maintained the following constant global values: Hb 14 g/dL, PaCO240 mmHg, pH 7.40, and
a pulmonary shunt fraction of 0.1. Normal values of the perfusion fraction, which were critical for the oxygen extraction rate and optimal oxygen consumption, were also provided for each peripheral compartment (11).
We modeled two different states: normal-high and low oxygen delivery. For each of these states, we varied the oxygen delivery by changing the FiO2with a fixed CO and
changing the CO with a fixed FiO2. The first step was to
obtain increasing DO2 values by changing the FiO2 from
0.21 to 1.00 in steps of 0.10 (with the exception of the first step = 0.09) with two values of cardiac output: 1) CO = 2.0 L.min-1 (low oxygen delivery) and 2) CO = 6.5 L.min-1 (normal-high oxygen delivery). In the next step, with a constant fraction of inspired oxygen (0.21), we chose cardiac output values to match the DO2 obtained in the previous
step. In the normal-high delivery state, oxygen demands were always met (VO2$197 mL.min-1), whereas in the low
Effects of arterial tension on SvO2
Zampieri FG et al. CLINICS 2012;67(8):897-900
delivery state, the oxygen supplies were insufficient to meet the oxygen demands (VO2,197 mL.min-1).
Normal-high supply set under this set of conditions, we simulated increases in DO2 under optimal oxygen
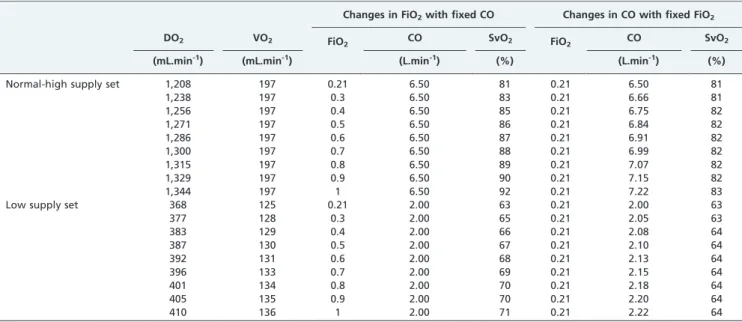
consumption to all compartments (Table 1). The increase in CO caused a proportional increase in DO2, as expected.
Conversely, DO2could only be increased by 11% by nearly
quintupling FiO2 from 0.21 to 1.0. This increase led to a
change in SvO2from 81 to 92%; in contrast, when the same
increase in DO2 was accomplished by increasing CO, the
SvO2 only increased from 81 to 83%. In fact, even a 50%
increase in DO2(Figure 1A) accomplished through
augment-ing CO alone only increased SvO2to 86%. Of note, for this set
of conditions, the peripheral compartments could have been easily lumped together with no loss of information because VO2was constant among the different conditions simulated. Table 1 -Effect of increasing the oxygen delivery on oxygen venous saturation by manipulating either the inspired fraction of oxygen or the cardiac output.
Changes in FiO2with fixed CO Changes in CO with fixed FiO2
DO2 VO2 FiO2 CO SvO2 FiO2 CO SvO2
(mL.min-1) (mL.min-1) (L.min-1) (%) (L.min-1) (%)
Normal-high supply set 1,208 197 0.21 6.50 81 0.21 6.50 81
1,238 197 0.3 6.50 83 0.21 6.66 81
1,256 197 0.4 6.50 85 0.21 6.75 82
1,271 197 0.5 6.50 86 0.21 6.84 82
1,286 197 0.6 6.50 87 0.21 6.91 82
1,300 197 0.7 6.50 88 0.21 6.99 82
1,315 197 0.8 6.50 89 0.21 7.07 82
1,329 197 0.9 6.50 90 0.21 7.15 82
1,344 197 1 6.50 92 0.21 7.22 83
Low supply set 368 125 0.21 2.00 63 0.21 2.00 63
377 128 0.3 2.00 65 0.21 2.05 63
383 129 0.4 2.00 66 0.21 2.08 64
387 130 0.5 2.00 67 0.21 2.10 64
392 131 0.6 2.00 68 0.21 2.13 64
396 133 0.7 2.00 69 0.21 2.15 64
401 134 0.8 2.00 70 0.21 2.18 64
405 135 0.9 2.00 70 0.21 2.20 64
410 136 1 2.00 71 0.21 2.22 64
CO: cardiac output; DO2: oxygen delivery; FiO2: inspired fraction of oxygen; SvO2: venous oxygen saturation; VO2: oxygen consumption.
Figure 1 - Panel A: Effect of increasing DO2on the SvO2through changes in the inspired fraction of oxygen (FiO2, solid line) or cardiac output (dashed line) under normal and high oxygen supply conditions sufficient to attain optimal oxygen consumption in all peripheral compartments.Panel B: Effect of increasing DO2on the SvO2through changes in the inspired fraction of oxygen (FiO2, solid line) or cardiac output (dashed line) under low oxygen supply conditions that caused the oxygen consumption to be supply limited.
CLINICS 2012;67(8):897-900 Effects of arterial tension on SvO2
Zampieri FG et al.
Low supply set
When VO2was supply limited, the relation between DO2
and SvO2 became more complex as a consequence of the
critical extraction rates being reached at different DO2
values (Table 1 and Figure 1). Interestingly, the modest 11% increase in DO2 produced by augmenting FiO2 markedly
increased SvO2 to values above 70%, masking the 31%
deficit of VO2present at an FiO2of 1.0 (Table 1). In contrast,
increasing DO2by the same amount by improving CO led to
an SvO2of 64%, indicating insufficient oxygen supply.
DISCUSSION
In this paper, we showed that when oxygen supply was increased by the same amount by increasing either FiO2or CO,
the resulting SvO2was higher when DO2was increased by
manipulating FiO2. Of note, we found that under conditions of
low oxygen supply, high values of the fraction of inspired oxygen could increase the mixed venous saturation to normal levels, masking states of insufficient oxygen supply.
Mixed venous saturation has long been used as a surro-gate for adequate perfusion to tissues during resuscitation (5). Low levels of SvO2are associated with poor prognosis
for several clinical scenarios, and currently, guidelines suggest targeting SvO2 at 70% during the early phase of
sepsis resuscitation, which is associated with a reduction in mortality (7). Nowhere in those guidelines, however, do the authors comment on the FiO2at which the central venous
blood gas should be collected.
One strength of the theoretical modeling approach is that it is possible to compare the effects of FiO2and CO on the
mixed venous saturation at precisely the same oxygen supply/demand conditions, i.e., equal VO2and DO2. Ho et
al. have previously shown that in humans with shock, high levels of PaO2can increase SvO2levels (8). From their data,
however, it was not possible to determine whether the increase in SvO2 was indeed reflecting a better oxygen
supply/demand relationship or whether the SvO2
repre-sented a false marker of the adequacy of such a relationship. Our findings of increases in SvO2 to levels considered
normal caused by increasing the FiO2 in the setting of
insufficient oxygen supply support the latter hypothesis. The mechanism by which increased values of FiO2cause a
steeper increase in SvO2than that caused by increases in CO
can be explained by the conservation of mass. When manipulating the FiO2 at fixed values of CO and oxygen
consumption, the arteriovenous difference in oxygen content (CaO2 – CvO2) must remain constant because oxygen
consumption is equal to the product of cardiac output and the arteriovenous difference in oxygen content. Thus, in this scenario, increases in arterial oxygen content will be followed by equal increases in venous oxygen content, explaining the roughly linear relationship between SvO2and DO2shown in
Figure 1. Conversely, when manipulating CO while keeping arterial oxygen content and oxygen consumption constant, the increase in CO will be compensated for by an increase in the venous oxygen content proportional to the arteriovenous difference in oxygen content such that at high CO values, the venous oxygen content approaches the arterial oxygen content. For example, using the Fick principle, if one assumes a hypothetical initial arterial oxygen content of 16 mL/dL and a venous oxygen content of 12 mL/dL, a 25% increase in the DO2by increasing the arterial oxygen content to 20 mL/
dL will cause an increase in venous oxygen content by the
same amount (from 12 to 16 mL/dL), causing venous saturation to increase from 62 to 83%. The same 25% increase in DO2 caused by increasing CO will only decrease the
arteriovenous difference in oxygen content from 4.0 to 3.2 mL/dL, thus increasing the venous oxygen content from 12 to 12.8 mL/dL. The result would be a modest increase in the central venous oxygen saturation from 62 to 66%.
Our study has several limitations. We kept the values of pH and the arterial partial pressure of carbon dioxide, vari-ables known to be affected by the hemodynamic condition, constant during all simulations. Although the model could accommodate changes in these variables, we decided to keep them constant to isolate the effects of the fraction of inspired oxygen and cardiac output. Additionally, for similar reasons, we ignored potential changes in the perfusion fraction that could be caused by the local control of blood flow during regional hypoxemia. Blood flow to tissues is usually driven by local metabolic demands to match supply and demand. Therefore, this model does not take into account changes in the local oxygen consumption that may occur after changes in the local partial pressures of oxygen and carbon dioxide.
In conclusion, we showed that the type of DO2
optimiza-tion, specifically increases in FiO2versus increases in CO,
could affect the capability of venous oxygen saturation to measure the adequacy of oxygen supply. Interpreting venous saturation at high arterial partial pressures of oxygen values should be performed with caution.
AUTHOR CONTRIBUTIONS
Zampieri FG wrote the manuscript, performed simulations with the model and wrote the mathematical model. Park M revised the manuscript and helped with model construction. Azevedo LCP performed simulations with the model and revised the manuscript. Amato MBP revised the manuscript and helped with model construction. Costa EDL designed and wrote the mathematical model and helped with manuscript preparation.
REFERENCES
1. Rivers E, Nguyen B, Havstad S, Ressler J, Muzzin A, Knoblich B, et al. Early goal-directed therapy in the treatment of severe sepsis and septic shock. N Engl J Med. 2001 8;345(19):1368-77, http://dx.doi.org/10.1056/ NEJMoa010307.
2. da Silva Ramos FJ, Azevedo LC. Hemodynamic and perfusion end points for volemic resuscitation in sepsis. Shock. 2010;34 Suppl 1:34-9, http://dx.doi.org/10.1097/SHK.0b013e3181e7e642.
3. Schumacker PT, Cain SM. The concept of a critical oxygen delivery. Intensive Care Med. 1987;13(4):223-9, http://dx.doi.org/10.1007/ BF00265110.
4. Ronco JJ, Fenwick JC, Tweeddale MG, Wiggs BR, Phang PT, Cooper DJ, et al. Identification of the critical oxygen delivery for anaerobic metabolism in critically ill septic and nonseptic humans. JAMA. 1993;270(14):1724-30, http://dx.doi.org/10.1001/jama.1993.03510140084034.
5. Marx G, Reinhart K. Venous oximetry. Curr Opin Crit Care. 2006;12(3):263-8, http://dx.doi.org/10.1097/01.ccx.0000224872.09077.dc. 6. Lorente JA, Landin L, De PR, Renes E, Rodriguez-Diaz R, Liste D. Effects of blood transfusion on oxygen transport variables in severe sepsis. Crit Care Med. 1993;21(9):1312-8, http://dx.doi.org/10.1097/00003246-199309000-00013.
7. Dellinger RP, Levy MM, Carlet JM, Bion J, Parker MM, Jaeschke R, et al. Surviving Sepsis Campaign: international guidelines for management of severe sepsis and septic shock: 2008. Crit Care Med. 2008;36(1):296-327, http://dx.doi.org/10.1097/01.CCM.0000298158.12101.41.
8. Ho KM, Harding R, Chamberlain J. The impact of arterial oxygen tension on venous oxygen saturation in circulatory failure. Shock. 2008;29(1):3-6. 9. Severinghaus JW. Simple, accurate equations for human blood O2
dissociation computations. J Appl Physiol. 1979;46(3):599-602. 10. RILEY RL, Cournand A. Ideal alveolar air and the analysis of
ventilation-perfusion relationships in the lungs. J Appl Physiol. 1949;1(12):825-47. 11. Finch CA, Lenfant C. Oxygen transport in man. N Engl J Med.
1972;286(8):407-15, http://dx.doi.org/10.1056/NEJM197202242860806.
Effects of arterial tension on SvO2
Zampieri FG et al. CLINICS 2012;67(8):897-900