Bolm Inst. oceanogr., S Paulo, 34(único):13-2l, 1986
A MULTIVARIATE APPROACH TO ENVIRONMENTAL-ZOOPLANKTON RELATIONSHIPS IN
MALDONADO BAY (URUGUAY)
Ana MILSTEIN
Agricultural Research Organization, Fish and Aquaculture Research Station, Dor, M.P. Hof Hacarmel 30820, Israel
Synopsis
Environment-zooplankton relationships were analysed in Maldonado Bay (Urug u ay)~
an estuarine area between the River Plate and the Atlantic Oceano This was done through Principal Component Analysis. Most of the environment variability is accounted for~ primarily~ by .the outflow oft!ze River Plate and the inflow of coas tal waters which change through the annual cycle~ and in the second place by surface water conditions. On the other hand~ most of the zooplankton variability is accounted for by 17 taxa abundant in April and February and by one dominan t species present only from May to August. A second source of zooplanktonic
variability is due to speÇ!ies which occurred in f all only The main observed variabi li-ty occurreg on an annual scale. On it~ variations on smaller scales overlap: from one day to another~ between Maldonado Bay and the adjacent waters of t he River Plate. The main factors involved were different at each scale . The Bay is relatively isolated from adjacent waters~ but the degree of isolation var ies throughout the year. The influence of coas tal water is greater and occurs first outside the Bay. Biological processes may develop under different conditions in the Bay and in the adjacent waters of the River Plate.
Descriptors: Principal component analysis, Seasonal variation, Zooplankton, Ecology, Coastal zone, Environmental conditions, Estuaries, Maldonado Bay: Uruguay.
Descritores: Anãl ise de componentes principais, Variação sazonal, Zooplâncton, Ecologia, Zona costeira, Condições ambientàis, Estuários, Baíà de Maldonado: Uruguai.
In troduction
In tourist areas, special attention should be devoted to the conservation of the landscape, to environmental
conditions, and consequently to their eco1ogy.
In Uruguay, the biggest tourist complex is Punta de1 Este, on Maldonado Bay. This Bay has a variab1e environment under the influence of the River Plate -which is an estuary, in spite of its name - and the coas tal waters of the Atlantic Oceano Its behavior is virtualy unknown. So, as a first step to an
understanding of its ecology, a one-year sampling program of zoop1ankton and environmental data was set up. The goals
Publ.
~.650 do
I~~t. o~ea~og~.da U6p.
were not only to record information 1n a systematic way, but also to study
variability and relationships among variables, which in turn should be useful for an understanding of highly variable aquatic environments in
general, besides Maldonado Bay. Other topics covered by this sampling program were analyse~ by Abda1a (1981), Ayup
(1981), Balino (1981), Pereyra (1981) and Urruti (1981).
14 Bolm Inst. oceanogr., S Paulo, 34(único), 1986
Area studied
Maldonado Bay ~s on the border line between the River Plate and the Atlantic Ocean (Fig. 1). It is a protected area of about 6 km2 and 10-11 m deep. The
Gorriti Island separates the Bay from the River PIate, which is an exposed and deeper region. Tides are negligible, on1y of 35 cm amplitude (Balay, 1961). During the investigation period water temperature fluctuated between 11.5°C
in
winter and
24°c in summer, and nothermoclines were recorded; salinity f1uctuated between 13%0 and 35%0, with ha10clines in falI (Apri1, May) and winter (July, August), and in November.
Studies on meteoro10gy, hydro10gy and geo10gy of the area were dane by Perez Fontana & de Castro (1942), Balay
(1961), SOHMA (1977), Proyecto de
Conservacion y Mejora de P1ayas (1979), Urien
et
al. (1980), Françoiset
alo(1981), Ayup (1981) and Urruti (1981). The sewage of Punta del Este 'pours out at two points near Ma1donado Bay: Punta de la Salina and Punta deI Chileno. At the latter point there is a sewage primary-treatment p1ant. Some microbiologica1 topics re1ated to these sewage outf10ws
2~
R'VER PLAT
ATLANTe 36'
OCEAN
55' .
Fig. 1. Area studied. Small map: arrow points out to Maldonado Bay; scale represents 100 km. Large map: location of stations
(stars); B
=
Bay station; E=
Exterior station; 10 m and 20 misobathes drawn.
during one summer period were studied by. Cristar & Schlco1nik (1980). These authors found that the sandy beach near Punta deI Chileno is not affected by those outflows, and the At1antic rocky coast of Punta deI Este near La Salina is only slight1y affected. This rocky coast is not a bathing area.
Most of the biologica1 research dane in Ma1donado Bay is on benthonic
organisms: de Buen (1950), Amaro (1967), Maytía
&
Scarabino (1979) and Neirotti(1980). Exceptions are an old descriptive paper on phytoplankton
(Barattini
&
Martinez Montero, 1932) and the above mentioned studies by Balino (1981) and Pereyra (1981) inthe framework of the present samp1ing programoMaterial and Illethods
The sampling strategy employed enabled the detection of changes inside and outside the Bay at day-scale and month-sca1e during the year. This strategy was discussed in a previous paper (Mi1stein, 1984). Samples were taken between Apri1 1980 and February 1981. Each season was samp1ed during two consecutive months, each month during two consecutive days
(except in April and November, due to bad weather), and each day samples were
taken in the afternoon. Samp1es were co11ected at two stations (Fig. 1), one in the middle of the Bay (B) and the
other on the oth~r side of Gorriti Island (E), in arder to compare the behavior of variables in the Bay and in the adjacente waters of the River P1ate.
The fo110wing parameters were measured at each station: transparency
(Secchi disk); oxygen and chlorophy11-a at severa1 depths in the euphotic 1ayer; temperature and sa1ini ty profiles wi th a thermosa1inometer; nutrients (nitrate, nitrite, phosphate, silicate) at surface and bottom. Waters for nutrients were collected once each month. Zoop1ankton were caught through ob1ique tows (speed and time standardize~with a Bongo net of
20 cm diameter; both nets were of 180 ~m
mesh, and one net was equipped with a f10wmeter.
MILSTEIN: Environment-zoop1ankton
Dissolved oxy gen was determined by the Winkler method. Chlorophyll-a was determined by the trichromatic method
(Vollenweider, 1974). Dissolved oxygen and chlorophyll-a were integrated through the euphotic layer. The total pigments/chlorophyll-a quotient
(DD) was also computed (Margalef, 1960). Nutrients were analyzed by Ayup (1981), who used spectrophotometric techniques.
Holoplankton were identified at the spe cies leveI, but meroplankton were grouped into broad taxonomic categories
(Table 2); their numbers were expressed as individuals per cubic meter and then transformed to Lo g (x+l).
Data were processed by means of the STRUCT program (Ibanez, 1973a). This program makes a Principal Component Analysis (PCA) of the correlation matrix of two sets of data
(environmental data and zooplankton counts) and also calculates the
correlations between the components of the two sets. The environmental data matrix was of 28 observations X 14 variables, and the zooplankton one of 56 observations X 34 variables. Since two zooplankton samples were taken simultaneously each time (Bongo net), to both samples of each pair correspond one and the same set of environmental data. Thus, for the calculation of correlations between the components of both data sets, each environmental observation was doubled.
Si gnificance tests of the components are available for multinormal
distribution of the va r iables, which
sel~o~ occur in ecology . Thus,
emp~r~cal criteria are used for
accepting a component and for the inclusion of variables in a componente In the environmental analysis the cri teria of Ibanez & Dallot (1969) and Flos (1979) was follow: components derived from ei genvalues greater than 1 were retained. In the zooplankton analysis, a random distributed
variable was included in the data set and alI components previous to the ' one which selects this variable are retained (Ibanez, 1973b). Following Ibanez
&
Seguin (1972), eachprincipal component was defined by the variables with loadings greater than 0.50. Other details of the PCA method as applied to biology a re found in Seal
(1964) , Lefebvre (1976) and Jeffers (1978).
15
Results
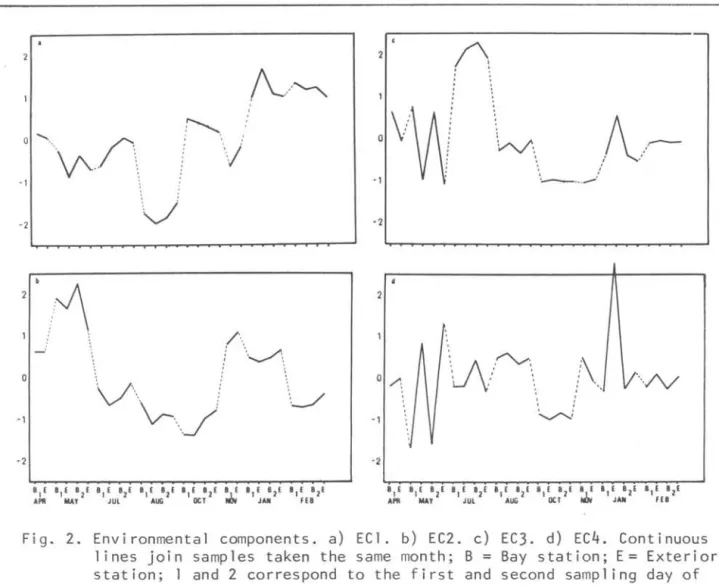
Seventy-two percent of the environmental variability was accounted for by four environmental components (EC), and 59 % of the zooplanktonic variability by three zooplanktonic components (ZC). Remaining components of both analyses accounted for less than 9% of the
overall variability, and were ne glected. Temperature, salinity, silicate and phosphate are the parameters wh i ch have greater weight in the first EC (ECl) (Table 1). Thus, this component corresponds to opposition betwee n
saline coas tal water rich in phosphate. and less saline estuarine water rich in silicate. It also shows change s of both water masses through the annual
tempera-ture cycle: its higher positive values occurred in summer when coas tal waters were present in alI the water column
(homogeneous high salinity and high temperature); its highest negative values occurred in August, when
estuarine water was present in all the water column (homogeneous low salinity); values between O and -1 correspond to stratified waters (April, May, July and November, Fig. 2a). This component also shows differences between consec utive days and between stations.
Tab1e 1. Environmenta1 components: percentage of variabi1ity accounted for each component, and parameters with saturations over 0.50
EC I E C2 EC) E C,
Va r i ab i I i t y C% ) 29 2 0
,.
T rolOS p a r ency 0.8 6
Tempera tu re (s u rf a ce) 0.6 2 0.61 - o. ó3
Terroerat ure (bet tom) 0 .5 0 0.71
Sol I; n i t Y ( s u rf oHe ) 0 .7'
Sol I i n i t Y (battem) C.32
Oxygen (eupnot i c. I a ve r) 0 . 7 2
Chio r oph..,11 (euph. 1 a ~e r) 0 . 72
0 0 0.56
P h05pn a :e (su rf ace) 0.52
P hosph a t li!! (banam) 0 .7 4
5 i 1 i c.at li!! (su r f a c e ) - 0.5 4 0 .76
5 i I i cat li!! ( o ot tom) - 0. 74
N i t r j t e (su r face) 0.63
N i t r i til!! (be t t o m) 0 . 6B
The EC2 reflects conditions in
16 Bolm Inst. oceanogr., S Paulo, 34(Gnico), 1986
highest values occurring when tempera-ture and dissolved oxygen were high. It also shows differences on a small scale, mainly in May (Fig. 2b), where it points out to a sharp change between consecu-tive days, more pronounced at the Exterior station.
The EC3 is difficult to explain. It is composed by three variables related to surface waters (total pigmentsl chlorophyll-a quotient (DD), surface silicate and surface temperature) and one to bottom waters (nitrite)
(Table 1). Its highest values occurred in July, when surface water was cold and peaks of the other three variables were registered. It also shows strong
differences between stations during the falI sampling days and points out to a phytoplanktonic bloom recorded on the first sampling day of January at the Exterior station (Fig. 2c).
The EC4 is a phytoplanktonic component (Table 1) which reflects mainly the bloom of January (Fig. 2d).
f\- / ~
""
.~
-
í '
\
:~ ,,:"i
-,
-2
o
~V' , ,
'
... :
'v- \. ~
-,
- 2
On that occasion, 69 mg chlorophyll-a/m3
was recorded in the surface waters at the Exterior station, while 4.9 mg/m3
occurred in the Bay. The bloom disappeared 24 hours later, when the amount of chlorophyll-a at the Exterior station surface waters decreased to
8 mg/m3 • In addition to this
phenomenon, this component also points out to strong differences between stations in May.
The first zooplanktonic component (ZCl) is a general quantitative factor. It is a bipolar component which brings together 17 coastal water taxa which were abundant in April and February, as opposed to the estuarine cladoceran
Pfeop~ (=
Podonl
pofyphemoid~, whichwas present only in May-July-August, and in large numbers (Table 2). This
component follows an annual cycle, with clearly different values in each month. It also shows strong differences between consecutive days and between synoptic stations in July, August and February
2 ; \ ,
: "
" \\Aj
_,
V \
iA/..
!I\./~
-2
t"
-,
-2
':
1\
'~
',
"u \/
\
\~ ... ",...'
!\
! ""
MILSTEIN: Environment-zooplankton
Table 2. Zooplanktonic percentage of accounted for and taxa with over 0.50
components: variability each component,
saturations
Variabillty (%)
Cyphonau tia rvae
Oecapod larvae
Clrrlped cyprls
Bivalve larvae
Gastropod larvae
Polvchaete 1 arvae
Fish eggs
Fish larvae
O~ . k o peelll(a sp
Sag ~ tta s pp Coelenterates
Hysids
lCI
32
0.67 0.67
0.87 0.83 0.93 0.89 0.69 0.74 0.81 0.91 0.81
0.50
I/vmJ c ljcf()p~ thafllHífl6 0.73
Ac ah t , ,, lon6a 11.58
Co "'ljca ~ u6 dub ~ 116
Eucata~u6 p~eeatu6
E. p~teatu6 ~aupt~~
C e ~tl(opage6 vet~6~catu6
O~caea cUl(ta Noct~tuca sp Rot i fers
Pteop~6 potljphemo~de6
O ~ tho~a tla~a
Lab ~ docel(a 6tuv~at ~ t~6
L. ~luv i at i li. nlluplii
Pal(acaea~u6 qua66~modo
Cte~ocala~u6 va~u6
Evad~e ~ol(dman~
Cirriped nauplii
Echinoderm larvae
11.68
-0.51
lC; lO
17 10
0.56
0.55
0.95 0.82 0.91 0 . 78
0 . 72 0.65 0.68
0 . 5 1 0 . 73
0 . 86
(Fig. 3a). It is correlated to the ECI (r
=
0.68).The ZC2 is a fall component which groups eight specíes (Table 2). It
17
points out to strong differences between synoptic stationsin April and on the second day of May, and between
consecutive days' at the Exterior station in May (Fig. 3b). Its dístribution is correlated to the EC2 (r
=
0.65).The ZC3 brings together three copepod species of very different size, which were present alI the year round: the
large La6~doc~a ótuv~~, the
mediumrsíze
Acantia tOn6a,
and the sroallO~ona
nana
(Table 2). The componentpoints out to the most relevant small-seale phenomena, which occurred in May, July, August and January (Fig. 3c).
'2
'2
Fig. 3. Zooplanktonic components. a} ZC1. b} ZC2. c} ZC3 .
18 Bolm Inst. oceanogr., S Paulo, 34(único), 1986
Discussion
The first two components of both environment and zooplankton show that the main observed variability occurred on the annual scale. However, this general pattern is overlapped by
variations on a smaller scale,especially in zooplankton. These small-scale
variations became more evident in the third and fourth components.
On an annual scale, temperature is the isolated variable that shows more clearly a cycle. It has a large contribution to the first three EC. The other parameters do not show a clear cycle, but their combination into components does.
In relation to salinity, two situations can be noticed: stratifi-cation or low salinity homogeneous waters in fall-winter (estuarine
circulation) and homogeneous saline water in spring-surnrner (marine
circulation). These situations depend on the outflow on the River Plate and the inflow of coas tal waters. The stratified waters recorded in November are an exception to this pattern. The dominance of low salinity surface waters in fall-winter and the opposite
situation in spring-summer were recorded previously in the area (SOHMA, 1977): the average surface monthly salinities at Punta del Este Port during the period 1970-1975 were lower than 25% 0
~etween April and August, and higher in
the other months. In the present study, the ECl points out to this trend.
Silicate and phosphate
concen-trations, the other important variables of the EC1, were more highly correlated with salinity than with temperature. François
et
alo
(1981), working with monthly samples from 12 stations at the Uruguayan coast of the River Plate and Atlantic Ocean, also found a negative correlation between salinity andsilicate, but not with phosphate. These authors stress that silicate concen-tration seems to depend on the River Plate dynamics, while that of phosphate would be a function of local inflows at each sampling station. Taking into account not only the Bay and Exterior stations of our study, but also the mentioned coas tal stations sampled on the same days, the impact of human activities becomes clear: phosphate
concentrations were higher near the sewage outflows, especially in surnrner. Up to 2.3 ~g at-P/l was recorded at all stations except near the sewage outflows of El Chileno and La Salina, where
concentrations reached up to 6.8 ug at/l and 16.6 Ug at/l, respectively, during the surnrner tourist period (Urruti,198l). At the Bay and Exterior stations this influence was not so evident, thus showing that the dilution and degradation processes are still
sufficient to absorb the present level inflows.
Another source of variability
existed in the upper layers of the sea. Fluctuations in light and oxygen (EC2) showed cyclic behavior and were more important than fluctuations in the amount of chlorophyll-a. The latter parameter in the euphotic zone also showed cyclic behavior, correlated to temperature (r = 0.46), which was not
reflected by the EC2 due to the great variability introduced into the data by the phytoplankton bloom of January.
The variations in the amount of each zooplankton species were irregular and many species were present all the year round. In spite ofthese irregularities, the PCA identified groups of species with different behavior in relation to the period of abundance.
The species of the ZCl positive pole were more abundant during early fall and summer. Among them, the subtropical copepods
Peutac.a1aVllL6 CJLM/.:;iJc..Of.;,;(:Jl.M
andCo~yc.aelL6 amaZOVl~c.lL6, the appendicularian
O~kopleUha sp., and seven meroplanktonic
groups (cypris, decapods, polychaetes, cyphonautes, bivalves, gastropodes, and eggs and larvae of fish) were the taxa that more clearly showed this pattern. In Lagoa dos Patos (southern Brazil), Montu (1980) also found a greater abundance of these groups (except for
P.
CJLM/':;iJc..O/,:;~) in the hot season. Theother species of the ZCl + pole also showed large numbers in other monsths:the copepod Hem~c.yc.lop/.:; thalM/':;~lL6 and the chaetognaths Sag~a spp. in July,
related to the inflow of coastal waters; the copepods
A.
tOVl/.:;a
and Eute~p~Vlaac.~6~oVl/.:; were abundant all the year
round except in spring, when zooplankton decreased due to the abundance of
tentaculate ctenophores.
MILSTEIN: Environment-zooplankton
cladoceran
P.
polyphemo~d~, which was present in late fall-winter. This species is a low salinity indicator which was present mainly in the surface waters of the River Plate. This issugge~ted by several observations: (a)
it was recorded during the period when waters are stratified; (b) its maximum
abundance occurred on the first sampling day of August, when low salinity water
(20%0) occupied alI the water column; and (c) on the next day there was an inflow of saline water (29%0) at the bottom, and the numbers of this
cladoceran decreased. This opposition between coas tal and estuarine species depends on water circulation, as shown by the correlation between ZCl and ECl.
The ZC2 selected species which were present mainly in falI. Among them, rotifers were brought in by the River Plate waters, and the others were subtropical copepods. Some of the latter reach the Buenos Aires Province
(northern Argentina) only in early falI
(Ce.Y1.tJc.opag~ ViliMc.atU6 and EUC.alaY1.U6
p~e.at(6) (Ramirez, 1977), or are
pre~ent in the area the year round, but
the~r maximum abundance is in May
(C.
amaZO~c.(6)(Ramirez, 1969).On smaller space and time scales the
.
'
d~fferences pointed out by the
components are the result of biological or advective processes. These processes may develop only in the Bay, only at
the Exterior station, or in both. Also the conditions at each station may change in one day. An example of small-scale variability due to biological
processes is the phytoplankton bloom of January, which developed only in the River Plate and vanished one day after. This phenomenon was reflected by several components, mainly by the EC4
(chlorophyll-a), EC3 (phytoplankton pigments) and ZC3 (zooplankton). In the EC3, the total pigments/chlorophyll-a quotient (DD) is the variable responsible for the January peak. High valuesof this quotient are associated with poor physiological conditions of the
phytoplankton and/or the presence of detritus in the seston (Margalef, 1963). It is very likely that the former condition occurred during the bloom, because evidence of self-shading was recorded (reduced transparency in the b 100m area).
Advective processes account for most
of the differences on small scales during stratified periods. For
example, on the first sampling day of May, there were differences between stations in the environrnental
parameters (ECl, EC3) but not much in zooplankton (ZCl, ZC2); on the second day conditions in the Bay were about the same, but surface waters at the Exterior station changed (EC2), as did zooplankton at this station (ZC2, ZC3). Another type of advective process occurred in July and August, and was reflected by the ECl, ZCl and ZC3. In July, ou the first day waters were stratified at both stations, but in the Bay bottom salinity was lower than in the
Exterior station; the second day salinity of bottom coastal waters increased at both stations, haloclines occurred nearer to the surface than in the previous day, and zooplankton changed at both stations but more at the Exterior one. In August the events were similar, except that on the first sampling day estuarine low-salinity waters occupied the entire water column at both stations, and the environmental changes were more pronounced at the Exterior.
This study underlines the fact that in Maldonado Bay, as probably in other highly variable aquatic environments, variations on different space and time scales overlap, and the main factors
involved are different on each scale.
Acknowledgements
This paper is part of the author's Ph.D. thesis at the Oceanographic
Institute of the University of são Paulo, under the advisorship of Dr Alfredo Martins Paiva Filho.
References
19
ABDALA, J. 1981. Asentamiento de lar-vas y crecimiento de MyülU6
e.dut.ú.,
pla;te.Y1.6~ en la Bahia de Maldonado.
B.Sc. thesis. School of Humanities and Sciences, University of Uruguay.
20 Bolm Inst. oceanogr., S Paulo, 34(único), 1986
AYUP, R. 1981. Reconocimiento preli-minar de las aguas de la Bahia de Maldonado. B.Sc. thesis. School
of Humanities and Science~,
University of Uruguay. 42p.
BALAY, M. A. 1961. El Rio de La Plata entre la atmosfera y el mar. Servo Hidr. Naval, B. Aires, H62l. l53p. BALINO, B. 1981. Biologia larval de
cirripedios de la Bahia de Maldonado. B.Sc. thesis. School of Humanities and Sciences, University of
Uruguay.
BARATTINI, L. P. & MARTINEZ MONTERO, H. 1932. La dinamica marina de la Bahia de Maldonado. An. hidrogr., Servo Hidrogr. Armada, Montev. 1:383-408.
CRISTAR, V.
&
SCHLCOLNIK, P. 1980. Calidad de aguas costeras en Punta deI Este. Revta Ing., Montev., 31:9-18.DE BUEN, F. 1950. Las bases cienti-ficas y técnicas de la explotacion mitícola. Revta Fac. Hum. Cien., Univ. Repúbl. Urug., 4:245-264. FLOS, J. 1979. Interpretacion de
varios analisis de las componentes principales aplicadas a un conjun-to de daconjun-tos oceanograficos de una zona ner~t~ca deI Golfo de Vizcaya.
Investigacion pesq., 43:611-635.
FRANÇOIS, A.; GONZALEZ, Y.; MORESCO, H.; RISO, R. D. & SANSON, P. 1981. Iniciacion aI conocimiento de las caracteristicas fisico-quimicas de las aguas costeras litora1es. Resultados deI p1an preliminar exploratorio I (oct. 1979 - oct. 1980) Informe téc. Servo Oceanogr. Hidrogr. Metero1. Armada, Montev., 01-81, 25p.
IBANEZ, F. 1973a. Un programme FORTRÀN IV d'etude des structures éco10giques marines par un mode1le derive de l'ana1yse factorielle. Doc. scient. Centre Nosy-Be, ORSTOM, 38:1-91.
IBANEZ, F. 1973b. Methode d'ana1yse spatio-temporelle du processus d'echantillonnage en p1ancto10gie, son influence dans l'interpretation des donnees par l'analyse en
composantes principales. Trav. Stn. zool. Vil1efranche-sur-Mer, 36(1):28p.
--- & DALLOT, S. 1969. Etude
du cycle annuel des chaetognathes planctoniques de la rade de
Villefranche par la methode d'analyse des composantes principales. Mar. Biol., 3:11-17.
--- & SEGUIN, G. 1972. Etude
du cycle annuel du zooplancton
d'Abidjan. Comparaison de plusieurs methodes d'ana1yse multivariable:
composantes principales, correspon-dences, coordonées principa1es. Investigacion pesq., 36(1):81-108. JEFFERS, J. N. R. 1978. An
introduction to system analysis: with ecological applications. London, E. Arnold, 198p.
LEFEBVRE, J. 1976. Introduction aux analyses statistiques multidimensio-nalles. Paris, Masson, 219p.
MARGALEF, R. 1960. de la composition phytoplancton sur
Valeur indicatrice des pigments du la productivite, composition taxonomique et proprietes dynamiques des populations. Rapp. P.-v. Reun. Commn int. Explor. scient. Mer Mediterr., 15(2):277-281.
1963. Modelos simpli-ficados deI ambiente marino para el estudio de la sucesion y distribu-cion deI fitoplancton y deI valor indicador de sus pigmentos. Investi-gacion. pesq., 23:11-52.
MAYTÍA, S. & SCARABINO, V. 1979. Las comunidades deI litoral rocoso deI Uruguay: zonacion, distribucion local y condideraciones biogeogra-ficas. In: Seminario de Ecologia
MILSTEIN: Environment-zooplankton
MILSTEIN, A. 1983. Principal component analysis of environmental and
zooplanktonic relationships in a very variable coastal area.
In:
Shuval, H. I., ed. -Developments in ecology and environmental quality, vol. 11. Rehovot, Israel, Balaban Int. Science Service. p.347-355.
1984. Sampling strategy in a very variable environrnent.
In:
International Conference on a Copepoda: 1-: Amsterdam: 1981. Proceedings. Crustaceana, suppl. 7:336-343.MONTÚ, M. 1980. Zooplancton do estuârio da Lagoa dos Patos, I. Estrutura e variações temporais e espaciais da comunidade. Atlânti-ca, Rio Grande, 4:53-72.
NEIROTTI, E. 1980. Estudio comparativo de supralitoral y mesolitoral rocoso en localidades de Monti video y Maldona-do.
In:
Jornadas de Ciencias Natura-les: lª: Montevideo, 1980. Resúmenes, Publção extra Mus. naco Hist. nat.,(30): 112-112.
PEREZ FONTANA, H. V.
&
DE CASTRO, F. 1942. Estudio de correlaciôn de elementos meteoro-oceanogrâficos en los puertos de Montevideo y Punta deI Este. Ano 1938. Revta met., Mon tev • , T : 72 -75 •PROYECTO DE CONSERVACION Y MEJORAS DE PLAYAS. 1979. Ministerio de
Trans-portes y Obras Públicas (Uruguay), PNUD, UNESCO. Infme tece FMR/SC/OPS/ 80/2l4/(PNUD). 593p.
RAMIREZ, F. C. 1969. Copepodos plan-tônicos deI sector bonaerense deI Atlântico Sudoccidental. Servo Hidrograf. Naval, B. Aires, 9:1-116.
RAMlREZ, F. C. 1977. Planktonic indicators of Argentine shelf and adjacente areas.
In:
Syrnposium on Warm Water Zooplankton: Goa, India: 1976. Proceedings. Coa, National Institute of Oceanography. p. 65-68.21
SEAL, H. L. 1964. Multivariate
statistical analysis for biologists. London. Mathuen, 209p.
SOHMA. 1977. Almanaque, Serv.Oceanogr. Hidrol. Meteorol. Armada, 44 ed.
Uruguay. .
URIEN, C. M.; MARTINS, L. R.
&
MARTINS, I. R. 1980. Evolução geolôgica do Quartenârio do litoral atlântico uruguaio, plataforma continental e regiões vizinhas. Notas teCe CECO 3: 7-43, Brasil.URRUTI, P. 1981. Descripciôn de algu-nos parâmetros hidrolôgicos y su relaciôn con aspectos ecolôgicos de la Bahia de Maldonado (Uruguay). B.Sc. thesis. School of Humanities and Sciences, University of
Uruguay. l20p.
VOLLENWEIDER, R. A., ed. 1974. A manual on methods for measuring primary production in aquatic environments. 2 ed. Oxford,
Blackwell, 225p. (IBP Handbook,