INTRODUCTION
Considerable research has been done on the synthesis of ceramic materials based on zirconia. Different synthesis methods such as co-precipitation, sol-gel process and organic precursor have been developed for zirconia stabilization. The stabilization effect occurs with additions of dopants like MgO, CaO, CeO2, Y2O3 and oxides based on rare earths.
According to several authors the mixture of precursors of ZrO2 and SiO2 led to ZrSiO4 (zircon) phase formation
[1-3]. Although dificult, the preparation of the homogeneous
zircon phase has already been the subject of several research papers [4-6]. Veytizou et alii [7] synthesized zircon starting from amorphous precursors powder by the sol-gel method. The powder was prepared with tetraethoxysilane (TEOS), Si(OC2H5)4 and zirconyl nitrate hydrate, ZrO(NO3)2.6H2O. Aguilar et alii [8] studied the crystallization of zircon with a synthesis with TEOS and zirconium propoxide. Below 1200 ºC tetragonal zirconia and amorphous silica and zircon were formed for several compositions. Shi et alii
[9] synthesized ultraine zircon powder with high purity
starting with a ZrOCl2 solution and fumed silica. The zircon precursor gels were prepared by a wet chemical precipitation and the gel were seeded with zircon sand powder. High chemical homogeneity and particle size from 0.2 to 0.3 µm were obtained at high calcination temperature.The use of conventional technique for ZrSiO4 synthesis does not led to homogeneous phase and favors an abnormal grain growth during the calcination or the sintering process.
Additions of silicon into the zirconia structure do not produce vacancies. According to some authors the isovalent substitution of zirconium by silicon caused dispersion of silicon into the zirconia particles and does not favor the stabilization effect of structure. Silicon diffusion caused an interface formation and growth the ZrSiO4 (ZS) phase. However, in any case the tetragonal and/or cubic phase of zirconia takes place without the formation of the SZ phase.
Among several methods of synthesis, the polymeric precursor process led to obtain high powder surface area and chemical homogeneity at molecular level. The objective of the present work was an investigation of the phase formation during decomposition of the polymeric precursors based on
Synthesis of stabilized zirconia without dopants
(Sintese de zircônia estabilizada sem dopantes)
R. C. Pessoa1, M. Cerqueira1, R. S. Nasar1, I. V. P. Yoshida2
1Departamento de Química, UFRN, Natal, RN 59072-970 2Instituto de Química, Unicamp, Campinas, SP 13084-971
Abstract
ZrO2-SiO2 powders were synthesized through Pechini’s method starting with D4Vi, PMS and zirconium citrate. The complex polymer was decomposed to form different phases at high temperatures. During the resin decomposition, the phase transformation from monoclinic to tetragonal zirconia was detected by thermal analysis. The crystallization and the diffusion process of Si and Zr were analyzed by X-ray diffraction, XRD, scanning electron microscopy and microanalysis by EDS. Tetragonal zirconia at 1000 ºC, monoclinic zirconia at 1200 ºC and monoclinic zirconia with cristobalite silica from 1300 º to 1400 ºC were formed. From 1000 ºC to 1300 ºC a diffuse amorphous band was related to the silica phase. The mapping of Kα line of Zr and Si showed low diffusion of Si into the ZrO2 structure. The kinetics of crystallization formed macroparticles of silica and small particles of zirconia. A diffusion interface between SiO2 and ZrO2 to form ZrSiO4 phase was not observed, conirmed by XRD.
Keywords: Pechini method, zirconia stabilization, EDS microanalysis.
Resumo
Foram sintetizados através do método Pechini pós de ZrO2-SiO2 iniciando com D4Vi, PMS e citrato de zircônio. O polímero complexo foi decomposto para formar diferentes fases em altas temperaturas. Durante a decomposição da resina foi detectado a transformação de fase monoclínica tetragonal por análise térmica. A cristalização e o processo de difusão do Si e do Zr foi analisado por difração de raios X, microscopia eletrônica de varredura e microanálise por EDS. Foi formada zircônia tetragonal em 1000 °C, zircônia monoclínica em 1200 °C e zircônia monoclínica com sílica cristobalita de 1300 °C até 1400 °C. Entre 1000 e 1300 °C foi relacionada uma banda amorfa difusa de fase sílica. O mapeamento das linhas Kα do Zr e do Si demonstraram baixa difusão de Si na estrutura do ZrO2. A cinética de cristalização formou macro-partículas de sílica e pequenas partículas de zircônia. Não foi observada a interface de difusão entre SiO2 e ZrO2 conirmada por difração de raios X.
silica and zirconia and to verify the diffusion process of silicon into the zirconia structure. The synthesis method was the polymeric precursor that produced powders with high surface area and homogeneity of phases.
EXPERIMENTAL
Reagents based on Zr and Si were mixed by using the polymeric precursor process, Table I.
Citric acid was mixed to IV-zirconium butoxide in water and homogeneized at 90 ºC for 6 h. Ethyleneglycol was added to the solution and stirred for 2 h. The zirconium citrate was mixed by stirring to D4Vi and PMS according to Table II.
The polymeric resin was calcined from 100 to 1400 ºC several times. The powder was deagglomerated in agate mortar and sieved at 325 meshes.
The powder was characterized by Fourier transform infrared spectroscopy, FTIR, in a Bomem B100 equipment with KBr pellets, with a resolution of 4 cm-1 from 4000 to
400 cm-1. DTA analysis was performed in a TA instruments
model 2910 with a heating rate of 10 ºC/min under oxygen. The powder was analyzed by X- ray diffraction in a Shimadzu
XRD 6000 diffractometer with CuKα radiation, 1.5418 Å, and 2θ from 10º to 80º. The powder was analyzed by
scanning electron microscopy, SEM, and energy dispersive spectroscopy, EDS, with a JEOL-JSM T-300 microscope with an acceleration voltage of 20 kV.
RESULTS AND DISCUSSION
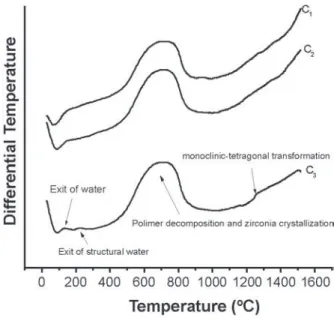
Fig. 1 shows the DTA curves of C1, C2 and C3 concentrations with an endothermic reaction related to water release near 100 ºC (adsorbed water) and an endothermic peak
due to release of structural water from 180 to 200 ºC. The
decomposition of polymer takes place with an endothermic
peak from 400 to 800 ºC. Near 1200 ºC an endothermic peak
is related to monoclinic to tetragonal phase transformation. It is not clear whether the peak of the zirconia crystallization
occurs close to 700-800 ºC. Transformations related to silica
formation and ZrSiO4 were not observed. This indicated that the amorphous phase of silica appears in a wide temperature range.
The X-ray diffraction pattern of powder of C3 concentration, Fig. 2, shows the tetragonal zirconia phase
Name Purity
(%) Origin
IV Zirconium Butoxide 99.2 Aldrich
Citric Acid 99.3 Vetec
Ethyleneglicol 99.0 Vetec
Tetrametiltetravinilciclotetrasiloxane
(D4Vi) 99.6 Dow Corning
Polymetilsiloxane (PMS) 99.8 Dow Corning Table I - Purity and origin of reagents.
[Tabela I - Pureza e origem dos reagentes.]
Concentration Zr Resin (g)
D4Vi (g)
PMS (g)
C1 30 75 5
C2 40 65 5
C3 50 55 5
Table II - Concentration of reagents in the mixture of compounds.
[Tabela II - Concentração dos reagentes na mistura dos compostos.]
Figure 1: DTA curves of sample C1, C2 and C3.
[Figura 1: Curvas de DTA das amostras de composições C1, C2 e C3.]
Figure 2: X-ray diffraction patterns of C3 powder.
formation at 1000 ºC/6 h. The increase of temperature from 1200 ºC to 1300 ºC shows the formation of the monoclinic phase of the zirconia at 1200 ºC and the monoclinic phase with a crystalline phase of crystobalite silica at 1300 ºC/6 h. The powder calcined at 1400 ºC/6 h shows the same pattern observed at 1300 ºC/6 h with intense peaks. According to the phase diagram [8], above 1250 ºC a phase based on ZrO2. SiO2 (ZrSiO4) is formed for all stoichiometric compositions. However the zircon phase was not observed showing separated phases for ZrO2 and SiO2.
Fig. 3 shows X-ray diffraction patterns of different compositions calcined at various times. The phase analysis of C1 and C2 compositions shows 100% of the tetragonal zirconia in the powder calcined at 1000 ºC. Intense peaks of stabilized zirconia phase were observed with formation of two different phases, tetragonal and cubic. A diffuse band of amorphous material related to silica shows that the crystalline phase was formed at temperatures above 1000 ºC.
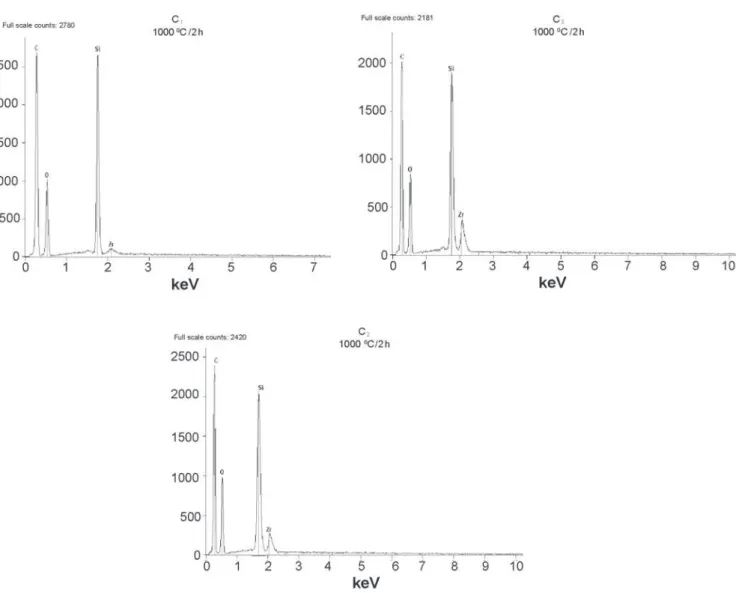
Analysis by mapping the Kα line of Zr, Si and O of powder of C2 composition, Fig. 4, shows broad Si peaks and weak Zr peaks for all compositions. The Zr peak increases from C1 to C3 composition. The poor traces of Zr could indicate the presence of small concentration of ZrO2 particle in the powder. The spectra show a peak of carbon related to sample powder substrate in the three compositions.
Figure 4: Scanning electron microscopy micrograph and microanalysis of C1 composition. a) SEM of powder, b) Zr mapping, c) Si mapping, d) O mapping.
[Figura 4: Microscopia eletrônica de varredura e microanálise da composição C1. a) MEV do pó, b) mapeamento do Zr, c) mapeamento do Si, d) mapeamento do O.]
Figure 3: X-ray diffraction patterns of C1, C2 and C3 compositions with different times of calcination.
[Figura 3: Difratogramas de raios X das composições C1, C2 e C3 com diferentes tempos de calcinação.]
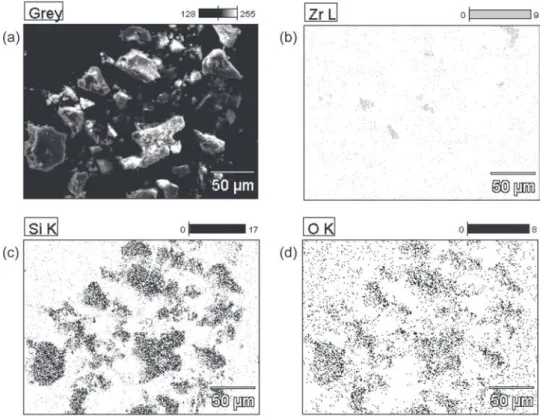
Fig. 5 shows the scanning electron microscopy micrograph of the C3 concentration powder calcined at
Figure 6: Scanning electron microscopy micrographs and microanalysis of C3 composition. a) SEM of powder, b) Zr mapping, c) Si mapping, d) O mapping.
[Figura 6: Microscopia eletrônica de varredura e microanálise da composição C3. a) MEV do pó, b) mapeamento do Zr, c) mapeamento do Si, d) mapeamento do O.]
Figure 5: Scanning electron microscopy micrograph and microanalysis of C2 composition. a) SEM of powder, b) Zr mapping, c) Si mapping, d) O mapping.
1000 ºC. Particles in the 10-50 µm range were observed indicating powder agglomeration. A mapping of the Kα line of the powder indicated that there is a zirconia phase growth with the formation of microparticles and low frequency of distribution of particles. The analysis of the Si concentration shows a high frequency of particles forming macroparticles. According to the mapping data, low diffusion of zirconium and silicon ions takes place in SiO2 and ZrO2 particles, respectively. The Si distribution indicated low propagation into the zirconia particles without solid solution formation and ZrSiO4 phase formation. During decomposition of the polymeric resin individual nuclei of phases grows forming the crystalline phase of zirconia and the amorphous phase of silica. The cause of the different phase formation is the poor mixing between the precursors resin at molecular level. Several works indicated that the ZrO2-SiO2 mixture led to zircon phase formation.
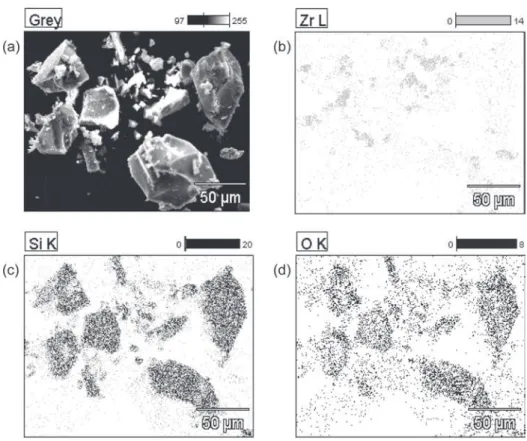
Analysis by SEM of C1 powder, Fig. 6, shows
Figure 7: Spectra of mapping of Kα line of Zr, Si, O and C. a) C1 composition, b) C2 composition, c) C3 composition. Powder calcined at 1000 °C/2 h.
[Figura 7: Mapeamento dos espectros das linhas Kα do Zr, Si, O e C. a) composição C1, b) composição C2, c) composição C3. Pó calcinado em 1000°C/2 h.]
macroparticle with size in the 5-60 μm range. The mapping
of Kα line shows an increase of ZrO2 particle frequency and a growth of particles relative to the powder of C1 concentration. The growth of zirconia particle does not led to dispersion of silicon into the ZrO2 structure. Substitution of silicon for zirconium positions into the lattice does not cause vacancies formation according to the reaction:
Silicon is isovalent relative to zirconium ion and has low diffusivity into the zirconia structure, the phase nucleates and grows in amorphous silica.
[2] H. Kobayashi, T. Terasaki, T. Mori, H. Yamamura, T. Mitamura, Preparation of ZrSiO4 powders by sol-gel process (Part 3)- preparation conditions of ZrSiO4 composition precursor gels from Si(OC3H7)4 and Zr(OC3H7)4 alkoxydes, Seramikkusu Ronbunsshi 99, 1 (1991) 42-46.
[3] P. Tartaj, J. Sanz, J. Serna, M. Ocana, Zircon formation from amorphous spherical ZrSiO4 particles obtained by hydrolysis of aerosols, J. Mater. Sci. 29 (1994) 6533-6538. [4] R. Valero, B. Durand, J. L. Guth, T. Chopin, Mechanism of hydrothermal synthesis of zircon, J. Sol-Gel Sci. Technol.
13 (1998) 119-122.
[5] J. Brinker, G. Scherer, Sol-Gel Science, Academic Press, San Diego, EUA (1985).
[6] T. Lopes, R. Gomez, in Sol-gel Optics: Processing and Aplications, Ed.: L. C. Klein, Kluwer, Boston, EUA 16 (1994) p. 345.
[7] C. Veytizou, J. F. Quinson, Y. Jorand, Preparation of zircon bodies from amorphous precursor powder synthesized by sol-gel processing, J. Eur. Ceram. Soc. 22 (2002) 2901-2909.
[8] D. H. Aguilar, L. C. Gonzales, L. M. Torres-Martinez, A study of the crystallization in the sol-gel system: ZrO2-SiO2, J. Sol. State Chem. 158 (2000) 349-357.
[9] Y. Shi, X. Huang, D. Yan, Preparation and characterization
of highly pure ine zircon powder, J. Eur. Ceram. Soc. 13, 2
(1994) 113-119.
(Rec. 15/05/2007, Rev. 12/11/2007, Ac. 14/12/2007)
particle size for stabilization. The Kα line mapping shows an increase of Si diffusion into the zirconia particle causing a decrease of zirconia stabilization considering that Si does not contribute to vacancy formation.
CONCLUSIONS
A complex polymer synthesized by using the Pechini method decomposes at different temperatures and times. Tetragonal zirconia was formed at 1000 ºC, monoclinic zirconia at 1200 ºC and monoclinic zirconia and cristobalite silica in the 1300-1400 ºC range. A diffuse amorphous band observed by X-Ray diffraction was formed from 1000 to 1300 ºC relative to the silica phase. The increase of zirconia concentration led to the formation of fully tetragonal zirconia, TZP. A mapping of Zr and Si Kα line by EDS indicated the formation of small silica particles. The mapping of Kα line of Si shows low propagation into the zirconia particles without solid solution formation. Such results demonstrated that the
zirconia stabilization occurs without the inluence of Si ions
into the zirconia structure.
REFERENCES
[1] Y. Kanno, Suzuki, Estimation of formation mechanism