M&A: The Case of Secil
and Lafarge Betões
Sofia Ferreira Cardoso
Advisor: Peter Tsvetkov
Dissertation submitted in partial fulfillment of requirements for the degree of MSc in Business Administration, at Universidade Católica Portuguesa
Sofia Ferreira Cardoso M&A: The Case of Secil and Lafarge Betões 2/61 ABSTRACT
The drive of the choice of the acquisition of Lafarge Betões by Secil as the subject of this dissertation was to try to understand the rational of investing in a business that is currently in a very adverse economic environment.
The forecast in this uncertain period is now a question of believe. Secil believed that, in Portugal, in this recessionary environment was worth paying €65 million for Lafarge Betões.
Secil had a long term perspective that the Portuguese economy and the industry will recover and the acquisition will bring a dominant market position overtaking Cimpor and improved efficiencies that will contribute to a better performance in 2014-2015 when the economy will start growing.
The holding company Semapa is negotiating the acquisition of the remaining 49% share in Secil and was recently a candidate to the acquisition of Cimpor.
It is this investment effort in the Portuguese industry, the optimistic believe of the “captains of industry”, that has attracted my curiosity and justified the choice of this subject.
Sofia Ferreira Cardoso M&A: The Case of Secil and Lafarge Betões 3/61 ACKNOWLEDGMENT
I would like to express my acknowledgments to Professor Peter Tsvetkov, the Dissertation Advisor, for all his mentoring during the preparation of this dissertation.
I also would like to express my gratitude to Dr. Alexandre Brandão, Managing Director at Secil, for his availability, the data he has provided and all his very valuable business input.
I must also recognize Baker Tilly Portugal, the consulting company where I was working at the time, for all the time they have made available.
Finally, I would like to thank my family for the unlimited support and comprehension during all this period.
Sofia Ferreira Cardoso M&A: The Case of Secil and Lafarge Betões 4/61 LIST OF CONTENTS
1. Introduction ... 11
2. Literature review ... 12
2.1. Valuation Methods ... 12
2.1.1. Discounted Cash Flow Approach ... 13
2.1.1.1. ECF discounted at required Cost of Equity ... 14
2.1.1.2. FCF discounted at WACC ... 14
2.1.1.3. Adjusted Present Value (APV) ... 14
2.1.1.4. APV, ECF or WACC ... 15
2.1.2. Forecasting expected cash flow ... 15
2.1.3 Types of cash flow ... 17
2.1.4. The Capital Asset Pricing Model (CAPM) ... 17
2.1.4.1. Risk Free Rate ... 18
2.1.4.2. Beta ... 19
2.1.4.3. Market Risk Premium ... 20
2.1.6. Balance Sheet Approach ... 21
2.1.7. Multiples Approach ... 21
2.2. M&A related issues ... 22
2.2.1. Types of M&A ... 22
2.2.2. Synergies ... 23
2.2.3. Payment methods ... 24
2.3. Private company related issues ... 24
2.3.1. Lack of Liquidity ... 24
3. Industry and Company Overview ... 26
3.1. Industry Overview ... 26
3.1.1. Cement Industry ... 26
Sofia Ferreira Cardoso M&A: The Case of Secil and Lafarge Betões 5/61
3.1.3. Market dynamics and trends... 30
3.1.4. Industry M&A historical ... 31
3.2. Company Profiles ... 32
3.2.1. Secil – Companhia Geral de Cal e Cimento, S.A. ... 32
3.2.2. Lafarge Betões, S.A. ... 36
3.3. Strategic Rationale for the Merger ... 37
4. Valuation ... 38
4.1. Secil Standalone Valuation ... 39
4.1.1. Cash Flow ... 39
4.1.1.1. Revenue Growth... 39
4.1.1.2. Operating Costs ... 40
4.1.1.3. Dividends, CAPEX, Depreciation and Minority Interest ... 41
4.1.1.4. Net Working Capital and Cash ... 41
4.1.1.5. Financial Leverage ... 41
4.2. Lafarge Betões Stand alone valuation ... 42
4.2.1. Cash Flow ... 42
4.2.1.1. Revenue Growth... 42
4.2.1.2. Operating Costs ... 43
4.2.1.3. Dividends, CAPEX and Depreciation ... 43
4.2.1.4. Net Working Capital ... 44
4.2.1.4. Financial Structure... 44
4.3. The Weighted Average Cost of Capital (WACC) ... 44
4.3.1. Risk-free rate ( ) ... 44
4.3.3. Betas (levered and unlevered) ... 45
4.3.4. Market risk premium ... 45
4.3.5. Cost of debt ... 45
4.3.6. Income Taxes ... 46
Sofia Ferreira Cardoso M&A: The Case of Secil and Lafarge Betões 6/61
5. Valuation of the Merged Company ... 47
5.1 Valuation of the Merged Company without synergies ... 47
5.2. Description of the Synergies ... 47
5.2.1. Cost synergy on production ... 47
5.2.2. Margin Synergy from dominant position ... 48
5.2.3. Cost of Restructuring ... 48
5.3. Valuation of the Merged Company with synergies ... 48
6. The Acquisition ... 48
7. Appendixes ... 51
Sofia Ferreira Cardoso M&A: The Case of Secil and Lafarge Betões 7/61 LIST OF APPENDIXES
Appendix 1: Ratings, interest coverage ratios and default spreads Appendix 2: Betas - levered and unlevered, by sector
Appendix 3: Market Risk Premium
Appendix 4: Secil base case balance sheet Appendix 5: Secil base case income statement Appendix 6: Secil cost of equity computation Appendix 7: Secil cost of debt computation
Appendix 8: Secil market value of debt computation Appendix 9: Secil market value of equity computation Appendix 10: Secil WACC computation
Appendix 11: Secil valuation using discounted cash-flow approach Appendix 12: Lafarge base case balance sheet
Appendix 13: Lafarge base case income statement Appendix 14: Lafarge WACC computation (Re)
Appendix 15: Lafarge valuation using discounted cash-flow approach Appendix 16: Lafarge optimistic scenario
Appendix 17: Lafarge pessimistic scenario Appendix 18: Lafarge Sensitivity Analysis Appendix 19: Merged entity valuation
Appendix 20: Merged entity valuation with synergies Appendix 21: Synergies summary
Sofia Ferreira Cardoso M&A: The Case of Secil and Lafarge Betões 8/61 LIST OF FIGURES
Figure 1: Largest Players in the Cement Industry Sales in 2009 (in M Tons) Figure 2: Portuguese cement companies’ market share
Figure 3: Cement Consumption Growth rates for Portugal and European Union, 2008 to 2010 Figure 4: Concrete market shares in 2009 (adapted from AdC)
Figure 5: Construction sector growth rates
Figure 6: Cement cost composition (adapted from Lafarge Annual Report) Figure 7: Sales (in 1000 t) by product
Figure 8: Secil revenues (% per country)
Figure 9: Secil CAPEX as a % of sales during from 2005 to 2010
Figure 10: Lafarge Betões Composition (Adapted from Lafarge Betões Annual Report 2010) Figure 11: Concrete market shares comparison in 2009 (adapted from AdC)
Figure 12: Concrete Cost Composition
Figure 13: Revenues growth rate, per country – The base case scenario Figure 14: Operating Expenses per country
Figure 15: Revenues growth rate – The optimistic scenario Figure 16: Revenues growth rate – The pessimistic scenario Figure 17: % on revenues for Lafarge Betões
Sofia Ferreira Cardoso M&A: The Case of Secil and Lafarge Betões 9/61 LIST OF TABLES
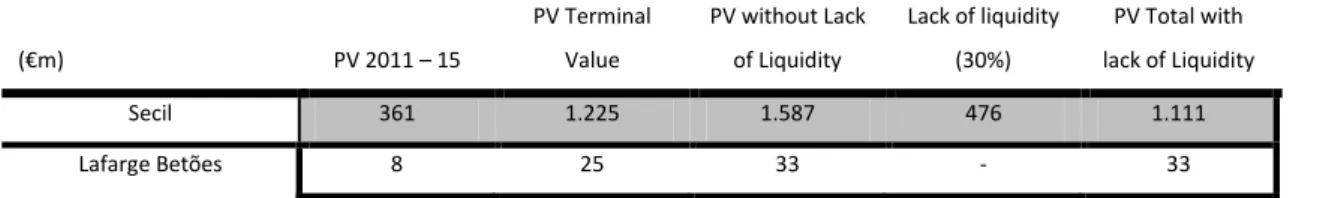
Table 1: Secil and Lafarge Betões standalone valuation results summary Table 2: Lafarge Betões valuation with synergies
Sofia Ferreira Cardoso M&A: The Case of Secil and Lafarge Betões 10/61 LIST OF ABBREVIATIONS
APV: Adjusted Present Value CAPM: Capital Asset Pricing Model CF: Cash Flow
DCF: Discounted Cash Flow
EBIT: Earnings before Interest and Taxes
EBITDA: Earnings before Interests, Taxes, Depreciation and Amortization ECF: Equity Cash Flow
ERP: Equity Risk Premium FCF: Free Cash Flow
FCFE: Free Cash Flow to Equity FCFF: Free Cash Flow to the Firm
: Cost of Debt
Require return on Equity Cost of the Unlevered Equity
M&A: Mergers and Acquisitions VR: Terminal Value
VTS: Value of the Tax Shields
WACC: Weighted Average Cost of Capital β: Beta
Sofia Ferreira Cardoso M&A: The Case of Secil and Lafarge Betões 11/61
1. Introduction
This study is a dissertation on Mergers & Acquisitions (M&A) using the example of the recent acquisition of Lafarge Betões by Secil.
In the case of this horizontal acquisition, there was public data available and it was subject of analysis by anti-trust authorities due to the fact that both companies operate in the concrete business.
The objective was to value the two companies separately and then perform the value of the combined firm and analyze if there was potential for value creation by the combined firm to justify the long-lasting and difficult process which is an acquisition.
Secil is major player in the cement industry, an industry that in Portugal has been subject to numerous acquisitions, since companies in the industry used acquisitions to grow.
This dissertation is formed by three parts, the literature review, the industry analysis and the companies’ valuation.
The main objective of the literature review is to appraise the main valuation methods mentioned in academic readings with special emphasis in the ones that are going to be utilized in the analysis. The literature review will also focus in the types of M&A and the strategic reasons that lead to the process of combining firms.
The Company and Industry overview will describe the cement and concrete markets with volumes, growth trends, main players, their market shares, the international markets where they operate, etc. Finally, the valuation of the companies, that leads to a deep analysis of the strategic and financial reasons that explain the acquisition of Lafarge Betões by Secil.
It was conducted a standalone valuation of both firms which sum is the value of the merged firm without synergies. Then it was estimated the value of the potential synergies by quantifying the strategic rational of the deal (market leader position in the concrete market and cost efficiencies) to obtain the value of the merged firm with synergies.
Finally, it was compared the value of the valuation with the value of the transaction and described the rational of both firms in the completion of this deal.
Sofia Ferreira Cardoso M&A: The Case of Secil and Lafarge Betões 12/61
2. Literature review
2.1. Valuation Methods
Damodaran (2006) considers that valuation is the “heart of finance” since it is a fundamental activity for corporate finance and portfolio management.
Fernández (2007b.) demonstrates how valuation is not only important to value a company and justify a premium in a public offer but it is also a primary tool to manage a company, being a guide to managers through some strategic decisions, such as:
Sell, buy, hold recommendations; Compare companies performances; Portfolio composition;
Valuation on business units to decide which one must sell, merge, abandon, etc; Measuring possible strategies;
etc.
The first three valuation objectives show how valuation of listed companies will help a company to be more competitive, and the other two are purely strategic decisions that managers have to make on a business daily environment, which reinforces the importance of valuation for companies.
In the literature it is possible to find numerous views about valuation classifications.
Damodaran (2006) considers four types of valuation: Discounted Cash Flow (DCF), Liquidation and Accounting, Relative Valuation and Real Options. These four types of valuations are going to be analyzed and discussed in the literature review.
It is important to clarify that researchers agree that for DCF and Relative Valuation there are two possible approaches: the Equity Valuation and the Firm Valuation.
The Equity Valuation estimates the value of the firm for the shareholders and the Firm Valuation the value of the enterprise as a whole including debt and equity (Young et al. 1999).
Damodaran (2006) distinguish the two approaches by the nature of the Cash Flows (CF) and the Discount Rate by considering that the cash flows for a firm valuation are the ones that come from the assets prior to debt payments and after reinvestment at the weighted average cost of capital and in
Sofia Ferreira Cardoso M&A: The Case of Secil and Lafarge Betões 13/61 the equity valuation, the cash flows are the ones that came from assets after debt payments and reinvestment discounted at the cost of equity.
The main conclusion is that to perform a firm valuation, analysts should use the weighted cost of capital, and to compute equity valuation the cost of equity is the correct discount rate. Although, there are different ways to compute each valuation approach and firm valuation requires more assumptions and both should result in the same company value.
2.1.1. Discounted Cash Flow Approach
In Discounted Cash Flow (DCF) valuation models, the value of an asset is the expected cash flows discounted at a rate that reflects the risk of the flow.
This method plays a prime role amongst all the valuation methods. Fernández (2007b.) states that the DCF valuation method is the only conceptually correct, as the value of a company is explained by the shareholders’ future Cash Flows.
Luehrman (1997a.) believes that DCF valuation is the best method to evaluate operating assets like a business or a plant.
The general formula to value and asset through DCF methodology is:
Where:
g = expected growth rate.
k = risk rate.
CF i = Expected cash flow for the period i. i = 1, 2… n.
The formula can be divided in two parts: the cash flow for the forecasted project life and the residual or terminal value (VR). As the forecasts are limited to a number of years, after that period it is assumed a terminal value considering a stable growth rate.
Sofia Ferreira Cardoso M&A: The Case of Secil and Lafarge Betões 14/61 Fernández (2009b.) refers to 10 DCF methods for valuing companies, the most common methods stated are:
FCFE discount at required Cost of Equity FCFF discounted at WACC before tax Adjusted Present Value (APV)
2.1.1.1. ECF discounted at required Cost of Equity
In this case, as the method takes in account the Equity Cash Flow (ECF), the correct rate to use is the required return on equity (Ke) which can be estimated using the Capital Asset Pricing Model (CAPM).
2.1.1.2. FCF discounted at WACC
In this method we are evaluating the company as a whole- Debt plus Equity- so the rate of discount must reflect the required return to equity and the cost of debt.
The Free Cash Flow (FCF) is discounted at a Weighted Cost of Capital (WACC) which is calculated by weighting the cost of debt and the return on equity in accordance with the financial structure of the firm. The following formula represents the WACC computation:
Where D represents the Market Value of Debt, E the Market Value of Equity, Kd the Cost of Debt before
Tax, Ke the Required Return on Equity and T the Tax Rate.
The formula above takes into account that the interest paid on debt is tax deductible. The interest tax shields lead to a lower WACC.
2.1.1.3. Adjusted Present Value (APV)
This method takes into account the value of the firm, it is calculated by aggregating the value of the firm as it had no debt with the “value of all financing side effects” like interest tax shield, subsidies, costs of financial distress, etc.(Luehrman 1997a.).
In the literature it is very common to find references just to the Value of the Tax Shields. If a company has debt it will have more financial costs and, consequently, the profit before tax will be lower, and so, the tax paid will be lower, which will result in saving in taxes, this is called Value of the Tax Shields (VPS).
Sofia Ferreira Cardoso M&A: The Case of Secil and Lafarge Betões 15/61 The value of the firm without debt is obtained by discounting the FCF at unlevered rate (Ku) or at a
required return on assets. If the firm has debt, the Ku is smaller than the cost of equity (Ke) because
shareholders will demand a higher risk premium since the existence of debt will result in an increase of the financial risk. The rate of discount used with VTS is a very controversial subject. The formula to value a firm using APV is:
2.1.1.4. APV, ECF or WACC
Luehrman (1997a.) considers “WACC is absolute” and suggests that APV (Adjusted Present Value) is a better tool because decompose all sources of value and permits a more accurate analysis.
Damodaran (2006) states that there is an advantage in using Free Cash Flow instead of Free Cash Flow from Equity because it is not required to take in account debt.
Damodaran (2006), states that the benefit of WACC is that it is easy to use when the leverage will change over time. Although, it s not possible to calculate WACC without the capital structure of the firm which makes WACC the correct method for companies with stable capital structure.
Fernández (2007b.)demonstrates that all methods, under consistent assumptions, will give the same result. In fact, WACC incorporates the tax benefit through adjustments in cost of debt, APV valuation of the tax benefit is calculated by discounting the savings related with existence of debt. Lastly, in a firm with no debt the ECF will be equal FCF (Fernández 2007a.).
Cooper and Nyborg (2006) conclude that with different assumptions about debt policy APV is consistent in all scenarios, while WACC and Equity cannot be used in certain situations.
In conclusion, besides all methods under the same assumptions give the same enterprise value, it is better to use WACC approach when the company financial structure does not have major changes and use APV in the opposite situation. The use of ECF is considered less interesting than WACC since it requires fewer assumptions and does not takes into consideration the companies leverage. 2.1.2. Forecasting expected cash flow
Sofia Ferreira Cardoso M&A: The Case of Secil and Lafarge Betões 16/61 Fernández (2007b.) proposes 3 stages to perform cash flow projections:
A. Financial forecasts, that include:
Income statement and balance sheet projections; Cash flows projections;
Investments projections; Financing projections; Terminal value forecast, and; Computations of various scenarios.
B. Strategic and competitive forecasts, which include: Industry evolution;
Competitive position of company, and; Competitive position of competitors.
C. Consistency of Cash Flow forecasts, that include: Financial consistency between forecasts; Comparison of forecasts with historic, and; Consistency with strategic analysis.
The Cash Flow forecast is a quantitative and qualitative process including subjective aspects in the analysis like the expected evolution of macroeconomic conditions, industry evolution, and other aspects mentioned above.
To understand the risk in a valuation it is good practice to consider a best, a worst and a base case scenario.
Ruback (2010) argues that the Cash Flow forecast can be biased in relation to the expected Cash Flow because the forecasts do not incorporate, e.g. the probability of downsizing. Therefore proposes to calculate the expected Cash Flow as the forecast plus a “missing component”. The formula is the following:
In this formula, represents the probability of downsizing, XL the forecast cash flow and XH the cash
Sofia Ferreira Cardoso M&A: The Case of Secil and Lafarge Betões 17/61 Damodaran (2006) suggests conservative cash flow haircuts according to the risk of the project. The residual value merits a special remark, for project life between 5 and 25 years, it represents between 79% and 26% of the valuation.
2.1.3 Types of cash flow
Depending from the approach Equity or Firm DCF models, it is possible to consider the two types of Cash Flows.
The Free Cash Flow to Equity (FCFE) or Equity Cash Flow is the value of equity. It can be represented by the following formula:
The Equity Cash Flow takes in account debt, which is obtained by subtracting from Free Cash Flow the debt and interest payments. The estimation of ECF takes into account the financial structure of the firm, by taking in account the payments of principal and interest as well the new debt.
FCFE represents the money available to shareholders.
The other type of cash flow is the Free Cash Flow to Firm (FCFF) or Free Cash Flow is the total value of the firm and can be represented by the following formula:
FFCF does not take into account the debt. The Free Cash Flow is obtained by the sum of operating income after tax, plus depreciation and variation in Fixed Assets and Working Capital.
FFCF is the money available to shareholders and creditors. 2.1.4. The Capital Asset Pricing Model (CAPM)
The CAPM is an important method for estimating the required return on equity. This method defines Ke
as:
Where the Ke is Required Return on Equity, Rf is the Rate of Return for Risk Free Investment, β is the
Sofia Ferreira Cardoso M&A: The Case of Secil and Lafarge Betões 18/61 The calculation of the cost of capital requires three inputs: the Risk Free Rate, the Equity Beta and the Market Risk Premium.
2.1.4.1. Risk Free Rate
A risk free investment is an investment where the expected return is equal to the real return. According Damodaran (2008) the risk free rate has two characteristics:
No default risk No reinvestment risk
The Treasury Bonds rate is normally used as a reference of the Risk Free Rate, the reason is as government can print currency so they are able to accomplish their obligations at least in local currency (Damodaran 2010).
However, there is the possibility that governments default in local currency in Damodaran (2010) opinion, one reason, among others, is the fact that the country don´t have the power to print currency as, for example, the case of Euro zone countries and points out the following variables to measure the country default risk:
Degree of indebtedness (Debt as % of GDP); Revenues/Inflows to government;
Stability of revenues which lies with the degree of diversification of the economy and a tax system based on sales instead of income based;
Political risk since the default is in essence a political decision; Implicit support from others entities.
German Treasury bonds are often a reference as risk free rate. In fact the German T bonds are classified AAA by rating agency Moody´s the higher classification in local and foreign currency. The rationale behind this rating (Moody’s, 2012) are the following factors:
Economic strength – very high Institutional strength– very high
Government Financial strength– very high Susceptibility to event risk – very low
Sofia Ferreira Cardoso M&A: The Case of Secil and Lafarge Betões 19/61 Concerning the second characteristic, it is important to choose a rate which tenor matches the investment horizon, because if timing is inferior to the timing of the project, it will be required to reinvest at a rate that is not known.
2.1.4.2. Beta
The Beta (β) measures the systematic risk of an asset relative to the market portfolio, i.e., it is a measure of the volatility of the asset return compared with the market returns.
The formula used to compute the beta is:
Where:
Ra = Return on a Asset, and;
Rp = Return on Portfolio.
If β is zero the return on the asset is independent of the market portfolio, if beta is 1 there is a perfect correlation between the return on asset and return on portfolio.
This is a historical measure carrying three problems in its calculation (Damodaran 1999): Witch market index to use?
Witch time period? Witch return interval?
The market index should be representative of the market where the investor is located. One solution is to analyze the largest stockholders and chose the markets more associated with the investors.
As a historical measure it may not reflect the current market conditions. In order to mitigate this, Damodaran (1999) suggests the use of, for example:
Modified Regression Betas, that consists in adjusting historical Betas with the current information about market capitalization, dividend yield and operating income; Relative risk measures as relative volatility;
Sofia Ferreira Cardoso M&A: The Case of Secil and Lafarge Betões 20/61
2.1.4.3. Market Risk Premium
Damodaran (2011) states that the determinants of the Equity Risk Premium are: Risk aversion; Economic risk; Information; Liquidity; Catastrophic risk; Irrational compared.
There are three estimation approaches to determining the market risk premium.
The first estimation approach is the historical approach. This approach consists in estimating the returns of an asset during a period and compare it with the risk free investment.
Damodaran (2011) mention that this approach is only applicable in markets with a reliable history and Fernández (2004) states that this method has inconsistent results “the market will value a share higher after a bad year than after a good year”.
The second approach is survey approach, which consists in identifying a subset of investors / managers or academics and ask them what are the expected returns. This method is, obviously, not very reliable. The third method to estimate the risk premium is the implied premiums. This method is one of the most popular methods; it is a DCF based method that consists in applying the Gordon Shapiro formula:
It assumes that the growth in dividends in the long term will be equal to risk free rate and the dividends yield will be the Equity Risk Premium (ERP).
This model has the advantage of not requiring historical data and, if we believe markets are efficient, will be the best approach (Damodaran 2011). Campbell and Shillem (1988) consider this method as the one with the best predictive power.
Sofia Ferreira Cardoso M&A: The Case of Secil and Lafarge Betões 21/61 Regarding the Portuguese market risk premium, the source that was considered was the study: ‘Market Risk Premium used in 5 countries in 2011: A Survey with 6014 answers’ by Pablo Fernández, Javier Aguirreamalloa and Luis Corres.
2.1.6. Balance Sheet Approach
This type of valuation is based on balance sheet valuation. The balance sheet shows the situation in a certain date and therefore the valuation that is obtained is a static valuation.
It is different from methods like the CF valuation that estimates the value by taking in account expected cash flows.
Fernandez (2007b.) refers four methods: book value, adjusted book value, liquidation value and substantial value.
The liquidation value is used often in a scenario of closure (Damodaran 2006). 2.1.7. Multiples Approach
Damodaran (2006) refers to multiples as a comparable tool for firm values. They are simple estimates, based upon market experience, that allow a cross reference with the other more sophisticated methods, such as the DCF valuation.
According to Goedhart et al. (2005), although the multiples are considered the simplest valuation method there are two major problems:
Defining a peer group;
Defining the right multiples.Kaplan (1996) consider that the relative valuation method relies on two assumptions, (1) the comparables companies are assumed to have expected future Cash Flow that grow at the same rate and have the same level of risk as those of the firm being valued and (2) the value of the firm is assumed to vary proportionally to the changes in the variables being measured.
Goedhart et al. (2005) defends that there are four main principles in the multiples approach, those are:
Use peers with similar prospects for ROIC and growth;
Use forward looking multiples;Sofia Ferreira Cardoso M&A: The Case of Secil and Lafarge Betões 22/61
Adjust the EV/EBITDA for non operating itemsAccording to Liu et al. to improve the multiples performance, the analysts should compare companies in the same industry.
Forward-looking earnings forecasts reflect value better than historical accounting information, accounting accruals add value-relevant information to cash flows, and profitability can be better measured when revenue is matched with expenses.
Multiples based on the residual income model, which explicitly forecasts terminal value and adjusts for risk; perform worse than simple multiples based on earnings forecasts.
Liu et al. (2000) considered that multiples based on forward earnings give a better comparable value for the firm followed by historical measures, cash flow measures and book value, the multiples related to sales are considered to give the worst comparable value about the companies.
There is a main discussion about which multiple to use to value a company. According to Liu el al. (2000) there are no specific multiples for each specific industry. Instead there are some principles to take into consideration.
On the other hand, Fernández summarized the most current multiples in 18 industries. In Building and Construction he refers P/LFCF, EV, ECF, PER and EV/EBITDA.
Analysts put up with the question of which is the ideal method to use to perform a more accurate valuation of a company, Kaplan et al. (1996) have the opinion that discounted cash flow and the multiples methods used together will give a more reliable valuation.
According to Fernández (2007b.) one of the methods used to value cement companies is by multiplying the annual production capacity by a multiple.
2.2. M&A related issues
2.2.1. Types of M&A
According to Ruback et al. (1983) takeovers can be classified into three types: 1. Merger;
2. Tender Offer; 3. Proxy Contest.
Sofia Ferreira Cardoso M&A: The Case of Secil and Lafarge Betões 23/61
In a merger and tender offer the bidding company offers a price for the target firm that is higher to the target’s market value. This is due because they expect to have some synergies related to the
acquisition.
The major difference between a merger and a tender offer is to whom the offer is made to.
In a merger the bidding company negotiates with the target company’s managers and in a tender offer the bidding company makes its proposal to the shareholders of the target company.
In a proxy contest a group of former managers or large shareholders propose to take control of the company, and so there are no expected synergies.
2.2.2. Synergies
When a company acquires another company, acquires with the expectation that it is going to create additional value which was not possible to create alone, that value is called synergy.
Damodaran (2005) classifies synergies into two types, operating synergies and financial synergies. Operating synergies are those synergies that have an effect on the operations of the combined firm and the payoff results in higher expected cash flows. Operating synergies can come from different sources, such as:
1. Economies of scale; 2. Greater pricing power;
3. Combination of different functional strengths, and 4. Higher growth in new or emerging markets.
These sources can be achieved in different ways, in the first two cases it can be achieved by firms in the same business (horizontal acquisition).
Ruback et al. (1990) study showed that the operating cash flow of firms subject to mergers has increased more than those that were not involved in a merger. It is also evident that these sources of cash flows come from the increase in assert turnover and so an increase on margins.
On the other hand, Financial Synergies result in higher cash flows or/and lower discount rates. Financial synergies also can have different sources, such as:
Sofia Ferreira Cardoso M&A: The Case of Secil and Lafarge Betões 24/61 2. Diversification.
3. Tax benefits.
4. Increase in debt capacity.
Ruback et al. (1983) have a different perspective on synergies, considering that the only sources are: Production or distribution costs ( Economies of scales, vertical integration, more efficient
production, bidder’s management team, decrease on agency costs);
Financial Motivation ( avoid bankruptcy costs, increase on leverage, tax advantages); Market power;
Eliminate inefficient target management.
Besides some analysts concluding that M&A destroy value for the shareholder’s, Bruner (has a different view by analyzing that most studies are biased.
2.2.3. Payment methods
In M&A there are 2 payment methods, Cash and Stock (shares) and the deals are classified according to their payment method: cash only, stock only or mixed.
As per Faccio and Masulis (2004) there is no ideal method, in a successful deal, both parties had to be satisfied with the payment structure.
Amongst several, these are some of the considerations in the choice of the payment method. Cash is mainly obtained via debt, therefore highly levered companies tend to use stock in their acquisitions. Large companies with better access to the debt markets will tend to cash finance their deals. Firms will use stock when its stock is overvalued an use cash when their stock is undervalued.
2.3. Private company related issues
As private companies have no information that can be analyzed as public traded companies it is more difficult and subjective to make a valuation of this type of companies and so, there is a need to use information of public traded companies to value private companies.
2.3.1. Lack of Liquidity
Lack of liquidity is an issue that arises when valuing a private company.
As there is no observable information about private companies, analyst sometimes have to use the same information of comparable public companies, and because these two type of companies are
Sofia Ferreira Cardoso M&A: The Case of Secil and Lafarge Betões 25/61 different from each other a percentage has to be discounted to the valuation made of a private held company. This percentage that reflects the different characteristics between private and public companies is called the lack of liquidity.
There are numerous views about the discount that must be applied.
According to Kopelin, j., Sarin, A. and Shapiro, C.A. (2000) there are two types of empirical studies used by analyst and investment banks:
Restricted Stock Studies; Pre-IPO Discount.
In a study developed by Koeplin et all (2000), in which they critique the two empirical studies above, they compared a set of private and public company transactions and found the percentage of the difference between the two types of transactions. This study reaches to the following conclusions:
When using earnings multiples the average private company discount is higher than when using book value multiple (between 20% and 30% when using earnings multiples);
The average discount for Non US –companies is higher than for US Companies (between 40% and 50% for Non US-companies).
In the same study followed by Koeplin et all (2000) they also found a simple way to find the discount that must be applied to private company valuation. The simple way is using the following formula to estimate the private company discount:
Damodaran gives two different alternatives to reach the discount that must be applied that reflects private companies’ illiquidity. These two approaches are:
Approach 1: Use a discount of 20% and adjust the value for the size of the company, larger firms should have a smaller discount.
Approach 2: Estimate the liquidity discount thought a regression function of four determinants. Those determinants are the size of the firm, CF stability, assets type and the firm capacity to generate CF and apply the numbers in the formula.
As can be observable Damodaran also agrees that to smaller firms a higher discount should be applied. Damodaran presents in approach 1 discounts only for US-companies, when using multiple based on revenues which are lower than Koeplin, J. et all (2000) found on their research for Non US-companies and using earnings multiples. For the valuation of Non US-companies and using earnings multiples the 20% rate should be adjusted to have a more credible discount.
Sofia Ferreira Cardoso M&A: The Case of Secil and Lafarge Betões 26/61
3. Industry and Company Overview
3.1. Industry Overview
This thesis has the purpose to analyze two companies, Secil and Lafarge Betões and their industries. Secil operates mainly in the cement and concrete industry worldwide and Lafarge Betões in the concrete industry in Portugal, it will be analyzed, both, the cement and the concrete industry. 3.1.1. Cement Industry
Cement industry is very concentrated, with few international companies competing with national producers. Those international companies are Lafarge, Buzzi, Cemex, HeiddelbergCement, Holcim and Votorantim.
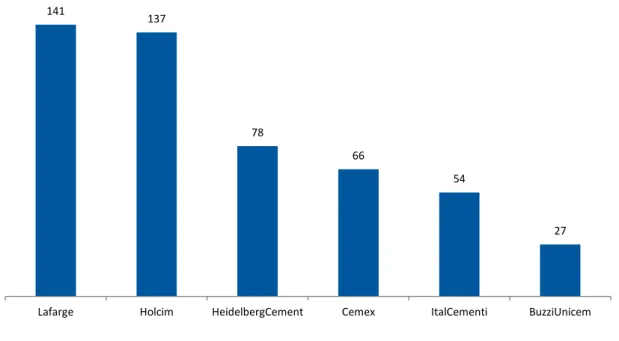
Figure 1 reflects the concentration in the cement industry, representing the sales in million tons in 2009.
The figure shows how in 2009, the total cement consumption was 2.980 million tons, which means that the world’s top producers contributed, at the time, for approximately 17% of the total consumption. Figure 1: Largest Players in the Cement Industry Sales in 2009 (in M Tons)
Source: Global Cement Report 9th Edition
In the figure it can be noticed that Lafarge is the largest player in the world followed by Holcim. To have some idea of future strategies of the largest player in the industry, Lafarge has production facilities in every continent and its future strategy is to focus on cement production.
141 137 78 66 54 27
Sofia Ferreira Cardoso M&A: The Case of Secil and Lafarge Betões 27/61 In 2010 the world total production of cement was 3.3 billion tons, which represents a growth of 9.2% relatively to 2009 and an average growth of 5% during the last 20 years.
According to Lafarge 2010 annual report, the cement consumption growth in the recent past was mainly justified by the emerging markets, namely, China, Brazil, India and Sub Saharan Africa. China represents 56.1% of the worlds overall production being the world’s largest cement producer. It is interesting to note that the cost of transporting cement by road or rail is very expensive. The only viable way to transport cement is by sea. This explains the fragmentation of the cement production, with a high number of plants around the world.
Portuguese market is very concentrated, in this very capital intensive market the 2 major players - Cimpor and Secil- have 94% market share of the cement industry as represented in figure 2. Figure 2: Portuguese cement companies’ market share
Source: Secil Annual Report 2010.
Since 2002 the cement consumption has been decreasing, being important to emphasize that the consumption in 2010 represents half of the cement consumption in 2001. Figure 3 represents this decrease on consumption from 2008 to 2010.
Figure 3: Cement Consumption Growth rates for Portugal and European Union, 2008 to 2010
Source: Secil Annual Report 2010.
54% 40% 6% Cimpor Secil Other -8% -15% -6% -24% -11% 2008 2009 2010 Portugal European Union
Sofia Ferreira Cardoso M&A: The Case of Secil and Lafarge Betões 28/61 As Portugal, the European Union has been suffering a significant decline on cement consumption with a decrease of 24% in 2009.
In Portugal, cement consumption was 5.803 million tons in 2010, and it is expected by ATIC information report to decrease by 15% in 2011 and 14% in 2012, because of the financial
circumstances that lead to cuts on public expenses, and restrictions on credit access that influence the construction business.
In 2010, Portugal produced 8.3 billion tons of cement from which 33% was exported mainly to Africa (77%).
In Portugal, the cement production reached the 8.3 billion ton in 2010, from which 4.8 billion tons (58%) were produced by Cimpor, and 2.7 billion tons (33%) produced by Secil. These 2 players represent 91% of the total production in Portugal. .
The emergent countries represent an opportunity for the sector because of their growth rates lead by their Governments’ policies on Public works.
In the case of Secil, the three international relevant markets are Lebanon, Tunisia and Angola. Lebanon
Lebanon is an economy that is growing continuously year on year. However, according to Global Cement Report the industry forecast for the growth of this market of 5.1 billion tons is 0% for 2011 and -1% for 2012.
Tunisia
In Tunisia, one of the measures adopted in 2010 by the Tunisian Government in order to minimize the effects of the crisis was to invest heavily in the construction business. As result the cement market increased 10%
Also, the Tunisian government has announced the liberalization of the market but until now it has not yet been implemented.
The future market trends are uncertain due to ‘Arab spring’ after the departure of Ben Ali after 23 years of government.
However, according to the Global Cement Report the global cement market t is expected to decrease by -5.7% in 2011 and -1.2% in 2012.
Sofia Ferreira Cardoso M&A: The Case of Secil and Lafarge Betões 29/61 Angola
Angola cement consumption reached 3.8 billion tons in 2010 and, although, the government is
reducing the investments in Public works, the cement consumption is expected to grow 13.2 % in 2010 and 18.6% in 2012 according to the Global Cement report.
However, this market is not very attractive as it is dominated by the low quality but low cost Chinese cement.
3.1.2. Concrete Industry
Concrete is a material that deteriorates rapidly, it only takes one hour to have the desired quality, which means that it only can be sold in a 30<>40 km radio.
In opposite to cement that can be sold nationally, concrete is only sold locally. As the cement, concrete is also driven by the construction business.
The concrete market represents 7 billion tons, having decreased 18% in 2010 as result of the declining construction business.
As Secil, most companies that produce cement are also present in the concrete market, following a vertical integration policy.
Concrete market is also a concentrated market in figure 4 bellow it can be analyzed the market structure. The 3 largest players own 67% of the market, which can be compared with the international cement market where the 2 major players have 94% of the market.
In the concrete industry in Portugal the remaining 40% of the market is very fragmented with several minor local players.
Figure 4: Concrete market shares in 2009 (adapted from AdC)
Source: AdC report on Lafarge acquisition by Secil.
29% 21% 10% 40% Cimpor Secil Lafarge Others
Sofia Ferreira Cardoso M&A: The Case of Secil and Lafarge Betões 30/61 3.1.3. Market dynamics and trends
As said before, the cement and concrete sector face severe difficulties due to the economic and financial crisis.
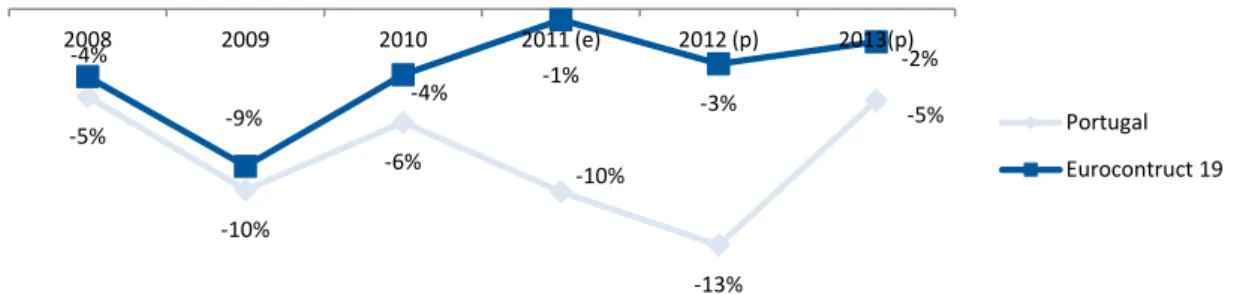
According to Euroconstruct 2011 the construction output are expected to decline 13% in 2012 and 5% in 2013. The European market is estimated to decrease only -3% in 2012 and -2% in 2013.
Figure 5 compares the expected results for the construction business for Portugal and Eurocontruct 19 countries.
Figure 5: Construction sector growth rates
Source: Eurocontrusct 2011.
According to Euroconstruct 2011 it is expected that the emergent markets will continue to lead the Global Market Growth due to their demographics and residential infrastructure demand growth in opposite to the European market, which includes Portugal, which is expected to continue the declining tendency.
According with Secil reports, the main revenue drivers in the cement and concrete industry are: Residential Construction, which is driven by the demographic, standard of living, interest rates
and financing conditions;
Public Works, that are driven by the public investments;
Other Constructions (non residential), driven by the economic activity and investments, such as touristic and commercial equipments, plants, etc.
The economic and financial crisis that triggered in 2008 also led to: More control in transportation costs;
More preservation of the quality of the products;
Increase on the production of more ecological and efficient products; Improved sustainability of the products.
-5% -10% -6% -10% -13% -5% -4% -9% -4% -1% -3% -2% 2008 2009 2010 2011 (e) 2012 (p) 2013(p) Portugal Eurocontruct 19
Sofia Ferreira Cardoso M&A: The Case of Secil and Lafarge Betões 31/61 These trends in the cement market led to an increase on production and logistic costs which structure is as presented in figure 6.
Figure 6: Cement cost composition (adapted from Lafarge Annual Report)
Source: Lafarge Annual Report 2010.
As showed in figure 6, energy represents 29% of total cement production costs. The energy cost is a very sensible topic in this industry and, with the increased oil prices, it is growing.
It is also an industry capital intensive with the depreciation of the investment representing 12% of the total cost.
3.1.4. Industry M&A historical
The cement industry was very fragmented. In the 70’s, with the beginning of the globalization process, started a tendency to constitute big groups in Europe.
In the 80’s these big companies had a tendency to move to America where the growth rates, at the time, were appealing.
In the early 90’s, after the fall of the Berlin wall there was an opening to foreign western investment in Eastern Europe that become the investment “hot spot”, a trend that was followed by the cement producers.
Currently, the growth is in the emergent markets like China, India, Brazil and South Africa.
As the cement market is a local market, the international trade represents only 5%. In order to sustain a long-run growth, the companies have to acquire companies in the new markets or construct new facilities. 32% 29% 27% 12% Depreciation Raw Materials Energy Labor
Sofia Ferreira Cardoso M&A: The Case of Secil and Lafarge Betões 32/61 The cement demand depends upon demographic growth and urbanization and therefore the big companies follow these international trends trying to implement new facilities in the fast growing emerging markets.
In the recent years, due to the financial crisis, the number of acquisitions was reduced. Anyway, there were some important M&A deals:
(2010) Lafarge sold the Cimpor stake to Votoramtim in exchange for the cement operations in Brazil;
(2010) HeidelbergCement acquired the remaining 50% of Pioneer North Queensland, Australia, 3 cement plants in the Democratic Republic of Congo and the majority of CJSC Construction Materials, Russia
(2009) Lafarge acquired Larson&Toubro Group, Leader in ready mix concrete in India; (2009) Holcim bought Cement Australia;
(2008) Lafarge acquired Orascom cement, the cement leader in Middle East and Asia.
3.2. Company Profiles
3.2.1. Secil – Companhia Geral de Cal e Cimento, S.A.
Founded in 1930, Secil – Companhia Geral de Cal e Cimento is the result of a merger between Secil and Companhia Geral de Cal e Cimento.
Secil is a participation of SEMAPA, a company quoted in the Euronext Lisboa that operates in three different markets:
Cement and Buildings Materials through Secil – Companhia Geral de Cal e Cimento, S.A.; Paper and Pulp through Portucel – Empresa Produtora de Papel e Pasta Papel, S.A.; Environment through ETSA – Empresa de Transformação de Subprodutos Animais, S.A.
SEMAPA owns 51% of Secil share of capital jointly with CRH plc an Irish group that also operates in the production of building materials, which includes cement and concrete. After a legal dispute, SEMAPA is currently acquiring the CRH share.
Secil is the second major player in the Portuguese Cement Market, with annual revenues of €536m and a cement production capacity of approximately 4,0 million tons.
Although Secil core business is cement, it competes in other markets, such as, concrete, precast concrete, clinker, aggregates, mortars and binders.
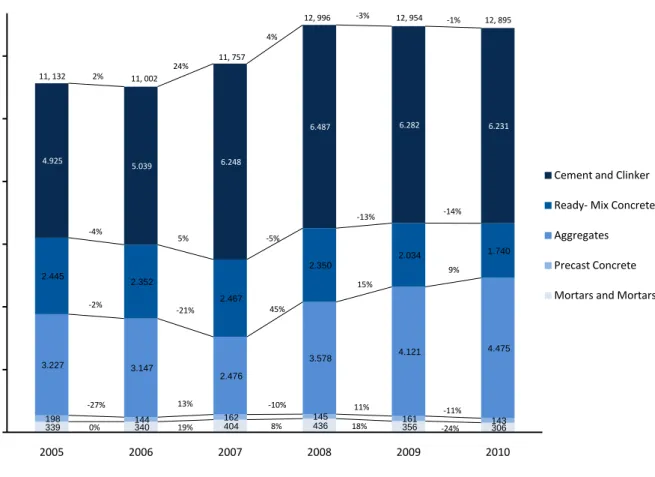
Sofia Ferreira Cardoso M&A: The Case of Secil and Lafarge Betões 33/61 The graphic below represents the evolution of sales in quantities by product from 2005 to 2010. Figure 7: Sales (in 1000 t) by product
1
Source: Company’s data.
According to the company data, Cement & Clinker and Aggregates represent more than 80% of the company’s production.
As can be analyzed in figure 7, since 2008, all products produced by the company have shown a
tendency to decrease sales quantities with the exception of the ready- mix concrete that have shown a growth trend during that period.
Cement and clinker consumption decrease is due to the grey cement sales that have shown a bad performance in the recent years, mainly due to the financial crisis that has affected the construction business.
The production of concrete is the third source of revenues for Secil that has 43 concrete production facilities covering almost all the Portuguese territory and annual revenues of €120m in 2010.
1 Excluding Artificial and Hydraulic Lime.
339 340 404 436 356 306 198 144 162 145 161 143 3.227 3.147 2.476 3.578 4.121 4.475 2.445 2.352 2.467 2.350 2.034 1.740 4.925 5.039 6.248 6.487 6.282 6.231 2005 2006 2007 2008 2009 2010
Cement and Clinker Ready- Mix Concrete Aggregates Precast Concrete
Mortars and Mortars Fixatives 11, 132 11, 002 11, 757 12, 996 12, 954 12, 895 2% -3% 4% 24% -1% -4% 5% -5% -13% -14% -2% -21% 45% 15% 9% -10% 13% -27% 11% -11% 19% 0% 8% 18% -24%
Sofia Ferreira Cardoso M&A: The Case of Secil and Lafarge Betões 34/61 Secil competes in five different countries, Portugal, Tunisia, Lebanon, Angola and Cape Verde, each country have shown different trends in the latter years.
Portugal is in a financial crisis, Tunisia and Lebanon are growing as result of the ‘Arab spring’ and Angola, despite the economic growth, the cement market is not attractive due to the lack of
investment in public works by the government and the fact that the Angola only buys Chinese cement. As represented in figure 8 bellow, Portugal contributes for 61% of Revenues followed by Lebanon that contributes for 15%.
Figure 8: Secil revenues (% per country)
Source: Company data
Although, Portugal represents 61% of Secil total revenues, since 2002 it has been following a
decreasing tendency. In 2010 the EBITDA of the Portuguese Business Unit decreased 11%, mainly due to:
Decrease on sales for the internal market; Increase on energy costs.
According to the company data, Lebanon represents 15% of Secil total revenues. This is mainly justified by its economic growth of 8% in 2010, 3 points above the world economy for the same year.
The company entered in the Lebanon market in 2002 through the acquisition of 21.2% of CDS – Cement de Sibline.
In what concerns to the construction business and to the cement consumption, Lebanon showed very positive trends. The construction business continues to grow and that is reflected on the internal cement consumption that has a growth rate of 7%.
61% 15% 13% 5% 6% Portugal Lebanon Tunisia Angola Others
Sofia Ferreira Cardoso M&A: The Case of Secil and Lafarge Betões 35/61 Although, there was a negative impact from the increase on fuel prices, Lebanon business unit performance was considered very positive with the 8% growth on business volume and 6% growth on EBITDA.
Tunisia, that has contributed with 13% of Secil revenues, is a business unit that, as Lebanon, had a positive performance with a growth of 3% on business volume and 14% on EBITDA.
Similarly to what happened in Lebanon, in 2000, Secil entered into the Tunisian market through the acquisition of the “Societé des Ciments de Gabès”.
Tunisia is expected to grow in the near future due to the anti-crisis government incentives to public works and construction business, which resulted on a cement and artificial lime consumption of 7.2 Million tons in 2010, an increase of 9.7% compared with 2009.
In what concerns to Angola, this business units is not performing so well representing only 5.0%% of the company revenues.
In the same year that the company acquired the Tunisian Business Unit, it has also acquired 70% of the Angola Business Unit.
Angola is an emerging market that is growing very fast, being expected to grow 5.9% in the coming years. However, the construction sector is falling due to the reduction of public works.
Furthermore, the Government has preferred to import the low quality but cheaper cement from China rather than the local production.
It is important to mention that Secil also operates in Cape Verde, this business unit is not a significant for Secil, representing only 1% of the company revenues, but the economy is growing 4.1 %/year so it can be seen as a growing opportunity in the future.
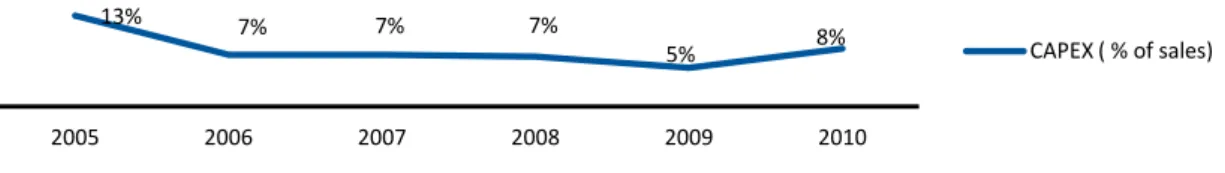
It is important to analyze the investments made by the company in the latter years. Figure 9 represents those investments as a percentage of sales.
Figure 9: Secil CAPEX as a % of sales during from 2005 to 2010
Source: Secil Annual Reports 2005 – 2010.
13% 7% 7% 7%
5% 8%
2005 2006 2007 2008 2009 2010
Sofia Ferreira Cardoso M&A: The Case of Secil and Lafarge Betões 36/61 During the period from 2006 to 2008 Secil investment has declined to 7% of sales every year, a value that decreased 2 points in 2009.
In 2010, mainly with operational activities, the trend increased to 8% of sales. This trend of growing the investment effort is being confirmed with the recent interest of SEMAPA in acquiring CIMPOR.
3.2.2. Lafarge Betões, S.A.
Lafarge is one of the biggest construction companies in the world, with their headquarters established in France.
Since 2009, Lafarge followed a divestment strategy that has lead to the sale of Lafarge Betões, a Portuguese company owned by the group.
Founded in 1973, Lafarge Betões operations are based in the production and supply of concrete, mortars and aggregates owning 26 concrete plants and 5 aggregates facilities in Portugal. Lafarge Betões only operates in Portugal and had a business volume of € 56 million in 2010.
In 2010, due to the current economic environment that has heavily affected the construction business; the volume of Lafarge has declined by 20%.
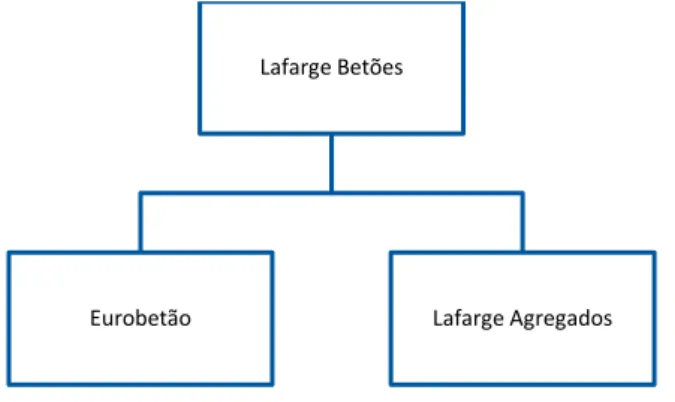
Lafarge Betões is composed by a simple structure, formed by three companies that are not fully consolidates its accounts.
As shown in figure 10 Lafarge Betões is composed by Lafarge Betões the mother company and also by Eurobetão and Lafarge Agregados.
Figure 10: Lafarge Betões Composition (Adapted from Lafarge Betões Annual Report 2010)
Source: Lafarge Annual Report 2010.
Lafarge Betões
Sofia Ferreira Cardoso M&A: The Case of Secil and Lafarge Betões 37/61 Lafarge Betões exerts a commercial activity, i.e., produces and sells Ready-mixed, Eurobetão owns some assets and lease those assets to Lafarge Concrete, Aggregates and Lafarge Agregados that also pursues business producing and exploring gravel.
3.3. Strategic Rationale for the Merger
In December 2010, Secil signed the contract to acquire Lafarge Betões, a company valued in € 65 million.
Lafarge Betões plays in the concrete and aggregates industry.
There are 3 reasons that justify the strategic rationale for the acquisition of Lafarge by Secil. Those are: Market Power;
Vertical Integration; Horizontal Integration. Market Power
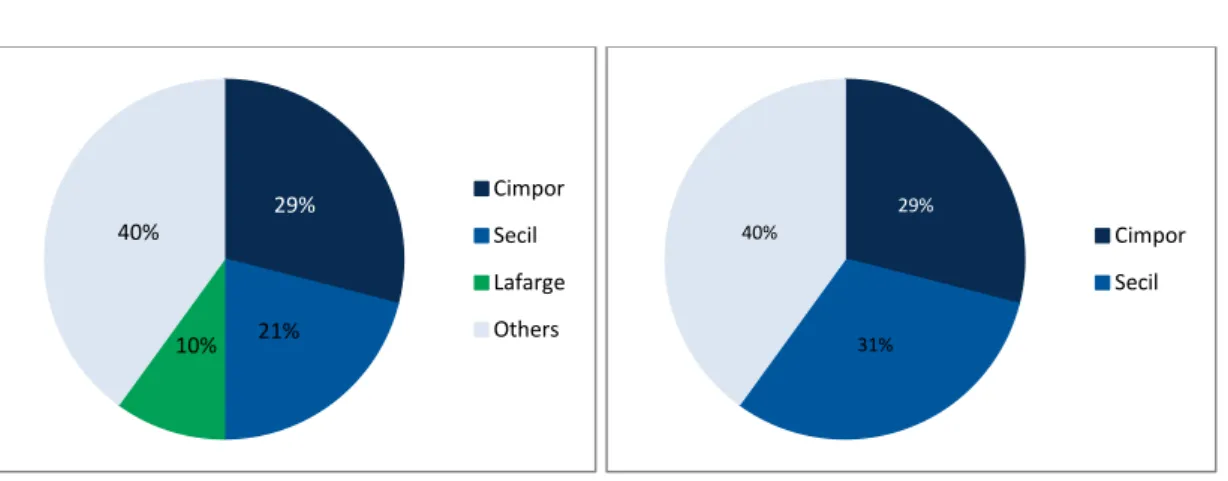
Basically and as per picture bellow, with this acquisition Secil gains a large part of the concrete market in Portugal:
Figure 11: Concrete market shares comparison in 2009 (adapted from AdC)
Source: AdC report on Lafarge Betões acquisition by Secil.
Before the acquisition, Cimpor was the market leader of the concrete market with 29% of the market, after the acquisition Secil is now the leader with 31% of the market.
Also, with the acquisition, Secil is now the owner of more 26 concrete plants adding to the current 43 and more 5 aggregates plants.
This acquisition gave Secil the market strength to compete with Cimpor.
29% 21% 10% 40% Cimpor Secil Lafarge Others 29% 31% 40% Cimpor Secil
Sofia Ferreira Cardoso M&A: The Case of Secil and Lafarge Betões 38/61 Vertical Integration
Concrete costs are the following: Figure 12: Concrete Cost Composition
Source: Lafarge Annual Report 2010.
The raw materials of concrete are composed with cement and aggregates, the target company can beneficiate from the fact that Secil already produces cement and reduce costs.
Horizontal Integration
As already stated, one of the markets where Secil operates, as Lafarge Betões does, is the concrete market.
The fact that both, Secil and Lafarge, operate in the same market could lead to economies of scale or economies of scope, reducing the production costs and having higher margins.
4. Valuation
The main objective of this thesis is to analyze and evaluate the acquisition of Lafarge Betões by Secil, as referred before this process is composed of 2 phases.
The first phase will value Secil and Lafarge Betões standalone and the second phase will value Secil after the acquisition of Lafarge Betões including the synergies generated by the acquisition.
The value of the combined firm will be compared with the sum of the value of the two entities. The added value of the synergies will reflect the strategic reasons behind this acquisition.
Relatively to the historical data used to analyze both companies and perform the standalone valuation, only the euro currency was considered. Although, Secil revenues could be affected by the currency risk, Secil has a policy of covering the currency exposure via the hedging inside the Group. When this is not possible, Secil establishes options contracts for the currency risk.
70% 20% 10% Other Delivery Raw Materials
Sofia Ferreira Cardoso M&A: The Case of Secil and Lafarge Betões 39/61 The following historical data was considered for the Secil and Lafarge Betões valuation:
For the Secil historical analysis it was considered data from 2007 to 2010; For the Lafarge historical analysis it was considered data from 2009 to 2010.
Although for Secil only the first scenario was analyzed for both firms, 3 scenarios were taken into consideration:
The base case scenario; The optimistic scenario; The pessimistic scenario.
For all these scenarios it was assumed a project life of 5 years explicit period. A perpetuity was then included as VR.
The valuation method that will be used is the WACC - based DCF valuation, because it was the one that is considered by analyst the right one to values private companies Secil and Lafarge Betões.
4.1. Secil Standalone Valuation
4.1.1. Cash Flow
4.1.1.1. Revenue Growth
In the base case scenario, it was assumed that the Portuguese revenues will follow the construction business trend as forecasted by Euroconstruct 2011 for 2011 to 2013.
As Damodaran (2009) states, in the valuation of a company that competes in a cyclical market, like the cement and concrete market, that follow the economic fluctuations, it is important to incorporate in the analysis the impact of growing and recession periods.
For that purpose, it was considered that 2011 – 2013, as predicted by construction and industry forecast, will be recession years, but 2014 – 2015 will be growth years.
The following growth rates were considered: The Euroconstruct 2011 until 2013;
As no further data is available in the Euroconstruct 2011, from 2014 to 2015 explicit period, it was considered a growth of 5% for Portugal and for all the other countries where Secil
operates. This 5% forecast is in line with the last 20 years world consumption growth as per the Lafarge Annual Report. This assumption was considered in the three scenarios.
Sofia Ferreira Cardoso M&A: The Case of Secil and Lafarge Betões 40/61 Figure 13 bellow briefly represents the summary of the growth rates per country for each year in the base case scenario.
Figure 13: Revenues growth rate, per country – The base case scenario
Source: Euroconstruct 2011 and forecasts of this study
In the base case scenario it was assumed a Terminal Value after 2015, for both emerging and the Portuguese markets, considering a flat growth of 3%/year.
4.1.1.2. Operating Costs
Secil Annual Report does not disclose the cost items in the Income Statement, it only discriminates the total EBITDA per country, for that reason it was only possible to find the total operating costs for each region where Secil operates.
It was not possible to understand in the cost structure the percentage of overheads in the total cost or the percentage of variable versus fixed costs.
For the computation of the operating margin it was considered the weighted average of the operating costs on revenues for each country. Figure 14 represents the operating percentage on sales by country average used to forecast the EBITDA.
Figure 14: Operating Expenses per country
Source: Secil Annual Report 2010.
2010 2011 (E) 2012 (E) 2013 (E) 2014 (E) 2015 (E)
Portugal -6% -10% -13% -5% 5% 5% Lebannon 8% 0% -1% 0% 5% 5% Tunisia 3% -6% -2% 1% 5% 5% Angola -43% 1% 1% 1% 5% 5% Others -9% 0% 0% 0% 5% 5% 27% 36% 24% 10% 96% 73% 64% 76% 90% 4%
Portugal Lebanon Tunisia Angola Others
Operating Expenses EBITDA
Sofia Ferreira Cardoso M&A: The Case of Secil and Lafarge Betões 41/61 In appendix 5 there is the Secil base case income statement forecasted for analysis.
4.1.1.3. Dividends, CAPEX, Depreciation and Minority Interest
This valuation assumes a dividend payment rate similar to the average payment rate of the last two years. This corresponds to a payout ratio of 57% of the consolidated net profit.
The last four years were characterized by operational investment varying between 5.0% and 8.0% of Sales. We have assumed a weight of 7% on sales, the average of the available historical data.
As referred previously, the realized investment will only be only operational, so it is assumed that only the rubric “Property, Plant and Equipment” will be affected.
For the depreciation it was assumed a flat rate of 10% for the all 5 year period. This assumption is in line with the average rate until 2009 (2010 with a 15% rate was not a normal year and therefore it was not considered).
In 2010 the minority interests represented 16% of the Net Profit. In this analysis it was assumed that these interests will remain flat and that their respective dividends will be distributed in the year they were generated.
4.1.1.4. Net Working Capital and Cash
The Net Working Capital is directly associated with the level of activity of the firm. As no major changes in the industry framework are expected, it was assumed that for all main items such as trade debtors, trade creditors and inventories, the respective percentage on sales will follow the trends of the historical data (15% for the inventories, 20% for the trade receivables and 6% for the trade payables). The cash will remain unchanged until 2015 at the 2010 level (appendix 4 for Secil base case balance sheet).
4.1.1.5. Financial Leverage
As presented in appendix 8 to calculate the market value of the debt, we have followed the Damodaran approach of considering the Book Value of the debt equivalent to the face value of a coupon bond and the market value the present value discounted at the net cost of debt of the interest payments during the weighted average maturity of the debt, in this case assumed 5 years.
The Book Value of the Debt used in this calculation included the Interest-bearing loans and borrowings, short and long term, plus leases minus cash, i.e., the Net Debt.
Sofia Ferreira Cardoso M&A: The Case of Secil and Lafarge Betões 42/61 The Market value of the Debt that was calculated was € 124 million in 2010 versus the Book Value of the Debt of € 79 million values that will significantly decrease across the 5 year period since debt maturity is 5 years (appendix 8 for the rest predicted period).
To calculate the Equity Market Value, it was followed the suggestion from Damodaran of using a multiple based upon quoted firms as represented in appendix 9.
Between the several multiples described in the Ernest & Young ‘Cement’ - ing growth: the EV/EBITDA, ROCE (%) and the EV/tone, our choice was the EV/EBIDTA because it focus the valuation on the financial results and not the product output as the EV/Tone and also to allow the Secil with Lafarge Betões comparison in the merged case (ratio is based upon tones of cement that is not produced by Lafarge Betões).
We have assumed the European average of 7.8 for the EV/EBITDA multiple to calculate the Equity Market Value. The value that was calculated for the Enterprise Value was € 1 billion and thus an Equity Market value (EV-market Value of Debt) of € 876 million for 2010 as presented in appendix 9, where can be consulted for the 5 year forecasted period.
4.2. Lafarge Betões Stand alone valuation
4.2.1. Cash Flow
4.2.1.1. Revenue Growth
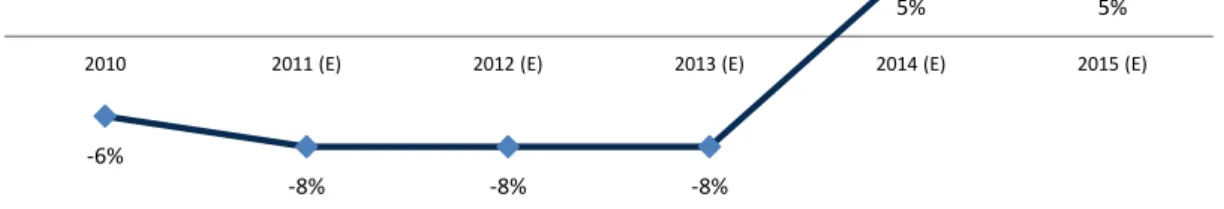
As mentioned before, Lafarge Betões only operates in the concrete and aggregates markets that, as they depend of the same factors, are expected to follow the same tendencies of the cement industry. For the optimistic scenario it was consider the forecast of CEMBUREAU for 2011, in which it is
considered a decrease of 8% in the construction business. This decrease will be assumed for the explicit period of 2011 – 2013 in Portugal. Figure 15 represents revenues growth rates
Figure 15: Revenues growth rate – The optimistic scenario
Source: Cembureau 2011 and forecasts of this study -6%
-8% -8% -8%
5% 5%
Sofia Ferreira Cardoso M&A: The Case of Secil and Lafarge Betões 43/61 For the pessimistic scenario is more pessimistic it was considered, for Portugal the ATIC forecast from 2011 to 2012.
See figure 16 below represents growth rates, only for Portugal, for the pessimistic scenario considered for Lafarge Betões.
Figure 16: Revenues growth rate – The pessimistic scenario
Source: ATIC and Global Cement Report (9th edition) and forecasts of this study.
For the Base Case the growth rates that were assumed are similar to the growth rates assumed for Secil in Portugal, the only market where Lafarge Betões operates.
In all the 3 scenarios – Base Case, Optimistic and Pessimistic - it was assumed a Terminal Value after 2015, for the Portuguese market, considering a flat growth of 3%/year, as for Secil.
4.2.1.2. Operating Costs
The cost structure assumed for the future periods will also be similar to the 2010 cost structure, which is represented in figure 17.
Figure 17: % on revenues for Lafarge Betões
4.2.1.3. Dividends, CAPEX and Depreciation
Lafarge Betões does not distribute dividends as shown in Lafarge Betões historical data; therefore it was assumed that this policy will remain in the future.
-6%
-15% -14%
-5% -5% -5%
2010 2011 (E) 2012 (E) 2013 (E) 2014 (E) 2015 (E)
4% 96%
Portugal
Operating Costs EBITDA