BJRS
RADIATION SCIENCES
07 (2019) 01-21ISSN: 2319-0612 Accepted 2018-10-30
Quality control of radiotherapy treatment plans with
electrons
Campos
aL.T., da Rosa
bL.R., Batista
bD., Braz
cD.
a
Departamento de Física Aplicada e Termodinâmica – DFAT/UERJ, Rio de Janeiro- RJ, Brazil
b Instituto de Radioproteção e Dosimetria – IRD/CNEN, Rio de Janeiro- RJ, Brazil c
laboratório de Instrumentação Nuclear – COPPE/UFRJ, Rio de Janeiro- RJ, Brazil tc_luciana@yahoo.com.br
ABSTRACT
In this work, the quality of the treatment planning generated by Eclipse commercial treatment planning system for electron beams of energy 9 and 20 MeV was verified and their accuracy in the calculation of dose distributions for several clinical situations was evaluated. Tests cases had been developed according to the Bra-zilian reality, having as reference the radiotherapy treatments carried out in the Instituto Nacional do Câncer. The system developed for checking the quality of treatment planning systems with electrons was efficient in evaluating the Eclipse planning system by identifying the failures of their algorithms, especially in planning the isodose. The verification system has been validated against the Monte Carlo method and the experimental data with an ionization chamber and showed the shortcomings of generalized pencil beam and eMC algorithms. The deviation of the results obtained with the Monte Carlo in relation to the eMC algorithm is higher than 3%, tak-ing into account the statistical fluctuation inherent in the system in some case tests.
1. INTRODUCTION
The main objective of radiotherapy is to deliver the highest possible dose to the tumor, in order to destroy it, reducing as much as possible the doses to healthy tissues adjacent to the target volume. Therefore, it is necessary to do a planning of the treatment. The more complex is the treatment, the more difficult the planning will be, demanding computation sophisticated methods in its execution, in order to consider the heterogeneities present in the human body.
Electron beam radiotherapy has been the choice of treatment for skin and superficial malignancies for decades. At beam energies available in a typical linear accelerator usually ranging from 4 MeV to 20 MeV, the dose is deposited within several centimeters from patient’s surface being larger 70% of the maximum dose and the dose to underlying tissues being low owing to the sharp dose fall-off. The surface dose and the penetration range of the electron beam can be modified by using tissue equivalent bolus materials. One of the major challenges in electron beam radiotherapy is the accuracy of the dose calculation. While the dose calculation accuracy of pencil beam algorithm is considered satisfactory on homogeneous calculation geometries at standard source-to-surface distances (SSD), in phantoms with heterogeneities and surface curvature and with non-standard SSDs, large discrepancies have been reported. To a large extent, the challenges originate from insufficient modeling of large angle scattering and the assumption slab-like calculation geometries [1, 2].
Monte Carlo (MC) algorithms are widely accepted as being the most precise method to calculate dose distributions for radiotherapy [3]. MC codes are able to track individual particles and their secondary particles based on the underlying physical laws. Interactions can be explicitly simulated for every particle. This property makes MC calculations very accurate, but also time-consuming. During the last decade, MC based algorithms for electron beam treatment planning have been developed that allow for accurate dose calculation while keeping calculation times reasonably short, thereby enabling clinical usage. This is achieved with variance reduction techniques [4] or by making simplifications to the MC particle transport by pre-calculating data and appropriately applying it to the specific patient geometry.
In this work, the quality of the treatment planning generated by Eclipse commercial treatment planning system for electron beams of energy 9 and 20 MeV was verified and their accuracy in the
calculation of dose distributions for several clinical situations was evaluated. Tests cases had been developed according to the Brazilian reality, having as reference the radiotherapy treatments carried out in the Instituto Nacional do Câncer (INCA). The performance of this algorithm has been investigated by comparing calculated dose distributions to measurements in homogeneous and heterogeneous phantoms.
2. MATERIALS AND METHODS
The Eclipse planning system developed by Varian Medical Systems was used in this work to determine the absorbed dose so that these could be compared with the experimental data and data obtained with Monte Carlo via the EGSnrc code. This planning system has two dose calculation algorithms: Generalized Pencil Beam, and eMC. It also contains an interface with the computer tomography, through which you can transport the image files from the tomography to your graphic viewer.
2.1. The Monte Carlo treatment planning system
The Macro Monte Carlo algorithm (MMC) [5-7] has been implemented into the treatment plan-ning system (TPS) Eclipse v.11 by Varian Medical Systems, Palo Alto, CA, where is named eMC (electron Monte Carlo). It is a fast implementation of a Monte Carlo simulation of the dose deposi-tion of high energy electrons beams. The eMC algorithm consists of two models; the Initial Phase Space (IPS model) [5] which models the electron beam emerging from treatment head, and the Macro Monte Carlo Transport (MMC) transport model [7], which calculates the dose deposition in the material as the electron travels through the material. The eMC algorithm models each individual primary electron interaction along with secondary electron interactions, and for that reason can re-quire both large amount of computer processing power and long calculation times in order to achieve an accurate dose distribution [8].
The MMC algorithm uses precalculated data track electrons through the patient geometry. The precalculated data arises from EGSnrc MC calculations for a sphere geometry. Repeated simula-tions for a single electron being tracked through the sphere are performed to determine the
probabil-ity distributions functions (PDF) for exit position, direction and energy of the electron. The electron transport in the TPS is based on sampling values from the PDF database. The electrons trajectory through matter is transformed into a chain of spheres, where the location of each sphere is depend-ent on the position and direction of the primary electron exiting the previous sphere. A simplified scattering model is used to account for energy deposited by secondary particles [7, 8]. The density value of a sphere in the patient geometry is determined by the average density of the voxels it co-vers. For the dose calculation this density is randomly substituted with one of two densities for which precalculated PDF exist. These two densities are the adjacent densities of the average voxel density available in the PDF database. This method is used because of the large amounts of densi-ties and materials for which PDFs have been precalculated [9].
In the eMC implementation, the user is enabled to adjust several parameters that affect tion times and accuracy [10]. The most important ones being the target statistical accuracy, calcula-tion grid size, smoothing method and smoothing strength. The significant impact of these parame-ters on dose distributions has been shown by Ding et al.[11] and Popple et al. [12]. The target statis-tical accuracy is defined as the average statisstatis-tical uncertainty of all voxels with doses larger than 50% of Dmax. Smoothing is optional and can be performed by means of a 3D Gaussian filter or a 2D
Median filter. Both can be applied with three different smoothing strengths. The maximum amount of particle histories and the random generator seed can be chosen, as well as an accuracy limit for the monitor unit (MU) calculation.
The eMC algorithm has six calculation parameters that can be chosen by the user: calculation grid size, accuracy, the maximum number of particle histories, random seed numbers generator, methods and levels of smoothing. The influence of the parameters was previously evaluated by FORTES [13] for INCA. It was also verified the agreement between data measured and calculated by eMC simulating a very recurrent clinical situation in the institution. From this study were gener-ated the parameters that would be best cost-effective for the hospital in relation to the agreement obtained with the planning system and the time. Table 1 explains the value of each parameter used in this work as well as its meaning.
Table 1: Value of each eMC parameter used in this work as well as its meaning.
Parameter Values Description
Calculation
grid size 0.25 cm
Dose voxel size in CT image plane. The longitudinal voxel size is the same as the CT pixel spacing
Accuracy 1.0 Mean statistical uncertainty within the high dose volume Maximum
number of particle histories
0
Specifies the maximum number of particles to be transported in a calculation. Calculation stops once the set number of particles has been transported in a calculation. Calculation stops once the set number of particles has been transported even if the desired
accuracy is not reached, Option off if set to 0. Random seed
number generator
39916801 Set start point of the random number generator
Smoothing method
3D Gaussian
Convolves the dose distribution with a three-dimensional Gaussian, the standard deviation of which is defined by the
smoothing level Smoothing
level 3-Strong
2D-Medium:neighborhood=1.5 cmx1.5 cm
3D-Gaussian:standard deviation =1.5 x calculation grid size
For each result obtained with planning system an output file in .dat or .dcm format was ob-tained. The dose profiles and the PDDs for each test case were obtained from the Eclipse planning system in .dat files, and the output files for the dose plans are obtained in .dcm format.
The output files of the dose profiles and PDD's can be exported for further comparison with the data obtained experimentally and by Monte Carlo. The output files for the dose plans are image files and were compared by the Verisoft [14] commercial imaging program from Varian Medical Systems.
2.2. Verification tests experiments
Eight tests were chosen based on clinical experience at Instituto Nacional do Câncer. The tests represent several clinical situations, including energy variation, electron applicator, irregular field
form, and lung and bone heterogeneities in order to verify the efficiency of the dose calculation algorithms present in the treatment planning systems with electrons beams. All tests were per-formed with a source surface distance of 100 cm. Two energies, 9 and 20 MeV, were considered for tests 1, 2, 3, 4, 5 and 6. The tests 7 and 8 were done with 20 MeV energy electron beams.
All tests evaluate planar doses with radiochromic films. For each test a field profile in XY plane and a percentage depth dose (PDD) at central axis were obtained. When possible ion chamber measurements were performed. The two measurements were compared with treatment planning algorithms calculation and Monte Carlo.
Test 1: It is important to test the ability of the dose calculation algorithm to obtain the exact
dose distribution in the reference field size (10x10 cm2).
Test 2: Dose distributions were obtained with a rectangular block of size 3x12 cm2 coupled in a 15x15 cm2 applicator.
Test 3: In many treatments with electrons beams it is necessary that the irradiation beam is
ro-tated at a certain angle. In oblique beam treatments the dose distribution changes in relation to the treatment with the beam perpendicular to the patient/simulator. To verify the dose calculation a test case was established wherein the gantry was rotated at 30°. The treatment field for this test case was 15x15 cm2.
Test 4: In the electrons treatment, it is possible to use circular fields. In this case, a blocked
rec-tangular field with a central circular aperture is usually used. To verify the absorbed dose calcula-tion for this treatment a test was created in which the field is circular and obtained from a rectangu-lar field locked with cerrobend ®. The applicator that will be used is 15x15 cm2 with circular aper-ture of 5 cm in diameter.
Test 5: In many treatments it is necessary to use an irregular field. To verify the dose calculation
an octagonal block was constructed to be used in a 15x15 cm2 applicator.
Test 6: The ability of obtaining the exact dose distribution in a small square field size of 3x3
cm2 was tested. The block was inserted into a 6x6 cm2 applicator.
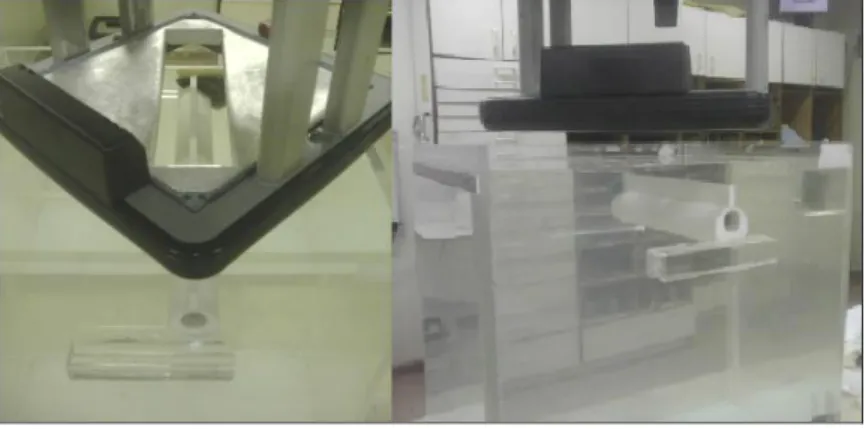
Test 7: The geometry of this test case simulates spinal cord irradiation. In this type of
irradia-tion, only the energy of 20 MeV was used. A relatively large applicator (20x20 cm2) blocked with cerrobend® will be used to produce a rectangular field diagonal of the square field of 25x5 cm2.
To test the accuracy of the dose calculation in complex fields containing high density heteroge-neity in three dimensions a polyvinyl chloride simulator, PVC was constructed. The gantry was angled at 0 degrees and the collimator at 45 degrees.
The planar dose was obtained at 3.5 cm depth. It was measured inside the PVC cavity. The ex-perimental arrangement is illustrated in figure 1.
Test 8: A three-dimensional lung heterogeneity test case was developed to test the accuracy of
calculation in the presence of low density heterogeneity. A chest simulator, produced by PTW, was used, which contains a lung tissue equivalent. The phantom is composed of four acrylic slabs with a 3 cm thickness in a chest format that simulates the soft tissue. Two slabs have cavities that allow the insertion of four lung simulators with a density of 0.3 g/cm3, composed of lung equivalent material as described in ICRU 44 [15]. The other two slabs are composed of acrylic only.
Figure 1: Spinal cord verification test. The water phantom contains heterogeneity in 3 D
construced by PVC.
Source: the author
The same cerrobend block used in test 2 was used in this experimental arrangement. The chest simulator was aligned to the central axis of irradiation in order to obtain a planar dose at the inter-face of the lung-acrylic heterogeneity. After this, the irradiation field was displaced 4 cm from the central axis to include a part of acrylic and a part of the lung. The dose profile and the planar dose were obtained at the depth of 6 cm. The 20 energy was used.
2.3. Measurements
The measurements were done considering 9 and 20 MeV electrons beams generated by a Varian Clinac 2300 C/D linear accelerator.
The phantom used was a 40x40x40 cm3 Wellhofer water phantom scanning system. It was used for the acquisition of beams profiles and depth dose percentage curves of all the tests. The measurements were made using ionization chambers for field and reference. The ionization cham-ber used was the Exradin A16 from the manufacturer Standard Imaging and an Advanced Markus plane-parallel ionization chamber with 0.02 cm3 was used to measure the depth dose curves. The Exradin A16 chamber has a volume sensitive of 0.007 cm3, allowing a good spatial resolution. Due to its small size it presents a low signal, generating bigger noises. The reference chamber used was IC 15, with a volume sensitive of 0.15 cm3. It was positioned near the edge of the radiation field, attached to the linear accelerator head. The field camera reading is divided by reading the reference camera. This eliminates the effect of beam variation during data acquisition.
2.4. Varian 2300C/D :features and modeling
Two EGSnrc codes were used to perform the Monte Carlo simulation of the verification tests used in this work, BEAMnrc[16,17] and DOSXYZnrc [18]. With BEAMnrc, the accelerator head was simulated with the size and shape field considered. The result of this simulation is a phase space file used in DOSXYZnrc as the source for calculating dose profiles, field profiles and dose plans. In some cases, when the experimental arrangement allowed a CT scan was obtained and it was used in the DOSXYZnrc code as dose calculation geometry.
BEAMnrc is a general-purpose Monte Carlo transport package, which could be used in a wide variety of applications besides simulating radiation therapy beams. The features in the BEAMnrc includes the use of the component modules (CMs), information about particles storage, track of the history of each particle, application of various variance reduction techniques, they provide files/structure for parallel processing, which are developed in a user friendly interface. Component modules are actually a variety of elementary entities and can be used to represent the components of an accelerator. Each CM dealt with a specific class of geometric shape and is contained between
two planes, which are perpendicular to the beam axis. No overlapping between CMs is allowed. Each CM operates completely independent of the other.
Using the BEAMnrc code, the accelerator treatment head an electron applicator was simulated to yield a data file containing the phase space information for millions of particles exiting the treatment head [16].
The model consists of a series of component modules. The result of a simulation was a phase space file. This file was scored at a source surface distance of 100 cm. A monoenergetic incident electron beam with Gaussian radial distribution was used to match the experimental values of R50. The Gaussian energy distribution spectra were iteratively adjusted, using their full width at half maximum (FWHM), in order to obtain a good agreement between simulated and experimental values of R50.
The incident electron energy is the primary tuning parameter for electron beam simulations. A good match for depth-dose curves requires an accurate mean energy, properly broadened peak in the initial spectrum and a better agreement for the slope of depth dose curves. In electron beam calculations the incident electron beam energy is iteratively adjusted to give the measured values of R50. A change of 0.2 MeV in the electro energy corresponds to about a 1 mm in beam range, according to equation 1 for water [19].
50
33
.
2
xR
AE
(1)The number of histories for BEAMnrc calculation was 500 million. The energy cutoff was 0.01 keV for photons and 0.7 keV for electrons. When particle reaches this cutoff values their energy were scored locally.
2.5. Dose calculations
The dose calculation code, DOSXYZnrc, simulates the passage of source particles through a phantom comprised of dose calculation voxels of variable density and composition. Voxels are ar-ranged in a 3D Cartesian grid, the grid spacing in any dimension considered is independent from the other 2 dimensions and is not necessarily constant. DOSXYZnrc permits a variety of radiation source geometries and energies; including monoenergetic point sources confined to a square field or
sources read directly from phase-space files such as those provided by BEAM, and sources recon-structed using various beam models. The output of a DOSXYZnrc calculation is a file that stores the calculated 3D dose distribution data and the corresponding dose uncertainties of all the voxels. The calculated dose values are normalized per incident history. The STATDOSE [20] utility pro-gram, provided in the BEAMnrc software package was used to analyze the 3D dose files. The dose file was transformed into PDD, field profiles and dose plans, allowing the comparison between the experimental data and those obtained with the planning systems.
In this study, an entire homogeneous phantom of water with 30x30x30 cm2 consisted of cubic voxels; 0.25x0.25x0.3 cm3 was used. With the geometry considered in this work, it was obtain PDD curves and profiles at a fix depth, considering the field width. 1011 histories were run for each calcu-lation and the relative statistical dose error (uncertainty as a fraction of dose in the voxel) was found to be around 1%.
3. RESULTS AND DISCUSSION
In order to use the spectrum obtained from the Varian Clinac 2300 C/D accelerator head simula-tion, the PDD curve was compared to a 10x10 cm2 field size for water generated by the DOSXYZnrc code with a curve obtained experimentally, using an ionization chamber, for the same field size. The graph for energy of 9 MeV is shown in Figure 2.
Figure 2: Comparison of the PDD for the field 10x10 cm2 and energy 9 e 20 MeV between the re-sult obtained with Monte Carlo simulation and the experimental data obtained with the ionization chamber and the Eclipse planning system.
The Varian Clinic 2300 C/D accelerator head simulation was performed according to specifica-tions provided by Varian Medical Systems. Despite using the manufacturer's own specificaspecifica-tions, the incident energy adjustment was necessary so that the experimental and simulated PDD curves had a good agreement.
The maximum deviation between experimental and simulated PDD curves was 1%, indicating a good agreement between them and proving the quality of the spectrum used in the simulations for all depths. Therefore, the accelerator geometry was validated and used for the simulation of the test cases.
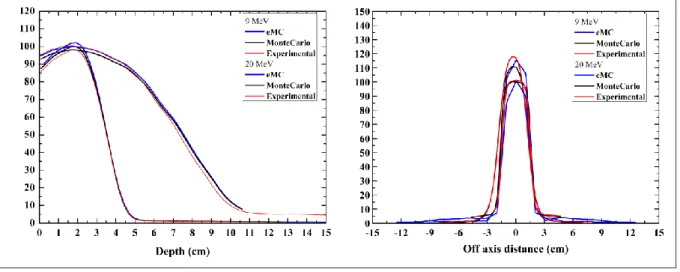
Most accelerators require the use of cerrobend protection blocks to form rectangular fields. In this test we used a rectangular field of dimensions 3x12 cm2 produced by a cerrobend block inserted in the electron applicator and figure 3 shows the field profile and PDD profiles with ionization chamber, Monte Carlo simulation and Eclipse planning system for the 9 and 20 MeV energies.
Figure 3: Comparison of the profile and PDD for the field 3x12 cm2 and energy 9 and 20 MeV be-tween the results obtained with Monte Carlo simulation and the experimental data obtained with the ionization chamber and the Eclipse planning system.
Figure 3 shows the results obtained for a field 3x12 cm2 for the energy of 9 MeV showed a maximum deviation greater than 3% comparing the results of the Monte Carlo and ionization chamber. While for the eMC algorithm there is a statistical fluctuation inherent in the planning sys-tem, generating a very noisy dose profile even using the system smoothing process. This fact leads to a statistical uncertainty of this result and a deviation from Monte Carlo by more than 3%. How-ever, as seen in figure 3, the deviation between Monte Carlo and the ionization chamber is less than 2% taking into account the treatment field. The deviation of the results obtained with the Monte Carlo in relation to the eMC algorithm is higher than 3%, taking into account the statistical fluctua-tion inherent in the system.
Figure 4 shows the field profile and PDD profiles with ionization chamber, Monte Carlo simula-tion and Eclipse planning system for the 9 and 20 MeV energies.
Figure 4: Comparison of PDD for the field 15x15 cm2 and gantry at 30°, energy 9 and 20 MeV and profile of 20 MeV between the results obtained with MC simulation and the experimental data ob-tained with the ionization chamber and the Eclipse planning system.
For the energies of 9 and 20 MeV, figure 4, it is important to note that the curves generated with the Monte Carlo data obtained through the EGSnrc show a maximum deviation of 1% in relation to the ionization chamber. Regarding the eMC algorithm, the maximum deviation in the treatment interval is 2%. eMC and ionization chamber overestimate the dose in an open field of size 15x15 cm2 angulated to 30 ° for the two energies considered.
However, there is a concordance of the obtained results, ionization chamber, Monte Carlo and planning system for the two energies when comparing the PDD curve along the depth.
In figure 4 the results for field profile for 20 MeV are presented. The results obtained with the Monte Carlo when compared to the ionization chamber show a deviation of less than 2%. But when Monte Carlo is compared to the algorithm of the planning system, deviations about 10% are ob-tained.
Although the PDD curves for the eMC does not agree with the Monte Carlo it is noted a con-cordance after the build-up region. In this region the deviation is less than 2% considering all the
results obtained, with ionization chamber, Monte Carlo and eMC. It is necessary for the planning system to be able to calculate the dose in situations where the gantry is rotated at some angle. This test case evaluates the dose distributions in this situation.
It is necessary that the planning system be able to calculate the dose in circular fields. This test case aims at evaluating the dose distributions in this situation and the figure 5 shows the field pro-file and PDD propro-files with ionization chamber, Monte Carlo simulation and Eclipse planning sys-tem for the 9 and 20 MeV energies.
Figure 5: Comparison of the circular field profile and PDD of radius 5 cm, energy 9 and 20 MeV
between the result obtained with Monte Carlo simulation and the experimental data obtained with the ionization chamber and the Eclipse planning system.
For the 5 cm diameter circular field profile and 20 MeV energy, eMC compared to the ioniza-tion chamber present better agreement with deviaioniza-tion of less than 2%. In this test case there is also agreement with the penumbra calculated and measured. This result can be explained by the lower stopping power variation for 20 MeV energy. For 9 MeV profile, the energy variation is higher at the field edges; consequently the stopping power variation is higher in this region.
For the two energies, presented in figures 5, it is important to note that the curves of the Monte Carlo data obtained through the EGSnrc show a maximum deviation of 1% in relation to the ioniza-tion chamber. Regarding the eMC algorithm contained in the Eclipse planning system, the maxi-mum deviation in the treatment interval is 1%, increasing with depth from the 80% curve. We can observe that there is a variation of the PDD curve for energy of 9 MeV in the region close to the maximum dose, this fact does not occur for energy of 20 MeV.
In cases where it is necessary to use an irregular irradiation field the planning system must cal-culate the dose distributions correctly, figure 6 shows the field profile and PDD graphs for the Mon-te Carlo simulation and Eclipse planning sysMon-tem for the 9 and 20 MeV energies.
Figure 6: Comparison of the profile of an irregular field, energy 9 and 20 MeV between the result
obtained with Monte Carlo simulation and the experimental data obtained with the ionization chamber and the Eclipse planning system.
In figure 6, the measurement with the ionization chamber was not performed. This does not in-validate the comparison of the results because the previous results show a good agreement, less than 1%, between the results obtained with the ionization chamber and calculated using the Monte Carlo method.
In figure 6, the results obtained for profiles of an irregular field are presented. For the two ener-gies shown in figure 6, it is important to note that the curves of the Monte Carlo PDD data obtained
through the EGSnrc show a maximum deviation of 1% in relation to those obtained with the ioniza-tion chamber. Regarding the eMC algorithm contained in the Eclipse planning system, the maxi-mum deviation in the treatment interval is 1%, increasing with depth from the 80% curve.
It is important that the dose calculation algorithm is able to obtain the exact dose distribution for small field sizes smaller than 5x5 cm2. To evaluate this characteristic of the planning system a field of 3x3 cm2 to 100 cm of SSD was used as a test case and figure 7 shows the field profile and PDD calculated through Monte Carlo simulation and Eclipse planning system for the 9 and 20 MeV en-ergies.
Figure 7: Comparison of the profile of a small square field size of 3x3 cm2, energy 9 and 20 MeV between the results obtained with Monte Carlo simulation and the Eclipse planning system.
For test 6 there is agreement of the results obtained with the Monte Carlo planning system for the 9 MeV field profile at a depth of 2 cm. It is possible to observe that this agreement is confirmed in the PDD curves.
For the test case 7 that is showed in figure 8 no measurements were performed with the ioniza-tion chamber because it was not possible to insert the chamber in the depth, which in the case was inside the cavity of the simulator constructed for this test case, in which the comparisons were in-tended.
Figure 8: Comparison of the profile of a rectangular field of size 3x12 cm2, energy 20 MeV be-tween the results obtained with Monte Carlo simulation and the Eclipse planning system.
The results obtained with the Monte Carlo method when compared to the results obtained with the eMC algorithm obtained through the Eclipse planning system show a good concordance of less than 2% of the results within the heterogeneity. In the region of bone-water interface, the eMC algo-rithm demonstrates a lower dose in the region whereas the Monte Carlo calculation through the EGSnrc predicts the change in heterogeneity. This phenomenon can be explained by the region with the bone heterogeneity having a higher density. The electron that migrates to the low density region causes an increase absorbed dose at the interface until the charged particles equilibrium is reached and then there is a decrease in the absorbed dose in the low region density.
Test 8 evaluates the planning system in a situation of lung heterogeneity. A comparison of the results for the field profile on the y-axis (largest side of the field) is presented in figure 9, for the field profile 3x12 cm2 on the x-axis (smaller side of the field). For this test case no measurements with ionization chamber were performed due to the impossibility of inserting the chamber at the depth required for the test case between the lung heterogeneity at depth of 6 cm.
Figure 9: Comparison of the profile of a rectangular field of size 3x12 cm2, energy 20 MeV be-tween the results obtained with Monte Carlo simulation and the Eclipse planning system.
It can be observed that the eMC algorithm obtained through the Eclipse planning system for the profile on the x-axis shows a better concordance in the depth of 2 cm, even though the deviation occurs an underdosing of up to 10% when compared to the results obtained with the Monte Carlo method calculated by EGSnrc for the test 8. For the profile on the y-axis, the eMC algorithm pre-sents better agreement with the Monte Carlo method. However, the eMC algorithm is not able to accurately predict the change in acrylic-lung heterogeneity. At the interface, the Monte Carlo meth-od predicts an increase in the absorbed dose taking into account the shift from a denser medium to a lower density medium which is the lung material to a balance with the low density medium where the Monte result Carlo predicts a drop in absorbed dose values in the region of lung heterogeneity.
4. CONCLUSIONS
This work presents comparisons of dose distributions determined using EGSnrc, eMC and measurements for 9 and 20 MeV electron beams from Varian linear accelerator. For this purpose different test configurations were defined. While for some configurations the dose distributions
agree, there are some disagreements documented for others. The deviations between eMC and measurements might be due to the fact that we use different calculation settings, e.g. smoothing.
Although smoothing is an option provided for eMC, smoothing for the final dose calculation could be used with caution as the dose is systematically distorted. This has been investigated by Ding et al. [11].
The most accurate results are obtained using the smallest grid spacing, the highest statistical precision and an appropriate level of smoothing. However, for practical reasons, the choice would be limited by calculation time. These parameters in this work were chosen to best achieve the practical calculation time and accuracy.
The system developed for the verification of the quality of electron treatment planning systems proved to be efficient in the evaluation of the Eclipse planning system, identifying the failures of its algorithms, especially in the isodose planning. The verification system was validated in relation to the Monte Carlo method and the experimental data with ionization chamber and showed the failures of the Eclipse eMC algorithm.
The comparison of the data obtained by Monte Carlo simulation, or by ionization chamber, with those generated by the Eclipse® planning system, using the different dose calculation algorithms, reveals that the approximations used in the algorithms prevent them from correctly calculating the changes That occur within or close to heterogeneities.
It should be noted that in cases with lung and bone heterogeneities, the approximations used in the eMC algorithm present in Eclipse prevent it from calculating the dose changes that occur within or close to these heterogeneities. In these test cases this dose calculation algorithm underestimates the dose in the low density regions and does not take into account the dose changes at the interfaces.
REFERENCES
[1] HOSTROM, K.R.; ALMOND, P.R. Review of electron beam therapy physics. Phys. Med. Biol. 2006;51:R455-89.
[2] OJALA, J.; KAPANEN, M.; HYÖDYNMA, S. Full Monte Carlo and measurement-based performance assessment of improved clinical implementation of eMC algorithm with emphasis on lower energy range. Physica Medica. 2016; (32) 801-811.
[3] CHETTY, I.J; CURRAN,B.; CYGLER, J.; DEMARCO,J.J.; EZZELL, G.; FADDEGON, B.A. et al. Report AAPM Task Group No. 105: Issues associated with clinical implementation of Monte Carlo-based-photon and electron external beam treatment planning. Med Phys. 2007; 34:4818-53.
[4] SHEIKH-BAGHERI, D.; KAWRAKOW,I.; WALTERS, B.; ROGERS,D.W.O. Monte Carlo simulations: Efficiency Improvement Techniques and Statistical Considerations, Published in: Integrating New Technologies into the Clinic: Monte Carlo and Image-Guided Radiation Therapy, Proceeding 2006 AAPM Summer School. Madison WI. Medical Physics Publishing; 2006.
[5] JANSEN, J.J.; KOREVAAR, E.W.; VAN BUTTUM, L.J.; STORCHI, P.R.; HUIZENGA, H. A model to determine the initial phase space of a clinical electron electron beam from measured data. Phys. Med. Biol. 2001;46(2):269-86.
[6] DING, G.X.; DUGGAN, D.M.; LU, B. et al. Impact of inhomogeneity corrections on dose coverage in the treatment of lung cancer using stereotactic body radiation therapy. Med Phys 2007; 34:2985-94.
[7]NEUENSCHWANDER, H., MACKIE,T.R.; RECKWERDT, P.J. MMC – a high performance Monte Carlo code for electron beam treatment planning. Phys Med Biol. 1995;40(4):543-74. [8] FRAGOSO, M.; PILLAI, S.; SOLBERG, T.D.; CHETTY, I.J. Experimental verification and
clinical implementation of a commercial Monte carlo electron beam dose calculation algorithm.
Med Phys. 2008; 35(3):1028-38.
[9] NEUENSCHWANDER, H.; BORN, E.J. A macro Monte Carlo method for electron beam dose calculations. Phys Med Biol. 1992;37:107-25.
[10] Eclipse Planning Reference Guide Algorithms P/N B401653R01I;2004.
[11] DING, G.X.; DUGGAN, D.M.; COFFEY, C.W.; SHOKRANI, P.; CYGLER, J. First macro Monte Carlo based commercial dose calculation module for electron beam treatment planning – new issues for clinical consideration. Phys. Med Biol. 2006;51:2781-99.
[12] POPPLE, R.A; WEINBER, R.; ANTOLAK, J.A.; YE, D.J.; PAREEK, P.N.; DUAN, J. et al. Comprehensive evaluation of a commercial macro Monte Carlo electron dose calculation implementation using a satandard verification data set. Med. Phys. 2006;33:1540-51.
[13] FORTES, S.S. Algoritmo para o Cálculo de Feixes Clínicos de Elétrons eMC: Comissionamento e Avaliação, Trabalho de Conclusão de Curso, Instituto Nacional do
Câncer, 2009.
[14] User Manual VerisoftTM, PTW Freiburg, Germany, 2006.
[15] ICRU (International Comission on Radiation Units and Measurements), Report 44, Tissue
Substitutes in Radiation Dosimetry and Measurement, ICRU Publications, Washington DC,
1989.
[16]ROGERS, D.W.O.; FADDEGON, B.A.; DING, G.; MA, C.M.; WE, J.; MACKIE, T.R. BEAM:a Monte Carlo simulate radiotherapy treatment units. Med. Phys. 1995, 22 503-524. [17] KAWRAKOW I, ROGERS DWO, WALTERS B. BEAMnrc User’s Manual. Technical
Report PIRS-509, 2013. National Research Council of Canada, Ottawa, Canada.
[18] KAWRAKOW,I.; ROGERS, D.W.O.; WALTERS, B. DOSXYZnrc Users Manual, Technical
Report PIRS-794, 2005. National Research Council of Canada, Ottawa, Canada.
[19] SEGO Z. Multiple-source models for the beams from an Elekta SL25 clinical accelerator. 2006. Master Thesis, Ottawa-Carleton Institute of Physics.
[20] MCGOWAN, H.C.E.; FADDEGON, B.A.; MA C-M. STATDOSE for 3D distributions.